网络策略为 Pod 提供微分段,就像网络安全组 (NSG) 为 VM 提供微分段一样。 Azure 网络策略管理器实现支持标准的 Kubernetes 网络策略规范。 可以使用标签来选择一组 Pod 并定义入口和出口规则的列表,以筛选从这些 Pod 出入的流量。 在 Kubernetes 文档中详细了解 Kubernetes 网络策略。
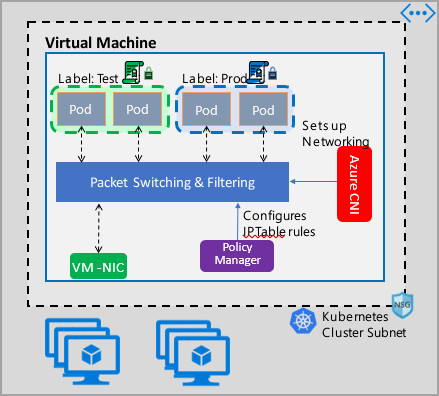
Azure 网络策略管理实现适用于为容器提供虚拟网络集成的 Azure CNI。 Linux 和 Windows Server 支持网络策略管理器。 此实现通过配置允许和拒绝 IP 规则来强制执行流量筛选,这些规则基于 Linux IPTables 或 Host Network Service (HNS) ACLPolicy for Windows Server 中定义的策略。
规划 Kubernetes 群集的安全性
为群集实现安全性时,请使用网络安全组 (NSG) 来筛选出入群集子网的流量(北-南流量)。 为群集中 Pod 之间的流量(东-西流量)使用 Azure 网络策略管理器。
使用 Azure 网络策略管理器
Azure 网络策略管理器可以通过下述方式来使用,以便为 Pod 提供微分段。
Azure Kubernetes 服务 (AKS)
网络策略管理器在 AKS 中以本机方式提供,并且可在创建群集时启用。
有关详细信息,请参阅在 Azure Kubernetes 服务 (AKS) 中使用网络策略保护 Pod 之间的流量。
Azure 中的自制 (DIY) Kubernetes 群集
对于 DIY 群集,请先安装 CNI 插件,然后在群集中的每个虚拟机上启用它。 如需详细说明,请参阅为自行部署的 Kubernetes 群集部署插件。
部署群集后,请运行以下 kubectl 命令来下载 Azure 网络策略管理器 daemon set 并将其应用到群集。
对于 Linux:
kubectl apply -f https://raw.githubusercontent.com/Azure/azure-container-networking/master/npm/azure-npm.yaml
对于 Windows:
kubectl apply -f https://raw.githubusercontent.com/Azure/azure-container-networking/master/npm/examples/windows/azure-npm.yaml
此解决方案也是开源的,代码在 Azure 容器网络存储库中提供。
使用 Azure NPM 监视和可视化网络配置
Azure 网络策略管理器包含信息丰富的 Prometheus 指标,可用于监视和更好地了解你的配置。 它在 Azure 门户或 Grafana 实验室中提供了内置的可视化效果。 你可以使用 Azure Monitor 或 Prometheus 服务器开始收集这些指标。
Azure 网络策略管理器指标的优点
以前,用户只能使用在群集节点内运行的 iptables 和 ipset 命令了解其网络配置,这会产生冗长且难以理解的输出。
总体而言,这些指标提供:
策略、ACL 规则、IPSet、IPSet 条目和任何给定 IPSet 中条目的计数
单个 OS 调用和处理 kubernetes 资源事件的执行时间(中位数、第 90 百分位和第 99 百分位)
有关处理 Kubernetes 资源事件的失败信息(当 OS 调用失败时,这些资源事件将失败)
指标用例示例
通过 Prometheus AlertManager 发出警报
请参阅下面的这些警报的配置。
当网络策略管理器出现 OS 调用失败或转换网络策略时,将发出警报。
当为创建事件应用更改的中值时间超过 100 毫秒时,将发出警报。
通过 Grafana 仪表板或 Azure Monitor 工作簿进行可视化和调试
查看策略创建的 IPTables 规则数量(如果拥有大量 IPTables 规则,则可能会稍微增加延迟)。
将群集计数(例如 ACL)与执行时间关联。
在给定的 IPTables 规则中获取 IPSet 的易记名称(例如,
azure-npm-487392表示podlabel-role:database)。
所有受支持的指标
下面列出了支持的指标。 任何 quantile 标签都有可能的 0.5、0.9 和 0.99 值。 任何 had_error 标签都有可能的 false 和 true 值,这些值表示操作是成功还是失败。
| 指标名称 | DESCRIPTION | Prometheus 指标类型 | 标签 |
|---|---|---|---|
npm_num_policies |
网络策略数 | 仪表 | - |
npm_num_iptables_rules |
IPTable 规则数 | 仪表 | - |
npm_num_ipsets |
IPSet 数 | 仪表 | - |
npm_num_ipset_entries |
所有 IPSet 中的 IP 地址条目数 | 仪表 | - |
npm_add_iptables_rule_exec_time |
用于添加 IPTable 规则的运行时 | 概要 | quantile |
npm_add_ipset_exec_time |
用于添加 IPSet 的运行时 | 概要 | quantile |
npm_ipset_counts(高级) |
每个 IPSet 中的条目数 | GaugeVec |
set_name & set_hash |
npm_add_policy_exec_time |
用于添加网络策略的运行时 | 概要 |
quantile & had_error |
npm_controller_policy_exec_time |
用于更新/删除网络策略的运行时 | 概要 |
quantile、had_error 和 operation(值为 update 或 delete) |
npm_controller_namespace_exec_time |
用于创建/更新/删除命名空间的运行时 | 概要 |
quantile、had_error 和 operation(值为 create、update 或 delete) |
npm_controller_pod_exec_time |
用于创建/更新/删除 Pod 的运行时 | 概要 |
quantile、had_error 和 operation(值为 create、update 或 delete) |
对于每个“exec_time”汇总指标,还有“exec_time_count”和“exec_time_sum”指标。
可以通过用于容器的 Azure Monitor 或 Prometheus 抓取指标。
为 Azure Monitor 设置
第一步是为 Kubernetes 群集启用用于容器的 Azure Monitor。 可在用于容器的 Azure Monitor 概述中找到相关步骤。 启用用于容器的 Azure Monitor 后,请配置用于容器的 Azure Monitor ConfigMap 以启用网络策略管理器集成和 Prometheus 网络策略管理器指标的收集。
用于容器的 Azure Monitor ConfigMap 有一个 integrations 部分,其中具有用于收集网络策略管理器指标的设置。
默认情况下,这些设置在 ConfigMap 中处于禁用状态。 启用基本设置 collect_basic_metrics = true 后,会收集基本的网络策略管理器指标。 启用高级设置 collect_advanced_metrics = true 后,除了收集基本指标外,还会收集高级指标。
编辑 ConfigMap 后,将其保存在本地,并按如下所示将 ConfigMap 应用到群集。
kubectl apply -f container-azm-ms-agentconfig.yaml
以下是用于容器的 Azure Monitor ConfigMap 的片段,其中显示了通过高级指标收集启用的网络策略管理器集成。
integrations: |-
    [integrations.azure_network_policy_manager]
        collect_basic_metrics = false
        collect_advanced_metrics = true
高级指标是可选的,打开它们将自动启用基本指标收集。 高级指标当前仅包含 Network Policy Manager_ipset_counts。
详细了解 ConfigMap 中用于容器的 Azure Monitor 收集设置。
Azure Monitor 的可视化选项
启用网络策略管理器指标收集后,可以使用容器见解或 Grafana 查看 Azure 门户中的指标。
在 Azure 门户中查看群集的见解
打开 Azure 门户。 进入群集的见解后,导航至“工作簿”并打开“网络策略管理器 (NPM) 配置”。
除了查看工作簿之外,还可以在“见解”部分下的“日志”中直接查询 Prometheus 指标。 例如,此查询将返回所收集的所有指标。
| where TimeGenerated > ago(5h)
| where Name contains "npm_"
还可以直接向 Log Analytics 查询指标。 有关详细信息,请参阅 Log Analytics 查询入门。
在 Grafana 仪表板中查看
设置 Grafana 服务器,并按照此处所述配置 Log Analytics 数据源。 然后,将带有 Log Analytics 后端的 Grafana 仪表板导入 Grafana 实验室。
该仪表板具有类似于 Azure 工作簿的视觉对象。 可以添加面板,绘制图表并可视化 InsightsMetrics 表中的网络策略管理器指标。
为 Prometheus 服务器设置
一些用户可能选择使用 Prometheus 服务器而不是用于容器的 Azure Monitor 来收集指标。 仅需在抓取配置中添加两个作业即可收集网络策略管理器指标。
若要安装 Prometheus 服务器,请在群集上添加此 helm 存储库:
helm repo add stable https://kubernetes-charts.storage.googleapis.com
helm repo update
然后添加服务器
helm install prometheus stable/prometheus -n monitoring \
--set pushgateway.enabled=false,alertmanager.enabled=false, \
--set-file extraScrapeConfigs=prometheus-server-scrape-config.yaml
其中,prometheus-server-scrape-config.yaml 包括:
- job_name: "azure-npm-node-metrics"
  metrics_path: /node-metrics
  kubernetes_sd_configs:
  - role: node
  relabel_configs:
  - source_labels: [__address__]
    action: replace
    regex: ([^:]+)(?::\d+)?
    replacement: "$1:10091"
    target_label: __address__
- job_name: "azure-npm-cluster-metrics"
  metrics_path: /cluster-metrics
  kubernetes_sd_configs:
  - role: service
  relabel_configs:
  - source_labels: [__meta_kubernetes_namespace]
    regex: kube-system
    action: keep
  - source_labels: [__meta_kubernetes_service_name]
    regex: npm-metrics-cluster-service
    action: keep
# Comment from here to the end to collect advanced metrics: number of entries for each IPSet
  metric_relabel_configs:
  - source_labels: [__name__]
    regex: npm_ipset_counts
    action: drop
也可以将 azure-npm-node-metrics 作业替换为以下内容,或将其合并到 Kubernetes Pod 的预先存在的作业中:
- job_name: "azure-npm-node-metrics-from-pod-config"
  metrics_path: /node-metrics
  kubernetes_sd_configs:
  - role: pod
  relabel_configs:
  - source_labels: [__meta_kubernetes_namespace]
    regex: kube-system
    action: keep
  - source_labels: [__meta_kubernetes_pod_annotationpresent_azure_Network Policy Manager_scrapeable]
    action: keep
  - source_labels: [__address__]
    action: replace
    regex: ([^:]+)(?::\d+)?
    replacement: "$1:10091"
    target_label: __address__
为 AlertManager 设置警报
如果使用 Prometheus 服务器,则可以像这样设置 AlertManager。 下面是上述两个警报规则的示例配置:
groups:
- name: npm.rules
  rules:
  # fire when Network Policy Manager has a new failure with an OS call or when translating a Network Policy (suppose there's a scraping interval of 5m)
  - alert: AzureNetwork Policy ManagerFailureCreatePolicy
    # this expression says to grab the current count minus the count 5 minutes ago, or grab the current count if there was no data 5 minutes ago
    expr: (npm_add_policy_exec_time_count{had_error='true'} - (npm_add_policy_exec_time_count{had_error='true'} offset 5m)) or npm_add_policy_exec_time_count{had_error='true'}
    labels:
      severity: warning
      addon: azure-npm
    annotations:
      summary: "Azure Network Policy Manager failed to handle a policy create event"
      description: "Current failure count since Network Policy Manager started: {{ $value }}"
  # fire when the median time to apply changes for a pod create event is more than 100 milliseconds.
  - alert: AzurenpmHighControllerPodCreateTimeMedian
    expr: topk(1, npm_controller_pod_exec_time{operation="create",quantile="0.5",had_error="false"}) > 100.0
    labels:
      severity: warning
      addon: azure-Network Policy Manager
    annotations:
      summary: "Azure Network Policy Manager controller pod create time median > 100.0 ms"
      # could have a simpler description like the one for the alert above,
      # but this description includes the number of pod creates that were handled in the past 10 minutes,
      # which is the retention period for observations when calculating quantiles for a Prometheus Summary metric
      description: "value: [{{ $value }}] and observation count: [{{ printf `(npm_controller_pod_exec_time_count{operation='create',pod='%s',had_error='false'} - (npm_controller_pod_exec_time_count{operation='create',pod='%s',had_error='false'} offset 10m)) or npm_controller_pod_exec_time_count{operation='create',pod='%s',had_error='false'}` $labels.pod $labels.pod $labels.pod | query | first | value }}] for pod: [{{ $labels.pod }}]"
Prometheus 的可视化选项
使用 Prometheus 服务器时,仅支持 Grafana 仪表板。
请设置 Grafana 服务器并配置 Prometheus 数据源(如果尚未这样做)。 然后,将带有 Prometheus 后端的 Grafana 仪表板导入 Grafana 实验室。
该仪表板的视觉对象与具有容器见解/Log Analytics 后端的仪表板相同。
示例仪表板
以下是容器见解 (CI) 和 Grafana 中网络策略管理器指标的一些示例仪表板。
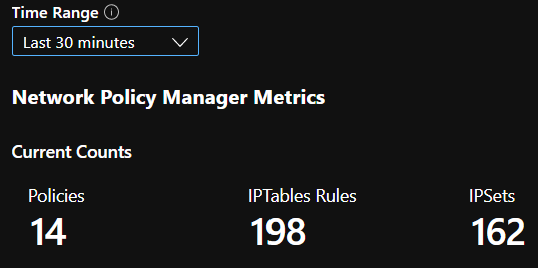
CI 汇总计数
一段时间内的 CI 计数

CI IPSet 条目数

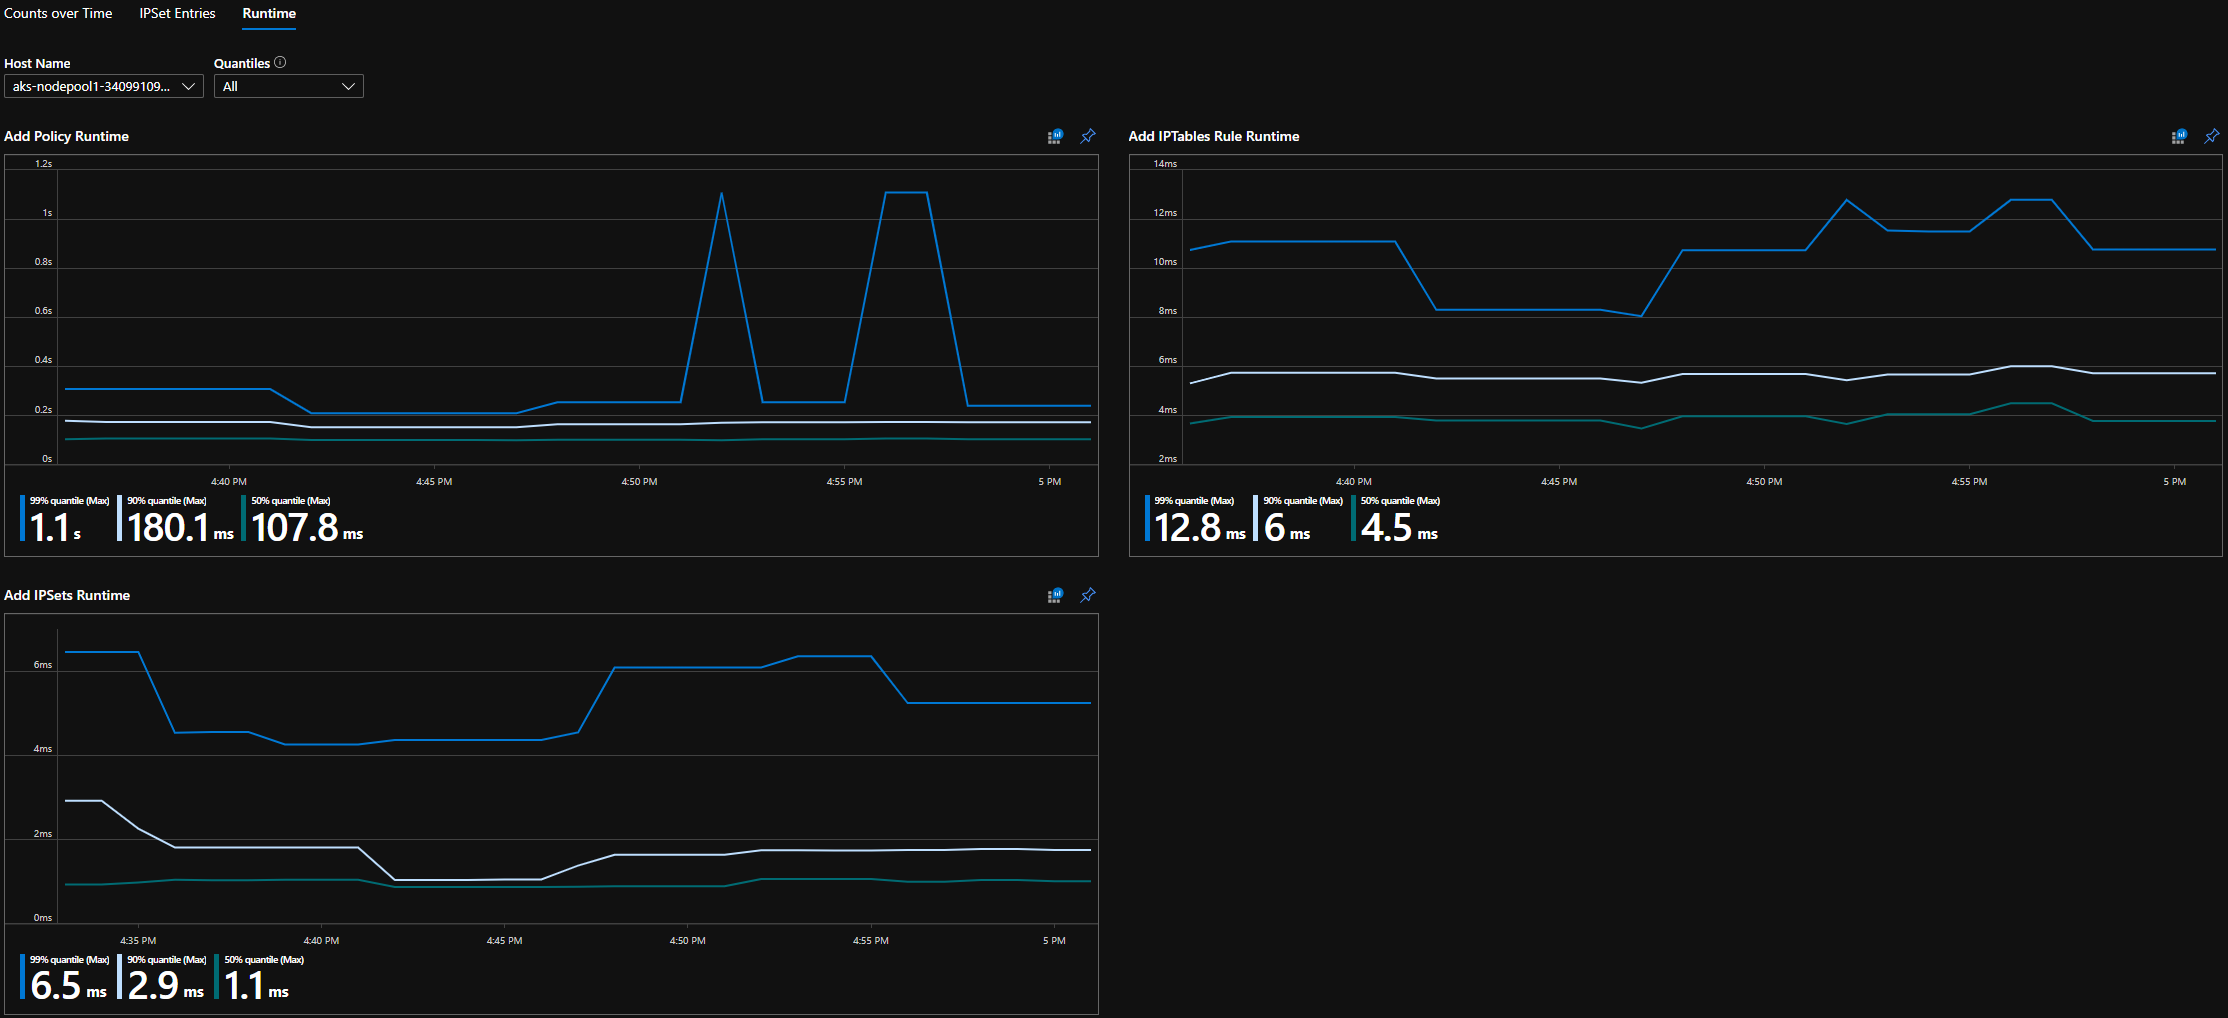
CI 运行时分位数
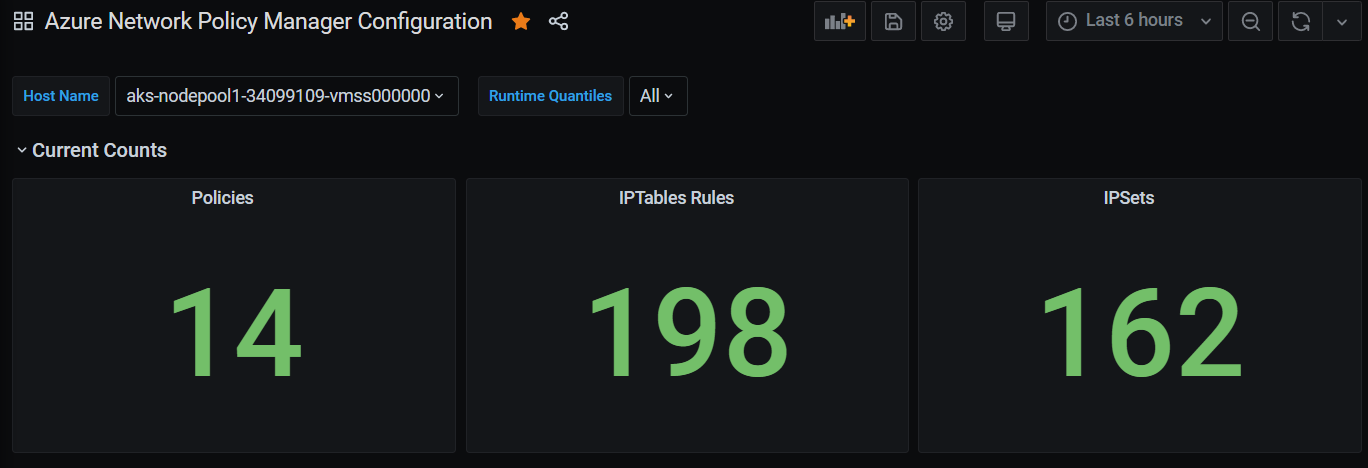
Grafana 仪表板汇总计数
一段时间内的 Grafana 仪表板计数

Grafana 仪表板 IPSet 条目数

Grafana 仪表板运行时分位数
