本文介绍如何使用 Azure Monitor OpenTelemetry Distro 在 Azure Monitor Application Insights 中启用和配置基于 OpenTelemetry 的数据收集。 OpenTelemetry 是 CNCF 的开源可观测性标准;Azure Monitor OpenTelemetry 发行版是 Microsoft 基于该标准推出并针对 Azure Monitor 优化的发行版。 分发版:
- 提供 OpenTelemetry 发行版,其中包括对 Azure Monitor 特定功能的支持。
- 通过包括 OpenTelemetry 检测库来收集跟踪、指标、日志和异常,启用 自动遥测 收集。
- 允许收集自定义遥测数据。
- 支持 实时指标 的功能,以监视和收集来自实时生产环境的 Web 应用程序的遥测数据。
有关使用 Azure Monitor OpenTelemetry 发行版的优点的详细信息,请参阅 为什么要使用 Azure Monitor OpenTelemetry 发行版。
若要详细了解如何使用 OpenTelemetry 收集数据,请查看 Application Insights 概述 或 OpenTelemetry 常见问题解答。
按照本文中的步骤安装发行版,将其连接到 Application Insights 资源,并验证遥测数据是否流向Azure Monitor。
OpenTelemetry 发布状态
OpenTelemetry 产品/服务适用于.NET、Node.js、Python和Java应用程序。 有关每项功能的发布状态,请参阅常见问题解答。
注意
有关 Azure 函数应用的信息,请参阅 在 Azure Functions 中使用 OpenTelemetry。
使用 Application Insights 启用 OpenTelemetry
按照本部分的步骤为您的应用程序集成 OpenTelemetry 工具。 选择一个用于特定语言说明的选项卡。
下表汇总了每个受支持的语言的包和安装命令:
| 语言 | Package | 安装命令 |
|---|---|---|
| ASP.NET Core | Azure.Monitor.OpenTelemetry.AspNetCore |
dotnet add package Azure.Monitor.OpenTelemetry.AspNetCore |
| .NET | Azure.Monitor.OpenTelemetry.Exporter |
dotnet add package Azure.Monitor.OpenTelemetry.Exporter |
| Java | applicationinsights-agent-3.7.8.jar |
|
| Node.js | @azure/monitor-opentelemetry |
npm install @azure/monitor-opentelemetry |
| Python | azure-monitor-opentelemetry |
pip install azure-monitor-opentelemetry |
注意
.NET涵盖多种方案,包括经典 ASP.NET、控制台应用、Windows 窗体(WinForms)等。
先决条件
- Azure订阅:创建试用Azure订阅
- Application Insights 资源:创建 Application Insights 资源
ASP.NET Core Application 使用正式支持的.NET
提示
如果要从较旧的 Application Insights SDK 迁移,请参阅 我们的迁移文档。
安装客户端库
安装最新的 Azure.Monitor.OpenTelemetry.AspNetCoreNuGet 包:
dotnet add package Azure.Monitor.OpenTelemetry.AspNetCore
修改你的应用程序
导入 Azure.Monitor.OpenTelemetry.AspNetCore 命名空间,添加 OpenTelemetry,并将其配置为在 program.cs 类中使用Azure Monitor:
// Import the Azure.Monitor.OpenTelemetry.AspNetCore namespace.
using Azure.Monitor.OpenTelemetry.AspNetCore;

var builder = WebApplication.CreateBuilder(args);

// Add OpenTelemetry and configure it to use Azure Monitor.
builder.Services.AddOpenTelemetry().UseAzureMonitor();

var app = builder.Build();

app.Run();
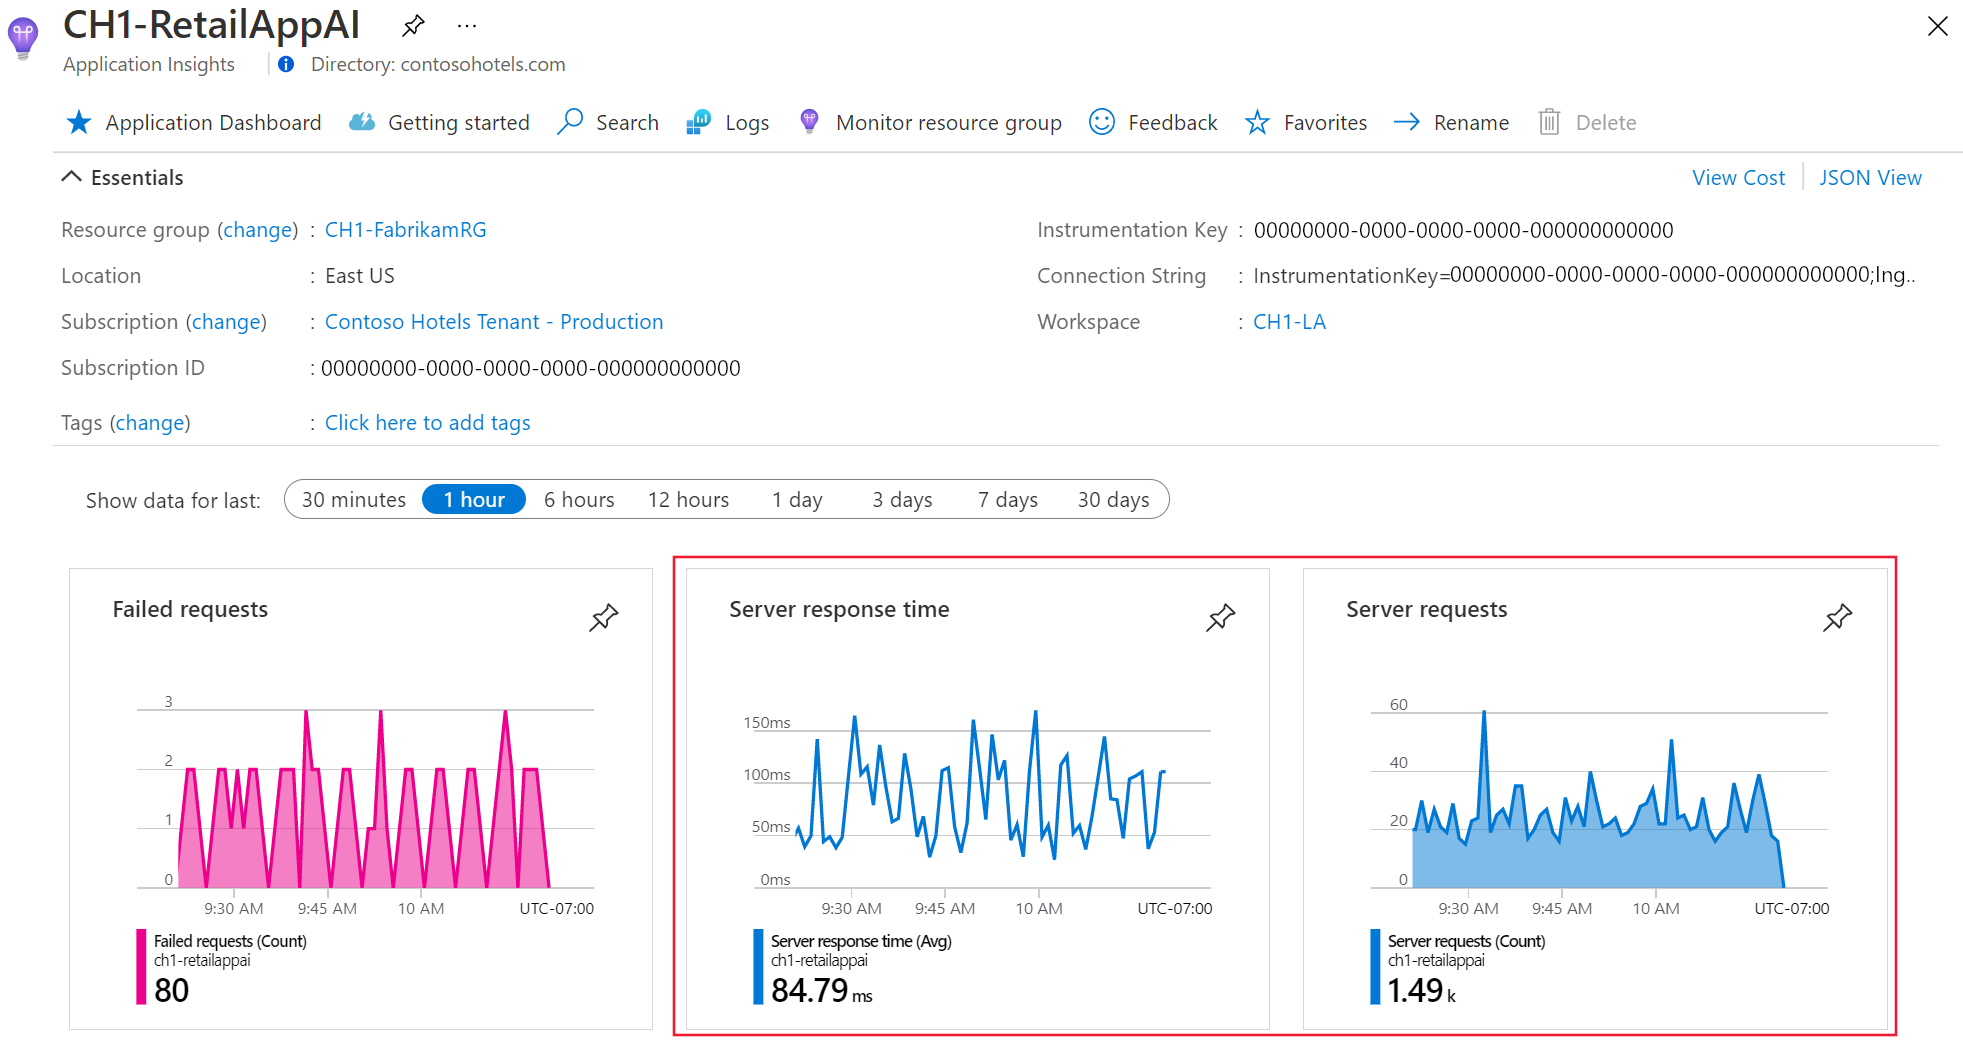
从 Application Insights 资源中复制 连接字符串
连接字符串是唯一的,并指定了 Azure Monitor OpenTelemetry 发行版将发送收集的遥测数据的位置。
复制连接字符串:
- 转到 Application Insights 资源的“概述”窗格。
- 查找“连接字符串”。
- 将鼠标悬停在连接字符串上,然后选择Copy 到剪贴板图标。

将连接字符串粘贴到您的环境中
若要粘贴连接字符串,请使用以下方法之一:
| 方法 | 支持的语言 | 建议用于 |
|---|---|---|
| 环境变量 | 全部 | 生产 |
配置文件 (applicationinsights.json) |
仅限 Java | 生产环境(Java) |
| Code | ASP.NET Core、Node.js、Python | 仅限本地开发/测试 |
重要
建议仅在本地开发和测试环境下通过代码设置连接字符串。
对于生产环境,请使用环境变量或配置文件(仅Java)。
将 Application Insights 连接字符串作为环境变量(建议用于生产)
将以下命令中的
<Your 连接字符串>替换为连接字符串。APPLICATIONINSIGHTS_CONNECTION_STRING=<Your connection string>在配置文件中设置 Application Insights 连接字符串 - 仅适用于 Java
创建包含以下内容的、名为
applicationinsights.json的配置文件,并将其置于applicationinsights-agent-3.7.8.jar所在的同一目录:{ "connectionString": "<Your connection string>" }将上述 JSON 中的
<Your 连接字符串>替换为 您的 唯一连接字符串。在代码中设置 Application Insights 连接字符串 - 仅适用于 ASP.NET Core、Node.js 和 Python
有关通过代码设置连接字符串的示例,请参阅 连接字符串 配置。
注意
如果在多个位置设置连接字符串,则会按以下优先顺序(最高到最低)进行解析:
- Code
- 环境变量
- 配置文件
确认有数据流
配置 Azure Monitor OpenTelemetry 发行版并设置连接字符串后,运行应用程序并在 Azure 门户中打开 Application Insights 资源,以验证是否显示跟踪、指标和日志。 数据可能在数分钟后才会显示。
现已为你的应用程序启用了 Application Insights。 以下步骤是可选的,并允许进一步自定义。
注意
作为使用 Application Insights 检测的一部分,我们将收集诊断数据并将其发送到Microsoft。 这些数据可帮助我们运行和改进 Application Insights。 在 Application Insights 常见问题解答中了解详细信息。
重要
如果有两个或更多服务向同一 Application Insights 资源发出遥测数据,则需要设置云角色名称以在应用程序映射中正确表示这些服务。
故障排除、反馈和支持
提示
以下部分适用于所有 OpenTelemetry 发行版文章。
故障排除
OpenTelemetry 反馈
若要提供反馈,请查看以下内容:
- 通过加入 OpenTelemetry 早期采用者社区来告诉Microsoft自己。
- 在 Microsoft Tech Community 中与其他Azure Monitor用户互动。
- 在 Azure 反馈论坛发出功能请求。
支持
选择所选语言的选项卡,以发现支持选项。
- 对于 Azure 支持问题,请打开 Azure 支持工单。
- 对于 OpenTelemetry 问题,请直接联系 OpenTelemetry .NET 社区。
- 有关与Azure Monitor导出程序相关的开放问题列表,请参阅 GitHub 问题页。
后续步骤
- 若要查看源代码,请参阅 Azure Monitor ASP.NET Core GitHub 存储库。
- 若要查看示例应用程序,请参阅 Azure Monitor OpenTelemetry for ASP.NET Core。
- 若要安装 NuGet 包、检查更新或查看发行说明,请参阅 Azure Monitor AspNetCore NuGet 包页。
- 若要了解有关 OpenTelemetry 及其社区的详细信息,请参阅 OpenTelemetry .NET GitHub 存储库。
- 要提高使用体验,请启用Web或浏览器用户监视。