预配与 Azure Monitor 日志和 Log Analytics 集成。 借助 Azure 监视,可以执行创建工作簿(也称为仪表板)、存储预配日志 30 天以及创建自定义查询和警报等操作。 本文讨论预配日志如何与 Azure Monitor 日志集成。 若要详细了解预配日志的一般工作原理,请参阅 预配日志。
启用预配日志集成
如果不熟悉 Azure Monitor 和 Log Analytics,请浏览以下资源,然后返回了解如何将应用程序预配日志与 Azure Monitor 日志集成。
将预配日志与 Azure Monitor 日志集成:
至少以安全管理员身份登录到 Microsoft Entra 管理中心。
浏览到 Entra ID>监视和运行状况>诊断设置。
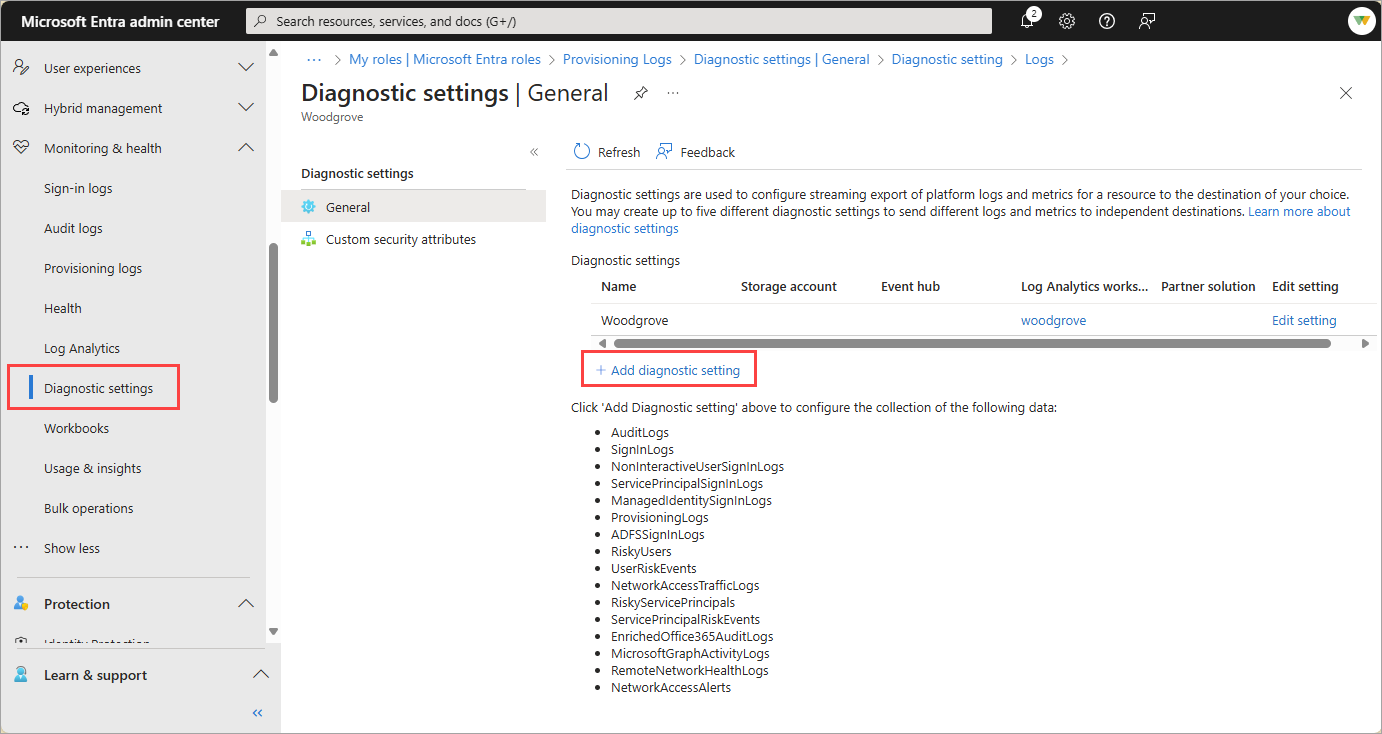
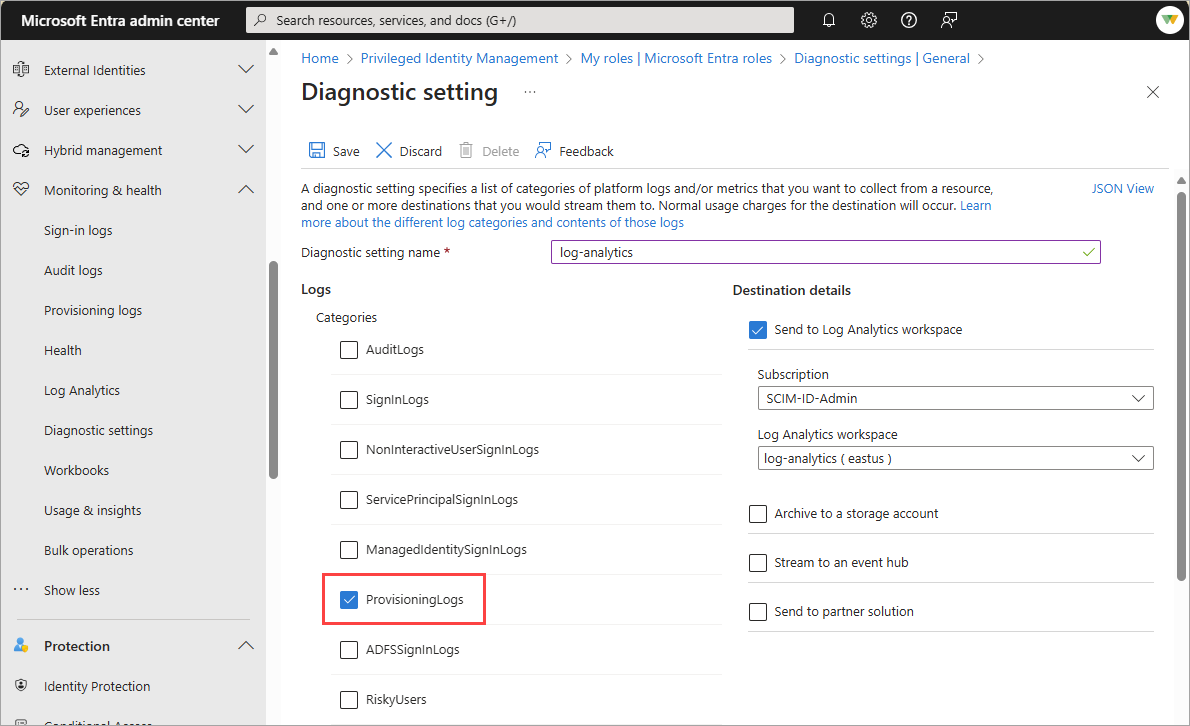
选择要流式传输的日志,选择“发送到 Log Analytics工作区”选项,然后填写字段。
浏览到 Entra ID>监控与健康状况>Log Analytics,并开始查询数据。


注释
首次启用集成后,日志可能需要一些时间才能显示在 Log Analytics 中。 如果收到订阅未注册以使用 microsoft.insights 的错误,请在几分钟后重新查看。
了解数据
预配发送日志查看器的基础数据流几乎完全相同。 Azure Monitor 日志的数据流与 Microsoft Entra 管理中心和 Microsoft Graph API 的流几乎相似。 下表中概述的日志字段存在一些差异。 Log Analytics 可能会显示比Microsoft Entra 管理中心中的日志更多的事件。 若要了解有关这些字段的详细信息,请参阅 List provisioningObjectSummary。
| Azure Monitor 日志 | Azure 门户用户界面 | Azure API |
|---|---|---|
| errorDescription | 原因 | resultDescription |
| 状态 | resultType | resultType |
| activityDateTime | TimeGenerated | TimeGenerated |
Microsoft Entra 工作簿
Microsoft Entra 标识工作簿提供灵活的画布用于数据分析。 他们还提供在 Azure 门户中创建丰富的视觉报表。 若要了解详细信息,请参阅 Microsoft Entra 工作簿。
预配分析和预配见解是可用的两个预生成的工作簿。 若要查看数据,请确保填充所有筛选器(timeRange、jobID、appName)。 此外,请确认已预配应用,否则日志中没有任何数据。


自定义查询
可以创建自定义查询并在工作簿中显示数据。 若要了解如何操作,请参阅 Azure Monitor 中的日志查询 和 Azure Monitor 中的日志查询入门。
下面是开始使用应用程序预配日志查询的一些示例。
根据用户的 ID 在源系统中查询日志:
AADProvisioningLogs
| extend SourceIdentity = parse_json(SourceIdentity)
| where tostring(SourceIdentity.Id) == "49a4974bb-5011-415d-b9b8-78caa7024f9a"
每个 ErrorCode 的汇总计数:
AADProvisioningLogs
| summarize count() by ErrorCode = ResultSignature
按操作汇总每天的事件计数:
AADProvisioningLogs
| where TimeGenerated > ago(7d)
| summarize count() by Action, bin(TimeGenerated, 1d)
获取 100 个事件并预测关键属性。
AADProvisioningLogs
| extend SourceIdentity = parse_json(SourceIdentity)
| extend TargetIdentity = parse_json(TargetIdentity)
| extend ServicePrincipal = parse_json(ServicePrincipal)
| where tostring(SourceIdentity.identityType) == "Group"
| project tostring(ServicePrincipal.Id), tostring(ServicePrincipal.Name), ModifiedProperties, JobId, Id, CycleId, ChangeId, Action, SourceIdentity.identityType, SourceIdentity.details, TargetIdentity.identityType, TargetIdentity.details, ProvisioningSteps
| take 100
由于解决引用问题,检索包含跳过成员的组。
AADProvisioningLogs
| where TimeGenerated >= ago(10d)
| where JobId == "Azure2Azure.73f0883f-d67d-4af1-ac8a-45367f8982e0.5ef3be57-f45f-451g-88c4-68a7fda680bb" // Customize by adding a specific app JobId
| extend SourceIdentity = parse_json(SourceIdentity)
| extend ProvisioningSteps = parse_json(ProvisioningSteps)
| where tostring(SourceIdentity.identityType) == "Group"
| where ProvisioningSteps matches regex "UnableToResolveReferenceAttributeValue"
| parse tostring(ProvisioningSteps.[2].description) with "We were unable to assign " userObjectId " as the members of " groupDisplayName "." *
| project groupDisplayName, userObjectId,  JobId
| take 100
按应用程序汇总操作。
AADProvisioningLogs
| where TimeGenerated > ago(30d)
| where JobId == "Azure2Azure.73f0883f-d67d-4af1-ac8a-45367f8982e0.5ef3be57-f45f-451g-88c4-68a7fda680bb" // Customize by adding a specific app JobId
| extend ProvisioningSteps = parse_json(ProvisioningSteps)
| extend eventName = tostring(ProvisioningSteps.[-1].name)
| summarize count() by eventName, JobId
| order by JobId asc
| take 5
确定特定操作中的峰值。
AADProvisioningLogs
| where TimeGenerated > ago(30d)
| where JobId == "scim.73f0883f-d67d-4af1-ac8a-45367f8982e0.5ef3be57-f45f-451g-88c4-68a7fda680bb" // Customize by adding a specific app JobId
| extend ProvisioningSteps = parse_json(ProvisioningSteps)
| extend eventName = tostring(ProvisioningSteps.[-1].name)
| summarize count() by eventName, bin(TimeGenerated, 1d)
| render timechart
自定义警报
通过 Azure Monitor,可以配置自定义警报,以便可以收到有关与预配相关的关键事件的通知。 例如,你可能想要收到有关故障、禁用或删除高峰的警报。 您可能还希望在出现任何预配不足的情况时收到警报,这表明存在问题。
有关警报的详细信息,请参阅 Azure Monitor 日志警报。 有许多选项和配置,因此请查看完整的文档。 但在高级别,下面介绍了如何创建警报:
- 在 Log Analytics 中,选择“ + 新建警报规则”。
- 在“ 条件 ”选项卡上,选择 “查看结果”并在“日志”链接中编辑查询 。
- 输入要对其发出警报的查询,并完成创建警报所需的字段。
要在故障次数激增时创建警报:
AADProvisioningLogs
| where JobId == "string" // Customize by adding a specific app JobId
| where ResultType == "Failure"
可能存在导致预配服务停止运行的问题。 使用以下查询检测在给定的时间间隔内是否没有配置事件。
AADProvisioningLogs
| take 1
若要在禁用或删除数量出现峰值时创建警报:
AADProvisioningLogs
| where Action in ("Disable", "Delete")
社区贡献
我们将采用基于开源和社区驱动的方法,处理应用程序配置查询和仪表板。 生成你认为对其他人有用的查询、警报或工作簿,然后将其发布到 AzureMonitorCommunity GitHub 存储库。 给我们发送一封包含链接的电子邮件。 我们审核并发布查询和仪表板到服务,以便其他人也能受益。 通过 provisioningfeedback@microsoft.com 联系我们。