Note
Access to this page requires authorization. You can try signing in or changing directories.
Access to this page requires authorization. You can try changing directories.
Use container network logs in Advanced Container Networking Services (ACNS) to investigate workload communication, dropped traffic, and DNS failures in Azure Kubernetes Service (AKS). This guide explains how to configure collection and verify that you can see logs for your workload.
Choose the mode that matches your investigation:
- Stored logs: Collect flows continuously in rotating files on each node. Forward the logs to Azure Monitor or your own logging backend when you need to retain and query them for historical investigations.
- On-demand logs: Inspect flows in real time with the Hubble CLI or UI. This mode doesn't require stored-log collection or Azure Monitor.
For details about the available flow data and aggregation behavior, see the container network logs overview.
Prerequisites
An Azure account with an active subscription. If you don't have one, create a Trial before you begin.
Use Bash in a local Bash terminal with Azure CLI and
kubectl. For a local installation, sign in withaz loginand select your subscription withaz account set --subscription "<subscription-id>".Azure CLI version 2.85.0 or later. Run
az --versionto check. To install or upgrade, see Install Azure CLI.Install the aks-preview extension if it isn't installed. If it's already installed, update it. This guide requires version 22.0.0b15 or later:
# Install the aks-preview extension
az extension add --name aks-preview

# Update the extension to make sure you have the latest version installed
az extension update --name aks-preview
Stored logs mode requires the Cilium data plane and permission to create and update cluster-scoped
ContainerNetworkLogresources.On-demand logs mode works with both Cilium and non-Cilium data planes.
Your cluster must be running Kubernetes version 1.36 or later.
Optional: DNS and Layer 7 visibility
Basic network flow collection doesn't require DNS or HTTP inspection. Configure the following only if your investigation needs protocol-specific details.
- HTTP: Enable Layer 7 policy support and apply a policy with HTTP rules that covers the traffic you want to inspect. To learn more, see the Layer 7 policy guide, see Configure a Layer 7 policy.
- DNS flows and metrics are captured only when a Cilium FQDN network policy is applied. For more information, see Configure an FQDN policy.
Collection filters select which flows to log; they don’t enable protocol inspection. Network policies can affect application connectivity, so apply policies appropriate to your workload.
Configure stored logs mode
Stored logs mode continuously collects selected network flows on your cluster's nodes. To start collection:
- Enable ACNS on a supported cluster with the Cilium data plane.
- Apply a
ContainerNetworkLogcustom resource to select the traffic you want to capture.
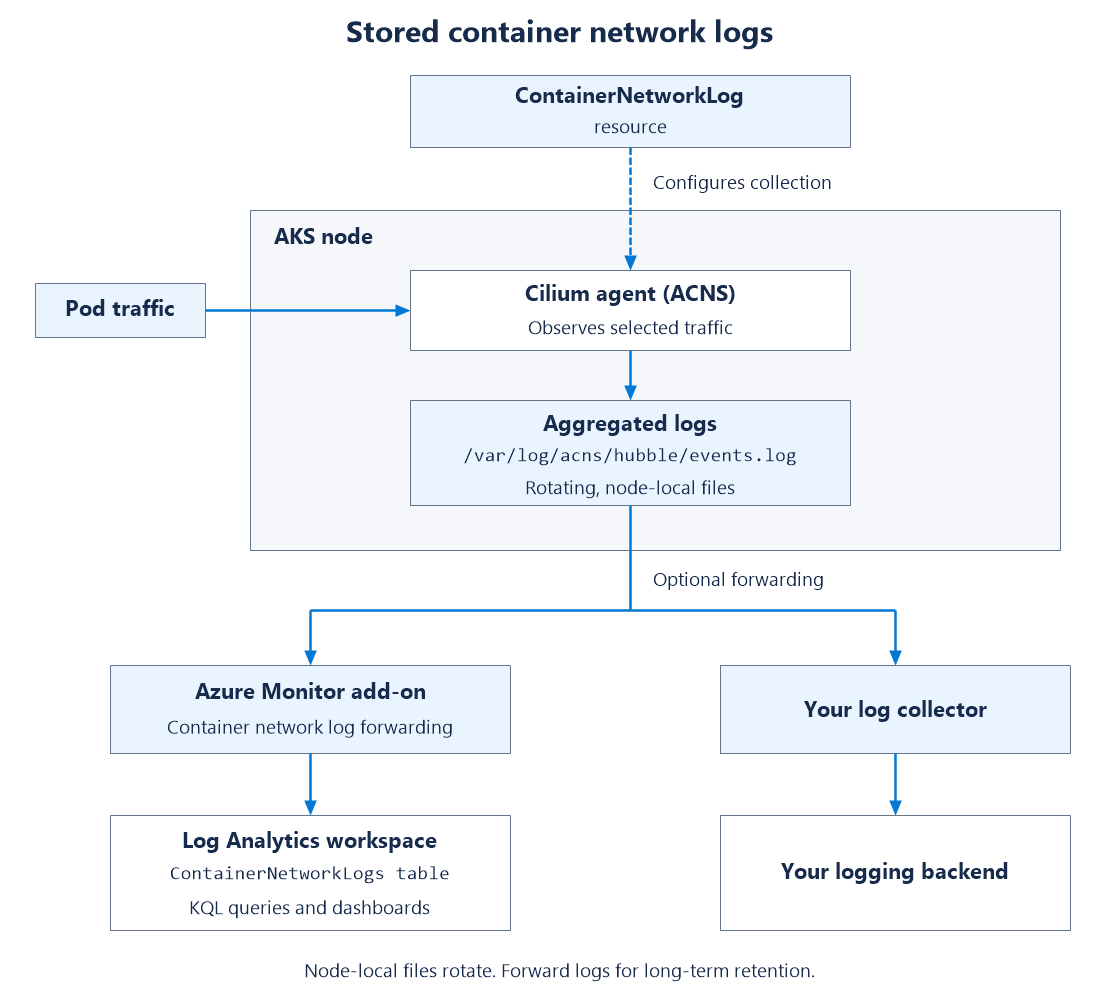
After the configuration takes effect, ACNS writes matching flow observations to /var/log/acns/hubble/events.log on the nodes that observe the traffic. By default, flow log aggregation combines observations with matching grouping-field values into summarized records every 30 seconds.
Choose how to access the logs:
- Azure Monitor: Configure the monitoring add-on and enable container network log forwarding to send logs to a Log Analytics workspace for retention, KQL queries, and dashboards.
- Your own logging backend: Configure a collector to forward the node-local files to your existing backend.
- Node-local files: Inspect the files directly for short-term investigations. Files rotate, so this option doesn't provide long-term retention.
The following steps cover new and existing clusters. Start with the default aggregation settings, verify collection, and then customize grouping fields if your investigation requires additional detail.
How stored logs flow end-to-end
Deployment options
Enable ACNS and apply a ContainerNetworkLog resource regardless of your deployment method. The Azure CLI walkthrough below covers the full setup. The ARM and Bicep guides cover the optional Azure Monitor integration.
Follow the end-to-end setup below to enable ACNS, select traffic for collection, and optionally configure forwarding to Azure Monitor. Choose the new-cluster or existing-cluster instructions as appropriate.
End-to-end setup
Follow these steps in order. Steps 1 and 2 are required. Step 3 is optional and only needed if you want logs forwarded to Azure Monitor.
| Step | What you do | Required? |
|---|---|---|
| 1 | Make sure your cluster has ACNS enabled (new or existing) | Yes |
| 2 | Create a ContainerNetworkLog resource to select traffic |
Yes |
| 3 | Forward logs to Azure Monitor for persistent storage | Optional |
Set your environment variables once and reuse them throughout:
# Replace placeholders with your own values
export CLUSTER_NAME="<aks-cluster-name>"
export RESOURCE_GROUP="<aks-resource-group>"
export LOCATION="<location>"
Step 1: Make sure ACNS is enabled on your cluster
Use the option that matches your situation.
Option A: Create a new cluster with ACNS
# Create the resource group if it doesn't already exist
az group create --name $RESOURCE_GROUP --location $LOCATION

# Create an AKS cluster with ACNS
az aks create \
  --resource-group $RESOURCE_GROUP \
  --name $CLUSTER_NAME \
  --location $LOCATION \
  --pod-cidr 192.168.0.0/16 \
  --network-plugin azure \
  --network-plugin-mode overlay \
  --network-dataplane cilium \
  --generate-ssh-keys \
  --enable-acns
Tip
If the default VM size isn't available in your subscription, add --node-vm-size Standard_D4ads_v5.
If you already know you want logs forwarded to Azure Monitor, you can do everything in one command. See Shortcut: Create a cluster with Log Analytics from the start.
Get your cluster credentials so you can run kubectl commands:
az aks get-credentials --name $CLUSTER_NAME --resource-group $RESOURCE_GROUP
Option B: Use an existing cluster
If ACNS isn't already enabled on your Cilium cluster, enable it:
az aks update --name $CLUSTER_NAME --resource-group $RESOURCE_GROUP --enable-acns
Get your cluster credentials and confirm that the current context is the intended cluster:
az aks get-credentials --name $CLUSTER_NAME --resource-group $RESOURCE_GROUP
kubectl config current-context
Step 2: Create a ContainerNetworkLog resource to start log collection
Stored logs mode doesn't collect anything until you create at least one
ContainerNetworkLog custom resource. This resource specifies which traffic to
capture by namespace, pod, labels, IP address, Cilium security identity, protocol,
or verdict.
Customize the ContainerNetworkLog template for your application, save it as a YAML file, and apply it:
kubectl apply -f "<your-log-configuration.yaml>"
Use a unique resource name to avoid overwriting an existing configuration.
When the configuration reaches the agents, they write matching flows to
/var/log/acns/hubble/events.log on the nodes that observe that traffic.
Tip
For a practical example, see the sample resource in the AKS Labs documentation.
Note
Logs on host nodes are temporary. Files auto-rotate at 50 MB, and older entries are overwritten. For persistent storage, complete Step 3. You can also forward logs to a SIEM or observability backend using any OpenTelemetry-compatible collector or logging service, instead of or alongside Azure Monitor.
You can use the default aggregation settings or customize flow log aggregation with additional fields.
Step 3 (optional): Forward logs to Azure Monitor for persistent storage
Complete this step if you want logs forwarded to a Log Analytics workspace for long-term retention, KQL queries, and the built-in Azure portal and Grafana dashboards. Skip it if you plan to consume host-local logs directly or forward them through your own OpenTelemetry collector or logging service.
3a. Enable the Azure Monitor add-on (Log Analytics):
# Choose one option: default or existing Log Analytics workspace
# Default workspace
az aks enable-addons -a monitoring -g $RESOURCE_GROUP -n $CLUSTER_NAME

# To use an existing Log Analytics workspace
az aks enable-addons -a monitoring -g $RESOURCE_GROUP -n $CLUSTER_NAME --workspace-resource-id "<workspace-resource-id>"
3b. Enable the container network logs flag:
az aks update --enable-acns \
  --enable-container-network-logs \
  -g $RESOURCE_GROUP \
  -n $CLUSTER_NAME
Use the Log Analytics workspace selected when enabling the monitoring add-on. The Azure Monitor workspace used for managed Prometheus metrics is a different resource.
Note
Configure forwarding before generating the traffic you want to verify. Don't rely on enabling forwarding to backfill historical host-local logs.
Shortcut: Create a cluster with Log Analytics from the start
If you're creating a new cluster and already know you want logs sent to a Log Analytics workspace, you can combine Step 1 and Step 3 into a single create command:
az aks create \
  --resource-group $RESOURCE_GROUP \
  --name $CLUSTER_NAME \
  --location $LOCATION \
  --pod-cidr 192.168.0.0/16 \
  --network-plugin azure \
  --network-plugin-mode overlay \
  --network-dataplane cilium \
  --generate-ssh-keys \
  --enable-acns \
  --enable-addons monitoring \
  --enable-container-network-logs
To use an existing Log Analytics workspace, add --workspace-resource-id "<log-analytics-workspace-resource-id>" to the create command.
You still need to complete Step 2 (create a ContainerNetworkLog resource) to define which traffic to capture. Log Analytics integration is already in place, so matched flows are collected and sent to your workspace automatically.
ContainerNetworkLog CRD template
The ContainerNetworkLog custom resource defines which network flows to capture
and lets you customize flow log aggregation with additional grouping fields.
You can create multiple resources, each targeting different traffic.
The following template shows traffic selectors and optional aggregation in one
resource. Replace the sample values and include only the selectors and
additional fields needed for your application.
apiVersion: acn.azure.com/v1alpha1
kind: ContainerNetworkLog
metadata:
  name: sample-containernetworklog # Cluster scoped
spec:
  includefilters: # At least one filter is required
    - name: sample-filter
      from:
        namespacedPod: # Format: namespace/pod
          - sample-namespace/sample-pod
        labelSelector:
          matchExpressions:
            - key: environment
              operator: In
              values:
                - production
                - staging
        ip: # Single IP or CIDR
          - "192.168.1.10"
          - "10.0.0.1"
      to:
        namespacedPod:
          - sample-namespace2/sample-pod2
        labelSelector:
          matchLabels:
            app: backend
        ip:
          - "192.168.1.20"
          - "10.0.1.1"
      protocol: # tcp, udp, dns
        - tcp
        - udp
        - dns
      verdict: # forwarded, dropped
        - forwarded
        - dropped
  aggregation: # Optional; omit to use service-managed grouping fields
    additionalFields:
      - traffic_direction # Example; choose supported Flow fields for your needs
Save the template as a YAML file and replace the example values before applying it.
Within a filter, the specified endpoint, protocol, and verdict criteria must match.
The template uses one label condition per endpoint; the namespace restriction
comes from namespacedPod. Remove criteria you don't need rather than copying
unrelated pod names, labels, and IP addresses together. Separate filter entries
are OR alternatives. For smaller configurations, use the
aggregation customization examples.
Important
Multiple conditions within a labelSelector can match as alternatives rather
than requiring every condition to match. To avoid collecting more traffic than
intended, use one matchLabels entry or one matchExpressions condition per
endpoint. Combine it with namespace or pod, IP, protocol, or verdict criteria
instead of adding more label conditions.
The optional aggregation block lets you customize flow log aggregation.
traffic_direction is just an example, not a required field or the only choice.
You can choose any valid field path from the Hubble Flow message in Cilium's
flow.proto definition
that is supported by the Cilium version running on your cluster.
When choosing additional fields:
- Use supported, case-sensitive paths. The linked
mainbranch can contain fields that your cluster's version doesn't yet support. - The original flow must contain the data. Adding a field doesn't enable DNS or HTTP inspection. When querying forwarded logs, use the existing Log Analytics table columns and dynamic properties; adding a field doesn't create a new table column.
- Changes apply cluster-wide. Additional fields affect all selected stored logs, including traffic selected by other resources. They extend the service defaults without removing them or changing the 30-second aggregation interval. Changes affect new records, not historical logs.
- Assess volume and cost. You can use high-cardinality fields when you need finer detail, but their many distinct values can increase log volume and ingestion and storage costs. Review sensitive-data implications as well.
Omit aggregation to use the service defaults without requesting additional
fields from this resource. See Customize flow log aggregation
for examples.
CRD field reference
| Field | Type | Description | Required |
|---|---|---|---|
spec.includefilters |
[]filter | Filters that define which network flows to capture. Must contain at least one filter. | Yes |
includefilters[].name |
String | Name of the log filter. | Yes |
includefilters[].protocol |
[]string | Protocols to match: tcp, udp, dns. If omitted, no protocol restriction is added. |
No |
includefilters[].verdict |
[]string | Flow verdict to match: forwarded, dropped. If omitted, no verdict restriction is added. |
No |
includefilters[].from |
Endpoint | Source of the flow. Can include IPs, labels, namespace/pod selectors, and numeric identities. | No |
includefilters[].to |
Endpoint | Destination of the network flow. Same options as from. |
No |
Endpoint.ip |
[]string | Single IP address or CIDR range. | No |
Endpoint.labelSelector |
Object | Label-based endpoint selection. Use one matchLabels entry or one matchExpressions condition per endpoint; see the multiple-condition limitation above. |
No |
Endpoint.namespacedPod |
[]string | Exact namespace and pod-name prefix in namespace/pod format. Use namespace/ for all pods in that namespace. |
No |
Endpoint.identities |
[]integer | Numeric Cilium security identities from 0 through 16777215. Values are alternatives. |
No |
spec.aggregation.additionalFields |
[]string | Additional, case-sensitive flow field paths to customize cluster-wide aggregation grouping. Requires include filters; doesn't replace service defaults. | No |
Omitting protocol or verdict criteria doesn't enable missing protocol visibility. Each filter must contain traffic-selection criteria, not just a name.
Capture Layer 7 and DNS flows
Layer 7 and DNS fields require visibility configuration in addition to log
collection. A ContainerNetworkLog resource selects traffic to log; it doesn't
enable inspection or change network policy.
- For DNS, follow Configure FQDN filtering policies.
- For HTTP and other Layer 7 scenarios, follow Configure Layer 7 policies.
Network policies can affect application access. Apply policies appropriate to your workload, then customize aggregation for the details you need using the examples below.
Verify the setup
These steps apply to both new and existing cluster setups.
Get cluster credentials
az aks get-credentials --name $CLUSTER_NAME --resource-group $RESOURCE_GROUP
Confirm that container network logs are enabled
az aks show -g $RESOURCE_GROUP -n $CLUSTER_NAME
Check that networkProfile.advancedNetworking.enabled and
networkProfile.advancedNetworking.observability.enabled are true.
If you use Azure Monitor, also check the monitoring add-on configuration.
Confirm actual ingestion with the query below.
Check custom resource status
List all ContainerNetworkLog resources in the cluster:
kubectl get containernetworklog
It will give you the name of the containernetworklog resource you just created. Use that name in the command below to check its status:
Check the status of a specific resource:
kubectl describe containernetworklog "<cr-name>"
The Status > State field should show CONFIGURED. If it shows FAILED, read status.reason and correct the configuration. Review status.warnings when you configure additional grouping fields. Allow time for configuration propagation before generating traffic; this status alone doesn't verify ingestion.
Spec:
  Includefilters:
    From:
      Namespaced Pod:
        namespace/pod-
    Name:  sample-filter
    Protocol:
      tcp
    To:
      Namespaced Pod:
        namespace/pod-
    Verdict:
      dropped
Status:
  State:      CONFIGURED
  Timestamp:  2025-05-01T11:24:48Z
You can apply multiple ContainerNetworkLog custom resources. Each one has its own status.
Generate test traffic
From a running application pod selected by your filters, make a request to an
HTTP or HTTPS endpoint you expect to reach. Replace the values in the following command. The pod
must have curl; for multiple containers, add -c <container-name> to kubectl exec.
NAMESPACE="<application-namespace>"
CLIENT_POD="<running-pod-with-curl>"
TEST_URL="https://<approved-host>/"
date -u '+Test start (UTC): %Y-%m-%dT%H:%M:%SZ'
kubectl exec -n "$NAMESPACE" "$CLIENT_POD" -- \
  curl --fail --show-error --silent --output /dev/null \
    --write-out 'HTTP %{http_code}\n' \
    --connect-timeout 10 --max-time 20 "$TEST_URL"
Use a URL your application can reach. A successful response confirms the request worked. Next, check that its network logs appear in your logging backend.
Query logs in Log Analytics
Confirm that the test traffic reached the ContainerNetworkLogs table before
opening the dashboards. Get the cluster resource ID:
az aks show -g "$RESOURCE_GROUP" -n "$CLUSTER_NAME" --query id -o tsv
Open Logs in the receiving Log Analytics workspace. Replace the cluster ID and namespace in the following query with your values:
ContainerNetworkLogs
| where TimeGenerated > ago(15m)
| where _ResourceId =~ "<AKS-resource-ID>"
| where SourceNamespace == "<namespace>"
| project TimeGenerated, SourceNamespace, SourceWorkloads,
          DestinationNamespace, DestinationWorkloads, Verdict, Layer4
| order by TimeGenerated desc
Allow for aggregation and ingestion delay, and then look for records after the test
start time with your source workload and destination port. Widen ago(15m)
if the test was earlier. Counts represent aggregated observations, not unique
requests. Namespace and workload metadata are retained by default; pod names aren't.
If you use your own log collector instead of Azure Monitor, confirm that it
forwards new records from /var/log/acns/hubble/events.log to your logging backend.
For more sample queries, see Progressive diagnosis using flow logs.
Visualize with Grafana dashboards
You can access prebuilt Grafana dashboards through the Azure portal without creating an Azure Managed Grafana instance. The portal dashboard experience is free; ACNS and log ingestion and retention charges still apply. Before you start, ensure the Azure Monitor log pods are running:
kubectl get pods -o wide -n kube-system | grep ama-logs
Expected output:
ama-logs-9bxc6                                   3/3     Running   1 (39m ago)   44m
ama-logs-fd568                                   3/3     Running   1 (40m ago)   44m
ama-logs-rs-65bdd98f75-hqnd2                     2/2     Running   1 (43m ago)   22h
Optional: Grant a separate Grafana instance access
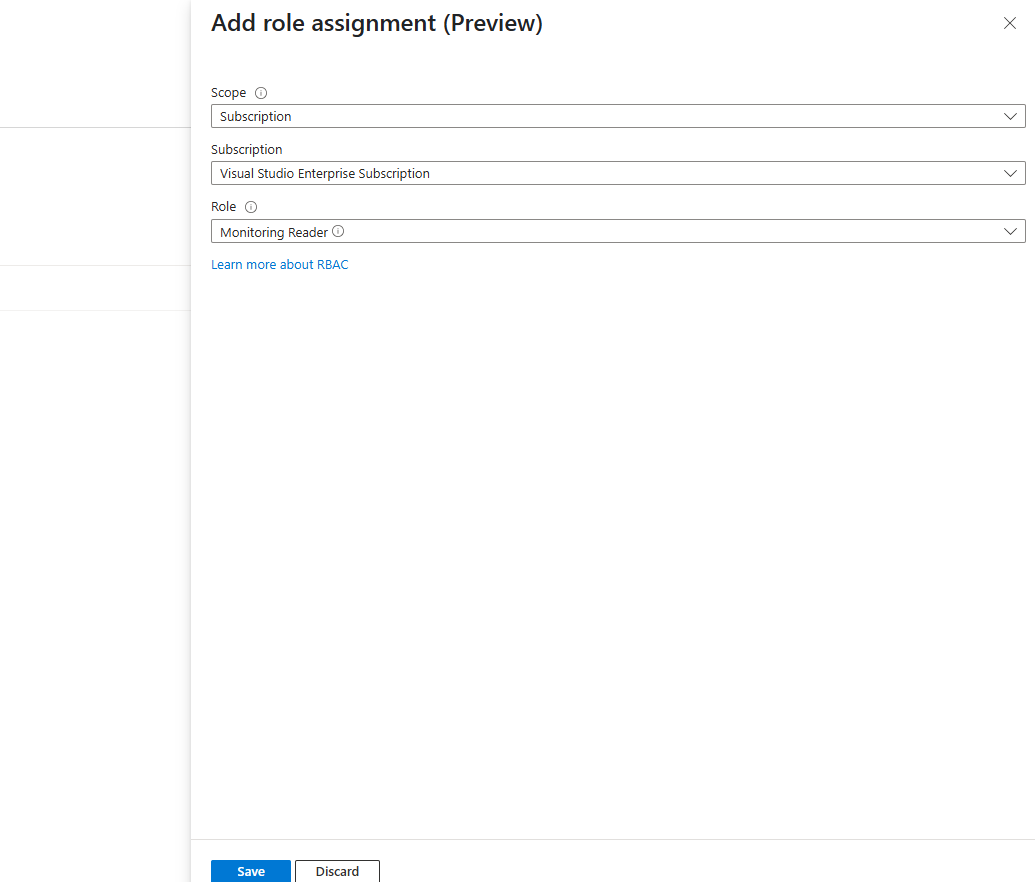
Skip this section when using the built-in Azure portal dashboards. If you use a separate Managed Grafana workspace, have an administrator grant access to the log data at the scope required by your monitoring setup. The following steps show a subscription-scoped Monitoring Reader assignment.
If you're a subscription Owner or User Access Administrator, the Managed Grafana workspace gets this role automatically when it's created.
If not (or if your Log Analytics and Grafana workspaces are in different subscriptions), grant the role manually:
In your Managed Grafana workspace, go to Settings > Identity.
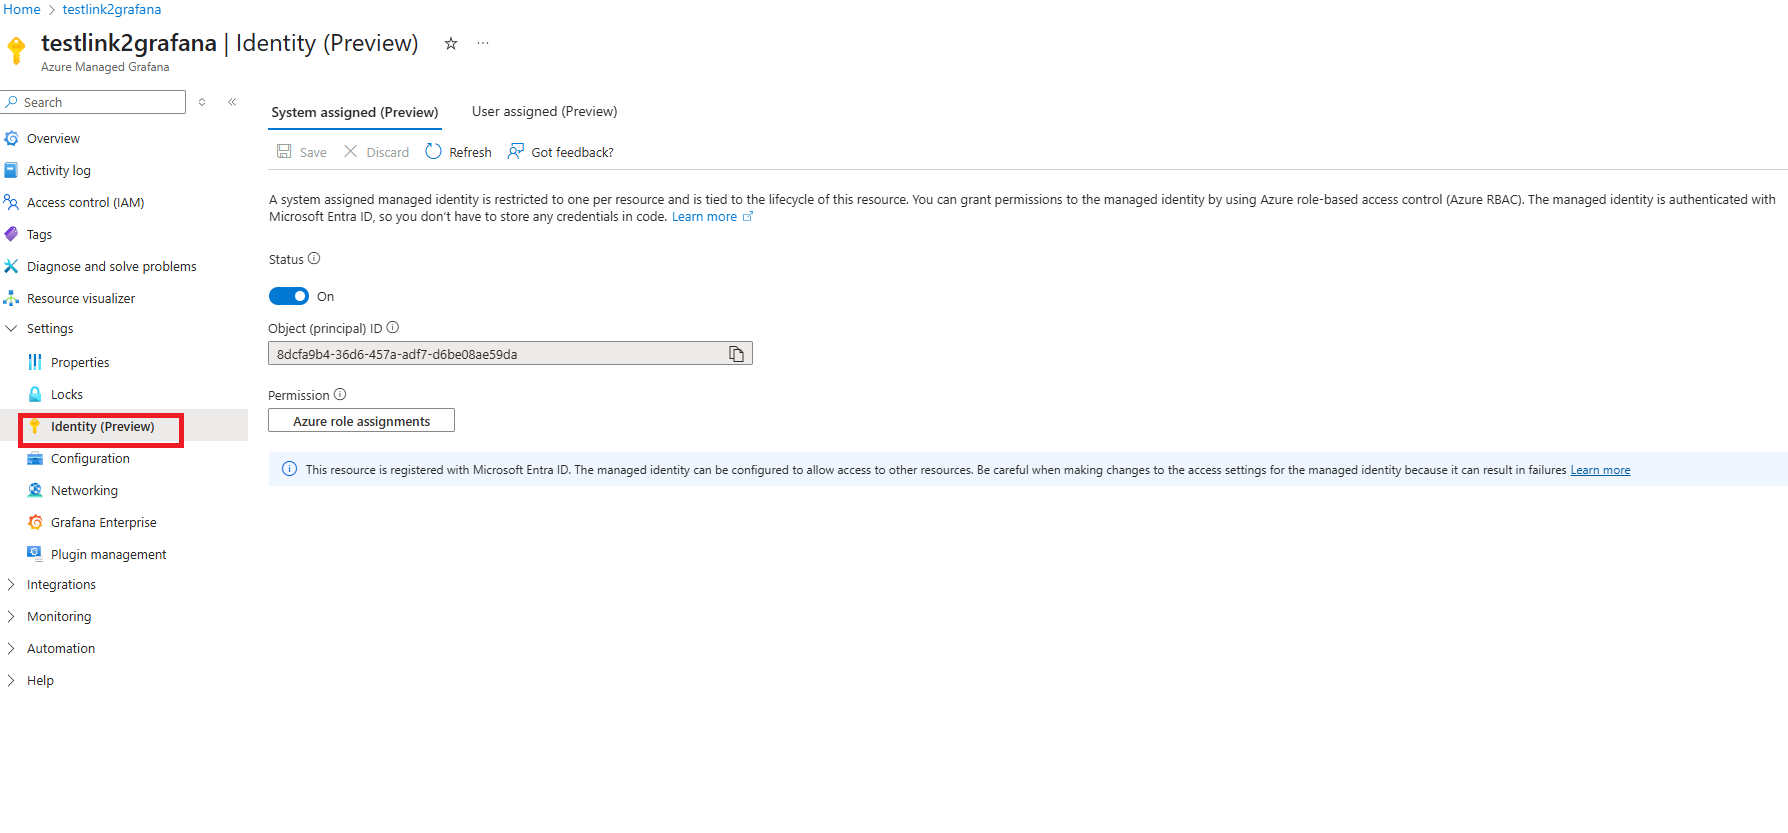
Select Azure role assignments > Add role assignments.
Set Scope to Subscription, select your subscription, set Role to Monitoring Reader, and select Save.
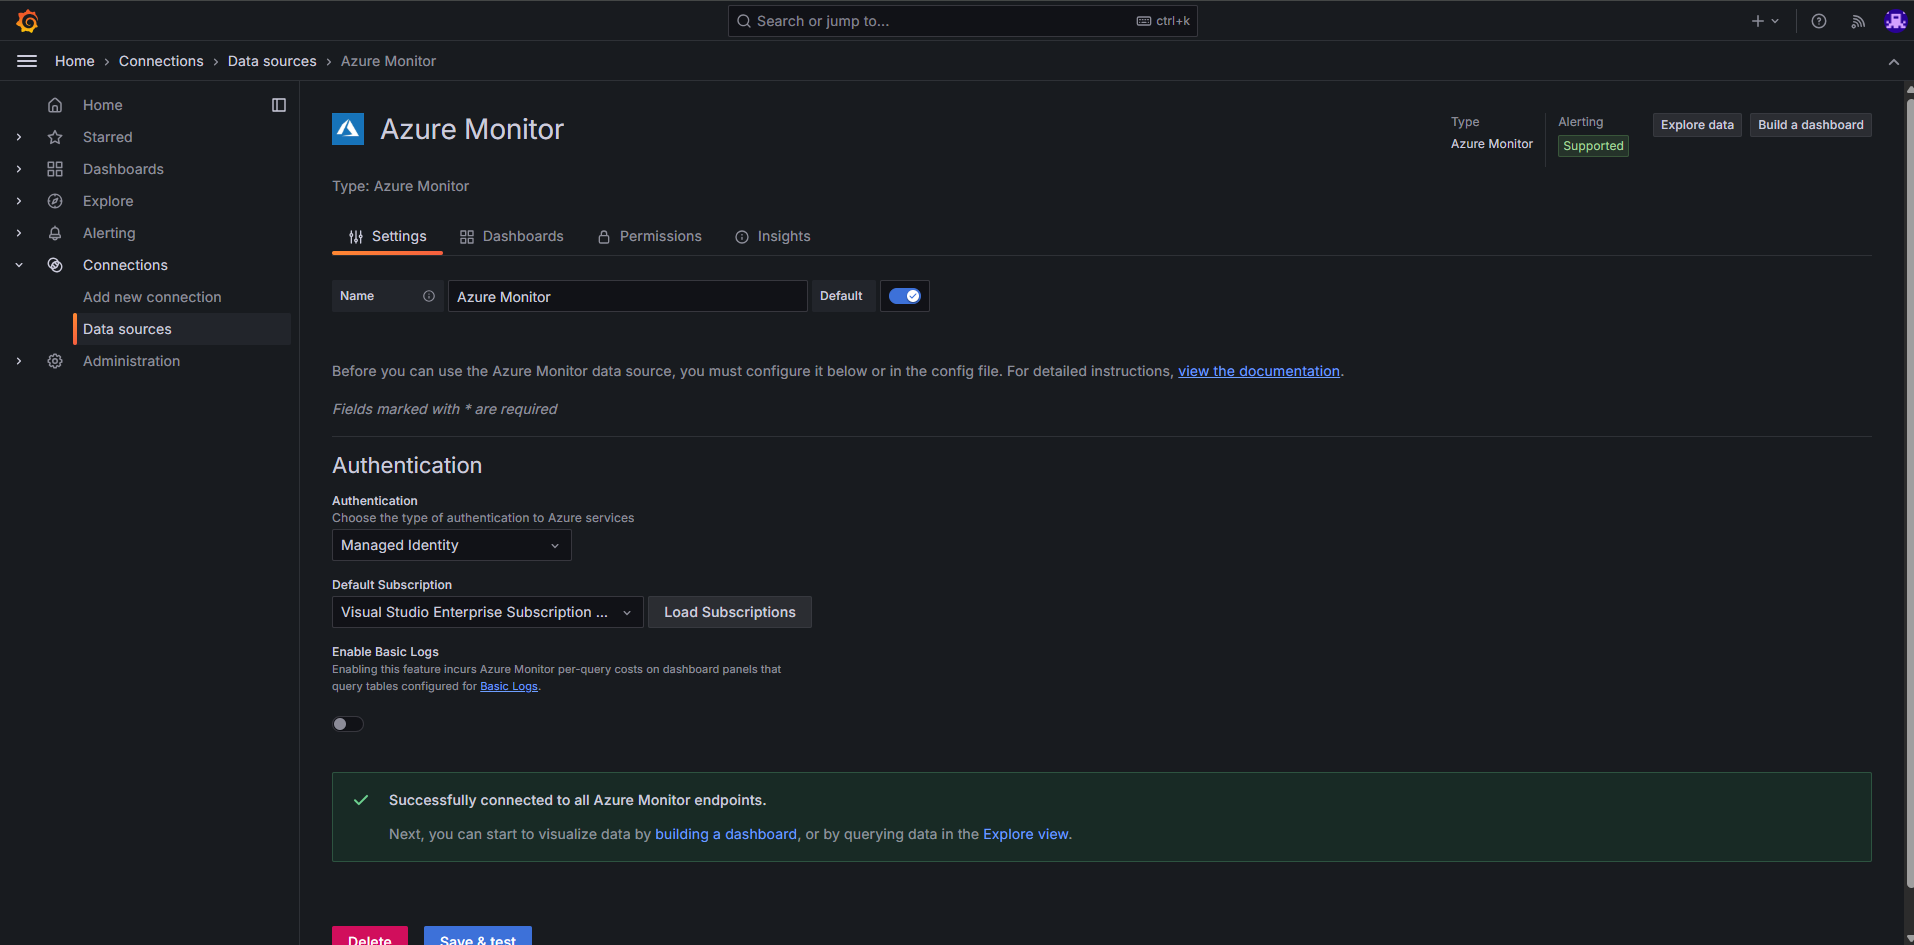
Verify the data source in the Data source tab of your Managed Grafana instance:
Access the dashboards
To open the dashboards from the Azure portal:
- Go to your AKS cluster in the Azure portal.
- Under Monitoring, select Dashboards with Grafana.
- Browse the networking flow-log dashboards under Azure Monitor.
Look for the dashboards under Azure Monitor > Insights > Containers > Networking. There are two options depending on the tier you chose for your ContainerNetworkLogs table in Log Analytics:
| Dashboard | Path | Table tier | Grafana ID |
|---|---|---|---|
| Flow Logs - Basic Tier | Azure > Insights > Containers > Networking > Flow Logs - Basic Tier | Basic | 23155 |
| Flow Logs - Analytics Tier | Azure > Insights > Containers > Networking > Flow Logs - Analytics Tier | Analytics (default) | 23156 |
Both dashboards show workload communication and forwarded or dropped observations. Available details depend on protocol visibility and aggregation fields. Grafana IDs are for a separate Grafana deployment; you don't need them for the portal dashboards. Use the one that matches the tier configured for your ContainerNetworkLogs table.
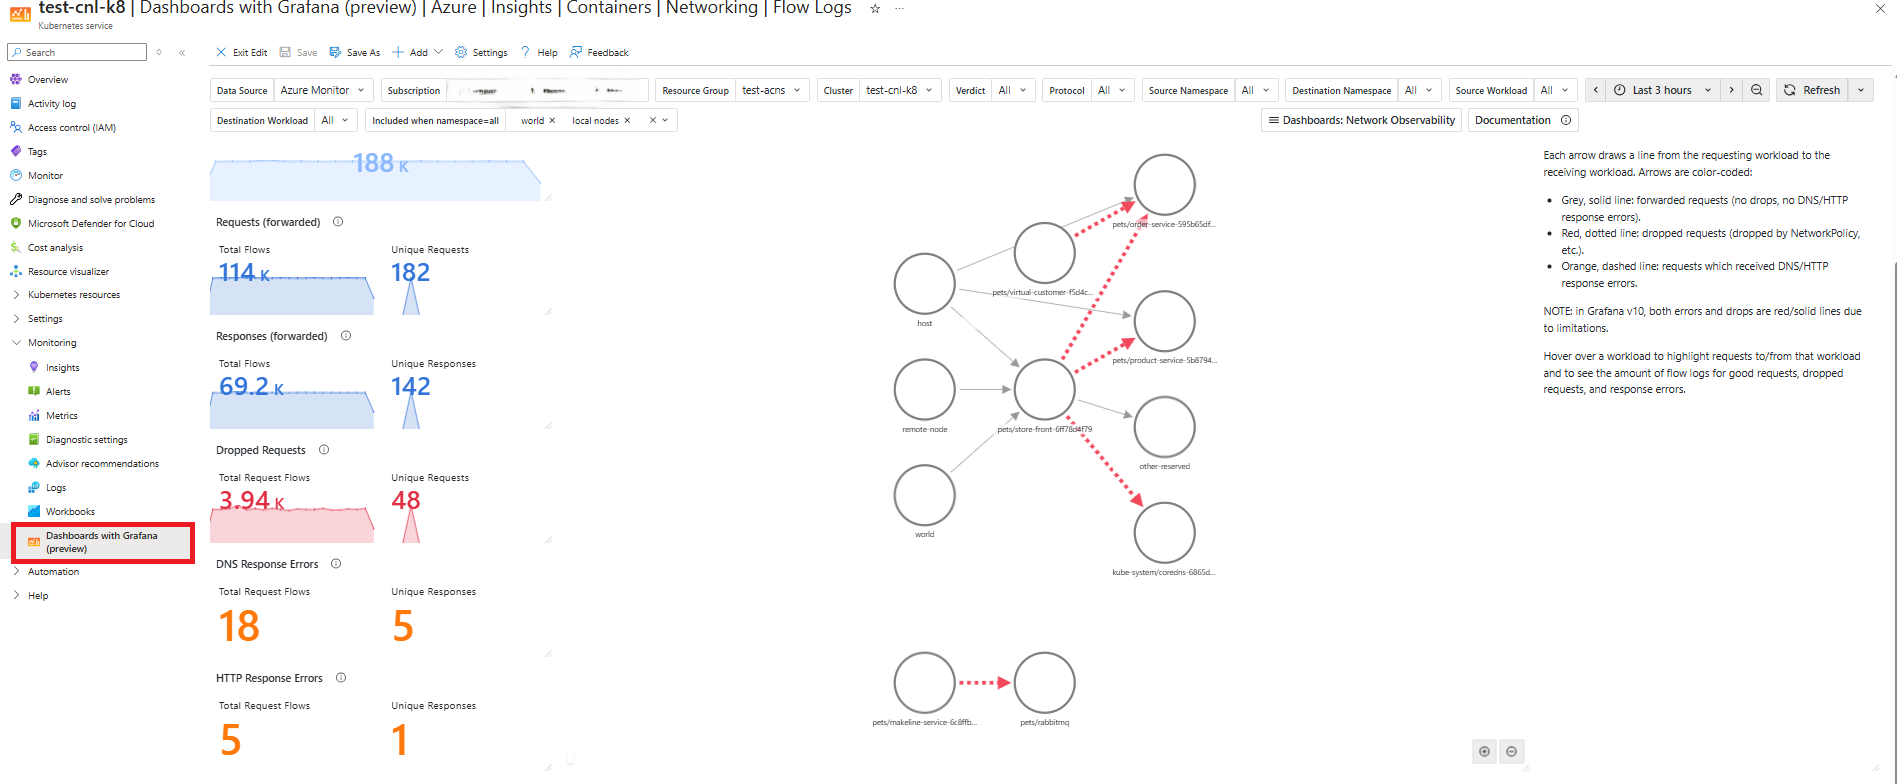
For more about the dashboard components, see the container network logs overview.
Tip
The ContainerNetworkLogs table defaults to the Analytics tier. If you want to reduce ingestion and retention costs, you can switch to the Basic tier and use the corresponding dashboard. For more information, see Log Analytics table plans.
Customize flow log aggregation
The service aggregates flow logs using its default grouping fields
within a 30-second interval. Add supported fields through
spec.aggregation.additionalFields to customize the distinctions your logs
preserve for your operational and investigation needs.
Additional grouping fields extend the defaults; they don't change the interval. They apply to all selected stored logs in the cluster, including traffic selected by other resources. Coordinate changes with other teams using the cluster. Changes affect new records, not historical logs.
The following examples show how destination IP addresses and DNS query names help answer specific investigation questions. They aren't an exhaustive list of supported fields. Complete stored-log setup and forwarding before querying the results. Use a new resource name if an example name is already in use.
Important
Destination IP addresses and DNS query names are high-cardinality fields: they can have many distinct values. Use them when you need this detail, but assess the potential increase in cluster-wide log volume and ingestion and storage costs before enabling them. Monitor usage, review sensitive-data implications, and remove temporary additions when your investigation ends.
Aggregation field example 1: Identify destination IP addresses
Question: Which destination IP addresses did my workload communicate with?
Default aggregation preserves workload metadata and destination ports, but not
individual destination IP addresses. Add IP.destination to distinguish addresses
that would otherwise share the same default grouping values, such as backend
replicas in the same workload. This field helps you identify the destination involved
in a connectivity investigation. The field records the address seen at the
observation point; it isn't a complete record of address translation.
Save the following configuration as destination-ip-logs.yaml, replacing production/
with your application's namespace:
apiVersion: acn.azure.com/v1alpha1
kind: ContainerNetworkLog
metadata:
  name: destination-ip-logs
spec:
  includefilters:
    - name: namespace-tcp
      from:
        namespacedPod: ["production/"]
      protocol: ["tcp"]
  aggregation:
    additionalFields:
      - IP.destination
Validate and apply the resource, then check for status.state: CONFIGURED:
kubectl apply --dry-run=server -f destination-ip-logs.yaml
kubectl apply -f destination-ip-logs.yaml
kubectl get containernetworklog destination-ip-logs -o yaml
Generate new TCP traffic as described in Generate test traffic. Replace the cluster ID and namespace in this query:
let ClusterResourceId = "<AKS-resource-ID>";
ContainerNetworkLogs
| where TimeGenerated > ago(30m)
| where _ResourceId =~ ClusterResourceId
| where SourceNamespace == "production"
| where isnotempty(Layer4.TCP)
| project TimeGenerated, SourceNamespace, SourceWorkloads,
          DestinationNamespace, DestinationWorkloads,
          DestinationIP = tostring(IP.destination),
          DestinationPort = toint(Layer4.TCP.destination_port),
          Verdict,
          IngressFlowCount, EgressFlowCount
| order by TimeGenerated desc
Look for the selected workload and destination port, then inspect DestinationIP.
When traffic reaches different backend addresses in the same workload, the query
shows those addresses separately. Compare the addresses and verdicts to narrow
your investigation; a forwarded verdict alone doesn't prove application success.
IP.destination is a high-cardinality addition, so review the volume and cost
impact described earlier.
Aggregation field example 2: Identify DNS names associated with failures
Question: Which DNS name returned NXDOMAIN for my application?
Default aggregation retains DNS response codes but not the requested names.
Add l7.dns.query to identify the name associated with a response and l7.type
to select responses explicitly. This helps you find misspelled service names or
references to services that no longer exist. l7.dns.query is high-cardinality;
l7.type has a small set of values. DNS response code (l7.dns.rcode) is
already a default grouping field and doesn't need to be added.
First configure DNS visibility
for a running client pod with nslookup.
Save this as dns-investigation.yaml. Replace pets/dns-client in both filters
with your client namespace and pod-name prefix:
apiVersion: acn.azure.com/v1alpha1
kind: ContainerNetworkLog
metadata:
  name: dns-investigation
spec:
  includefilters:
    - name: dns-from-client
      from:
        namespacedPod: ["pets/dns-client"]
      protocol: ["dns"]
    - name: dns-to-client
      to:
        namespacedPod: ["pets/dns-client"]
      protocol: ["dns"]
  aggregation:
    additionalFields:
      - l7.dns.query
      - l7.type
The two filters select DNS traffic from or to the client. Apply the resource
and check for status.state: CONFIGURED:
kubectl apply --dry-run=server -f dns-investigation.yaml
kubectl apply -f dns-investigation.yaml
kubectl get containernetworklog dns-investigation -o yaml
Generate a lookup using your client and a name expected to resolve. For a service test, a fully qualified name with a trailing dot avoids DNS search-suffix retries:
DNS_NAMESPACE="pets"
DNS_CLIENT_POD="<your-client-pod>"
DNS_NAME="<name-to-resolve>"
date -u '+DNS test start (UTC): %Y-%m-%dT%H:%M:%SZ'
kubectl exec -n "$DNS_NAMESPACE" "$DNS_CLIENT_POD" -- nslookup "$DNS_NAME"
For a pod with multiple containers, add -c <container-name> to kubectl exec.
To investigate a reported failure, repeat the lookup with the affected name.
After aggregation and ingestion, query new responses in Log Analytics. Replace
the cluster ID and client namespace:
ContainerNetworkLogs
| where TimeGenerated > ago(30m)
| where _ResourceId =~ "<AKS-resource-ID>"
| where DestinationNamespace == "<client-namespace>"
| where tostring(Layer7.type) == "RESPONSE"
| where isnotempty(Layer7.dns)
| project TimeGenerated, DestinationNamespace, DestinationWorkloads,
          RequestedName = tostring(Layer7.dns.query),
          DnsMessageType = tostring(Layer7.type),
          DnsResponseCode = toint(Layer7.dns.rcode),
          IngressFlowCount, EgressFlowCount
| order by TimeGenerated desc
l7.dns.query is queried through Layer7.dns.query, and l7.type through
Layer7.type. Find the name you tested in RequestedName and inspect its
response code. The client is the destination of a DNS response.
Code 3 means NXDOMAIN for that name. A successful response can omit the zero
code (NOERROR), so confirm success with the address returned by nslookup.
A blank code alone isn't proof of success.
This example preserves requested names and response outcomes, but not returned IP addresses. Records are still aggregated, not a complete per-lookup event history or a count of unique requests. DNS names can reveal internal service details; review data access and retention as well as ingestion volume.
Choose other fields
Choose any additional field supported by your cluster's Hubble Flow schema
to tailor aggregation to your needs. Workload metadata, destination ports, and
DNS/HTTP response codes are already included in the defaults.
IP addresses, pod names, source ports, DNS names, and HTTP URLs can provide finer detail. Because these fields can have many distinct values, assess the impact on cluster-wide log volume, ingestion and storage costs, and sensitive data before enabling them. Monitor usage to balance visibility with your budget.
Field paths are case-sensitive and must be supported by the Cilium version on your cluster; see the Hubble Flow definition. The original flow must contain the data. Retained values are written to node-local logs and, when forwarded, queried using existing columns and dynamic properties in the ContainerNetworkLogs table. Adding a field doesn't create a new table column.
Filter logs by Cilium security identity
Use from.identities or to.identities to select traffic by Cilium's numeric
endpoint classification. For example, collect TCP traffic from a namespace to
destinations classified as world. This filter uses default aggregation fields.
Save this configuration as world-egress-logs.yaml, replacing production/ with your namespace:
apiVersion: acn.azure.com/v1alpha1
kind: ContainerNetworkLog
metadata:
  name: production-world-egress
spec:
  includefilters:
    - name: production-to-world
      from:
        namespacedPod: ["production/"]
      to:
        identities: [2, 9, 10]
      protocol: ["tcp"]
kubectl apply --dry-run=server -f world-egress-logs.yaml
kubectl apply -f world-egress-logs.yaml
kubectl get containernetworklog production-world-egress -o yaml
After the resource reports CONFIGURED, generate traffic to an approved external
destination. Inspect new Log Analytics records for the selected workload and
DestinationIdentity values from the configured list. Other resources can
continue collecting other traffic.
| Value | Cilium identity |
|---|---|
2 |
world |
9 |
world IPv4 |
10 |
world IPv6 |
These values are alternatives; 2 doesn't also select 9 and 10.
The API accepts integers from 0 through 16777215, not aliases such as
world. These values aren't Azure managed identities. Endpoints assigned another
identity, such as a CIDR identity, don't match this list.
Remove temporary customization
To stop requesting additional fields while keeping your traffic filters, remove
the aggregation section from your saved manifest and reapply it. Other resources
can still request those fields; service defaults remain.
To remove a temporary collection resource, delete only the one you created:
kubectl delete containernetworklog "<your-investigation-resource-name>"
Historical logs aren't deleted.
Configure on-demand logs mode
On-demand logs let you capture flow data in real time without persistent storage. This mode works with both Cilium and non-Cilium data planes.
Your cluster needs Advanced Container Networking Services enabled. If you don't have an ACNS-enabled cluster yet, create one:
export CLUSTER_NAME="<aks-cluster-name>"
export RESOURCE_GROUP="<aks-resource-group>"

az aks create \
    --name $CLUSTER_NAME \
    --resource-group $RESOURCE_GROUP \
    --generate-ssh-keys \
    --location eastus \
    --max-pods 250 \
    --network-plugin azure \
    --network-plugin-mode overlay \
    --network-dataplane cilium \
    --node-count 2 \
    --pod-cidr 192.168.0.0/16 \
    --kubernetes-version 1.36 \
    --enable-acns
Enable ACNS on an existing cluster
To enable ACNS on a cluster you already have:
az aks update \
    --resource-group $RESOURCE_GROUP \
    --name $CLUSTER_NAME \
    --enable-acns
Note
Container Network Security features require the Cilium data plane.
Get your cluster credentials:
az aks get-credentials --name $CLUSTER_NAME --resource-group $RESOURCE_GROUP
Install the Hubble CLI
Run these commands in a Linux Bash terminal.
export HUBBLE_VERSION=v1.16.3
export HUBBLE_ARCH=amd64

if [ "$(uname -m)" = "aarch64" ]; then HUBBLE_ARCH=arm64; fi
curl -L --fail --remote-name-all https://github.com/cilium/hubble/releases/download/$HUBBLE_VERSION/hubble-linux-${HUBBLE_ARCH}.tar.gz{,.sha256sum}
sha256sum --check hubble-linux-${HUBBLE_ARCH}.tar.gz.sha256sum
sudo tar xzvfC hubble-linux-${HUBBLE_ARCH}.tar.gz /usr/local/bin
rm hubble-linux-${HUBBLE_ARCH}.tar.gz{,.sha256sum}
Use the Hubble CLI
Confirm the Hubble Relay pod is running:
kubectl get pods -o wide -n kube-system -l k8s-app=hubble-relayExpected output:
hubble-relay-7ddd887cdb-h6khj 1/1 Running 0 23hConfirm that the client certificate secret is available before continuing:
kubectl get secret hubble-relay-client-certs -n kube-systemResolve missing resources or access errors before configuring the client.
Port-forward the Hubble Relay in a dedicated terminal:
kubectl port-forward -n kube-system svc/hubble-relay --address 127.0.0.1 4245:443Leave it running while you use Hubble. Perform the following commands in a second terminal, and stop the port-forward with Ctrl+C when finished.
Configure mTLS certificates for the Hubble client in the second terminal:
#!/usr/bin/env bash
set -euo pipefail
CERT_DIR="$(pwd)/.certs"
umask 077
mkdir -p "$CERT_DIR"

declare -A CERT_FILES=(
  ["tls.crt"]="tls-client-cert-file"
  ["tls.key"]="tls-client-key-file"
  ["ca.crt"]="tls-ca-cert-files"
)

for FILE in "${!CERT_FILES[@]}"; do
  KEY="${CERT_FILES[$FILE]}"
  JSONPATH="{.data['${FILE//./\\.}']}"

  kubectl get secret hubble-relay-client-certs -n kube-system \
    -o jsonpath="${JSONPATH}" | \
    base64 -d > "$CERT_DIR/$FILE"

  hubble config set "$KEY" "$CERT_DIR/$FILE"
done

hubble config set tls true
hubble config set tls-server-name instance.hubble-relay.cilium.io
hubble config set server localhost:4245
Observe flows involving a pod you want to investigate. Replace the values:
hubble observe --pod "<namespace>/<pod-name>"Look for flows involving the selected pod. If none appear, check the pod name and whether it is generating traffic. An empty result alone doesn't establish a connectivity problem.
Set up the Hubble UI
If a Hubble UI deployment already exists, coordinate with its owner rather than overwriting it.
Save the following manifest as
hubble-ui.yaml:apiVersion: v1 kind: ServiceAccount metadata: name: hubble-ui namespace: kube-system --- kind: ClusterRole apiVersion: rbac.authorization.k8s.io/v1 metadata: name: hubble-ui labels: app.kubernetes.io/part-of: retina rules: - apiGroups: - networking.k8s.io resources: - networkpolicies verbs: - get - list - watch - apiGroups: - "" resources: - componentstatuses - endpoints - namespaces - nodes - pods - services verbs: - get - list - watch - apiGroups: - apiextensions.k8s.io resources: - customresourcedefinitions verbs: - get - list - watch - apiGroups: - cilium.io resources: - "*" verbs: - get - list - watch --- apiVersion: rbac.authorization.k8s.io/v1 kind: ClusterRoleBinding metadata: name: hubble-ui labels: app.kubernetes.io/part-of: retina roleRef: apiGroup: rbac.authorization.k8s.io kind: ClusterRole name: hubble-ui subjects: - kind: ServiceAccount name: hubble-ui namespace: kube-system --- apiVersion: v1 kind: ConfigMap metadata: name: hubble-ui-nginx namespace: kube-system data: nginx.conf: | server { listen 8081; server_name localhost; root /app; index index.html; client_max_body_size 1G; location / { proxy_set_header Host $host; proxy_set_header X-Real-IP $remote_addr; # CORS add_header Access-Control-Allow-Methods "GET, POST, PUT, HEAD, DELETE, OPTIONS"; add_header Access-Control-Allow-Origin *; add_header Access-Control-Max-Age 1728000; add_header Access-Control-Expose-Headers content-length,grpc-status,grpc-message; add_header Access-Control-Allow-Headers range,keep-alive,user-agent,cache-control,content-type,content-transfer-encoding,x-accept-content-transfer-encoding,x-accept-response-streaming,x-user-agent,x-grpc-web,grpc-timeout; if ($request_method = OPTIONS) { return 204; } # /CORS location /api { proxy_http_version 1.1; proxy_pass_request_headers on; proxy_hide_header Access-Control-Allow-Origin; proxy_pass http://127.0.0.1:8090; } location / { try_files $uri $uri/ /index.html /index.html; } # Liveness probe location /healthz { access_log off; add_header Content-Type text/plain; return 200 'ok'; } } } --- kind: Deployment apiVersion: apps/v1 metadata: name: hubble-ui namespace: kube-system labels: k8s-app: hubble-ui app.kubernetes.io/name: hubble-ui app.kubernetes.io/part-of: retina spec: replicas: 1 selector: matchLabels: k8s-app: hubble-ui template: metadata: labels: k8s-app: hubble-ui app.kubernetes.io/name: hubble-ui app.kubernetes.io/part-of: retina spec: serviceAccountName: hubble-ui automountServiceAccountToken: true containers: - name: frontend image: mcr.azk8s.cn/oss/cilium/hubble-ui:v0.12.2 imagePullPolicy: Always ports: - name: http containerPort: 8081 livenessProbe: httpGet: path: /healthz port: 8081 readinessProbe: httpGet: path: / port: 8081 resources: {} volumeMounts: - name: hubble-ui-nginx-conf mountPath: /etc/nginx/conf.d/default.conf subPath: nginx.conf - name: tmp-dir mountPath: /tmp terminationMessagePolicy: FallbackToLogsOnError securityContext: {} - name: backend image: mcr.azk8s.cn/oss/cilium/hubble-ui-backend:v0.12.2 imagePullPolicy: Always env: - name: EVENTS_SERVER_PORT value: "8090" - name: FLOWS_API_ADDR value: "hubble-relay:443" - name: TLS_TO_RELAY_ENABLED value: "true" - name: TLS_RELAY_SERVER_NAME value: ui.hubble-relay.cilium.io - name: TLS_RELAY_CA_CERT_FILES value: /var/lib/hubble-ui/certs/hubble-relay-ca.crt - name: TLS_RELAY_CLIENT_CERT_FILE value: /var/lib/hubble-ui/certs/client.crt - name: TLS_RELAY_CLIENT_KEY_FILE value: /var/lib/hubble-ui/certs/client.key livenessProbe: httpGet: path: /healthz port: 8090 readinessProbe: httpGet: path: /healthz port: 8090 ports: - name: grpc containerPort: 8090 resources: {} volumeMounts: - name: hubble-ui-client-certs mountPath: /var/lib/hubble-ui/certs readOnly: true terminationMessagePolicy: FallbackToLogsOnError securityContext: {} nodeSelector: kubernetes.io/os: linux volumes: - configMap: defaultMode: 420 name: hubble-ui-nginx name: hubble-ui-nginx-conf - emptyDir: {} name: tmp-dir - name: hubble-ui-client-certs projected: defaultMode: 0400 sources: - secret: name: hubble-relay-client-certs items: - key: tls.crt path: client.crt - key: tls.key path: client.key - key: ca.crt path: hubble-relay-ca.crt --- kind: Service apiVersion: v1 metadata: name: hubble-ui namespace: kube-system labels: k8s-app: hubble-ui app.kubernetes.io/name: hubble-ui app.kubernetes.io/part-of: retina spec: type: ClusterIP selector: k8s-app: hubble-ui ports: - name: http port: 80 targetPort: 8081Apply the manifest and wait for the UI to become ready:
kubectl apply -f hubble-ui.yaml
kubectl rollout status deployment/hubble-ui -n kube-system --timeout=120s
Set up port forwarding:
kubectl -n kube-system port-forward --address 127.0.0.1 svc/hubble-ui 12000:80Open
http://localhost:12000/in your browser to access the Hubble UI.Stop the port-forward with Ctrl+C when finished. If you created the UI only for this investigation, remove it with
kubectl delete -f hubble-ui.yamlwhen no one else needs it.
Troubleshooting
ACNS not enabled. Running
--enable-container-network-logswithout ACNS produces:Flow logs requires '--enable-acns', advanced networking to be enabled.Kubernetes version too old. Running
--enable-container-network-logson a cluster older than 1.36.0 produces:The specified orchestrator version %s is not valid. Advanced Networking Flow Logs is only supported on Kubernetes version 1.36.0 or later.CRD not recognized. Applying a
ContainerNetworkLogon a cluster without ACNS produces:error: resource mapping not found for <....>": no matches for kind "ContainerNetworkLog" in version "acn.azure.com/v1alpha1"Make sure ACNS is enabled on the cluster.
An additional field or identity filter is rejected. Check the installed API with
kubectl explain containernetworklog.spec.aggregation.additionalFieldsorkubectl explain containernetworklog.spec.includefilters.to.identities. For a resource reportingFAILED, readstatus.reasonand correct the configuration.A cardinality warning appears. The warning doesn't block collection. Review the additional grouping fields and monitor ingestion volume.
The resource is configured but no records appear. Allow time for configuration propagation, generate fresh matching traffic, and check the query time range, protocol visibility, and forwarding configuration.
Disable stored logs mode
Stored logs has two layers — log generation on the node, and optional forwarding to Azure Monitor. You can turn off either layer independently.
Stop generating logs
List the collection requests, and then remove only resources whose owners approve stopping collection:
kubectl get containernetworklog
kubectl delete containernetworklog "<cr-name>"
Other collection requests can keep logging active, including legacy flow-log resources if present. Coordinate cluster-wide shutdown with the administrator. Historical records remain in the logging backend.
Stop forwarding logs to Azure Monitor
If you only want to stop sending logs to your Log Analytics workspace but keep generating them on the node, disable the Azure Monitor integration:
az aks update -n $CLUSTER_NAME -g $RESOURCE_GROUP --disable-container-network-logs
Existing ContainerNetworkLog resources remain in effect, so flows continue to land on each node at /var/log/acns/hubble/events.log until you remove those resources.
Clean up resources
Delete the resource group only if you created a dedicated resource group for this exercise and no longer need anything in it. This action deletes all resources in that group:
az group delete --name $RESOURCE_GROUP
Limitations
Data plane and Kubernetes version
- Stored logs mode requires the Cilium data plane and Kubernetes 1.36 or later.
- On-demand logs (Hubble CLI and Hubble UI) work with both Cilium and non-Cilium data planes.
Layer 7 and DNS visibility
- Layer 7 flow records are populated only when L7 policy support is enabled on the cluster and a
CiliumNetworkPolicywith L7 rules covers the traffic. For details, see Configure a Layer 7 policy. - DNS records are populated only when a Cilium FQDN policy (
rules.dnsplustoFQDNs) covers the traffic.
Host-local storage
- Without Azure Monitor or an external collector, flow logs are stored on each node at
/var/log/acns/hubble/events.logand capped at 50 MB. When the cap is reached, older entries are overwritten. - Flow logs are written to host nodes and collected by the Azure Monitor Agent. If you enable Log Analytics integration after applying a
ContainerNetworkLogcustom resource, only new logs from that point forward are ingested. Historical logs on the host aren't collected.
Log Analytics
- Switching the Log Analytics workspace after enabling Container Network Logs might cause logs to stop flowing to the new workspace. This happens because the existing Azure Monitor data collection configuration isn't automatically updated. To prevent this issue, configure the desired workspace when first enabling Container Network Logs, or manually update the associated data collection rule when changing workspaces. See Configure data collection in Container insights.
- The
ContainerNetworkLogstable supports the Analytics (default) and Basic tiers. The Auxiliary tier isn't supported.
Aggregation trade-offs
- Use
aggregation.additionalFieldsto customize how newly collected logs are grouped and which details they preserve. The data must be present in the original flow. - The additional grouping fields apply cluster-wide and can increase ingestion costs. They don't change the aggregation interval, remove managed defaults, or recover historical details.
- Aggregated records don't provide a timestamp for every event in the group. Use on-demand logs for real-time per-flow inspection.
Related content
- What are container network logs?
- Advanced Container Networking Services for AKS
- Container Network Observability in Advanced Container Networking Services