Note
Access to this page requires authorization. You can try signing in or changing directories.
Access to this page requires authorization. You can try changing directories.
Kubernetes includes a web dashboard that can be used for basic management operations. This dashboard lets you view basic health status and metrics for your applications, create and deploy services, and edit existing applications. This article shows you how to access the Kubernetes dashboard using the Azure CLI, then guides you through some basic dashboard operations.
For more information on the Kubernetes dashboard, see Kubernetes Web UI Dashboard. AKS uses version 2.0 and greater of the open-source dashboard.
Warning
The AKS dashboard add-on is set for deprecation.
- The Kubernetes dashboard is enabled by default for clusters running a Kubernetes version less than 1.18.
- The dashboard add-on will be disabled by default for all new clusters created on Kubernetes 1.18 or greater.
- Starting with Kubernetes 1.19 in preview, AKS will no longer support installation of the managed kube-dashboard addon.
- Existing clusters with the add-on enabled will not be impacted. Users will continue to be able to manually install the open-source dashboard as user-installed software.
Before you begin
The steps detailed in this document assume that you've created an AKS cluster and have established a kubectl connection with the cluster. If you need to create an AKS cluster, see Quickstart: Deploy an Azure Kubernetes Service cluster using the Azure CLI.
You also need the Azure CLI version 2.6.0 or later installed and configured. Run az --version to find the version. If you need to install or upgrade, see Install Azure CLI.
Disable the Kubernetes dashboard
The kube-dashboard addon is enabled by default on clusters older than K8s 1.18. The addon can be disabled by running the following command.
az aks disable-addons -g myRG -n myAKScluster -a kube-dashboard
Start the Kubernetes dashboard
Warning
The AKS dashboard add-on is deprecated for versions 1.19+.
To start the Kubernetes dashboard on a cluster, use the az aks browse command. This command requires the installation of the kube-dashboard addon on the cluster, which is included by default on clusters running any version older than Kubernetes 1.18.
The following example opens the dashboard for the cluster named myAKSCluster in the resource group named myResourceGroup:
# Enable kube-dashboard addon before start the kubernetes dashboard
az aks enable-addons --addons kube-dashboard --resource-group myResourceGroup --name myAKSCluster

az aks browse --resource-group myResourceGroup --name myAKSCluster
This command creates a proxy between your development system and the Kubernetes API, and opens a web browser to the Kubernetes dashboard. If a web browser doesn't open to the Kubernetes dashboard, copy and paste the URL address noted in the Azure CLI, typically http://127.0.0.1:8001.
Note
If you do not see the dashboard at http://127.0.0.1:8001 you can manually route to the following addresses. Clusters on 1.16 or greater use https and require a separate endpoint.
- K8s 1.16 or greater:
http://127.0.0.1:8001/api/v1/namespaces/kube-system/services/https:kubernetes-dashboard:/proxy - K8s 1.15 and below:
http://127.0.0.1:8001/api/v1/namespaces/kube-system/services/kubernetes-dashboard:/proxy
Sign in to the dashboard (kubernetes 1.16+)
Important
As of v1.10.1 of the Kubernetes dashboard or kubernetes v1.16+ the service account "kubernetes-dashboard" can no longer be used to retrieve resources due to a security fix in that release. As a result, requests without auth info return a 401 unauthorized error. A bearer token retrieved from a service account can still be used as in this Kubernetes Dashboard example, but this impacts the login flow of the dashboard add-on compared to older versions.
If you still run a version prior to 1.16 you can still give permissions to the "kubernetes-dashboard" service account, but this is not recommended:
kubectl create clusterrolebinding kubernetes-dashboard --clusterrole=cluster-admin --serviceaccount=kube-system:kubernetes-dashboard
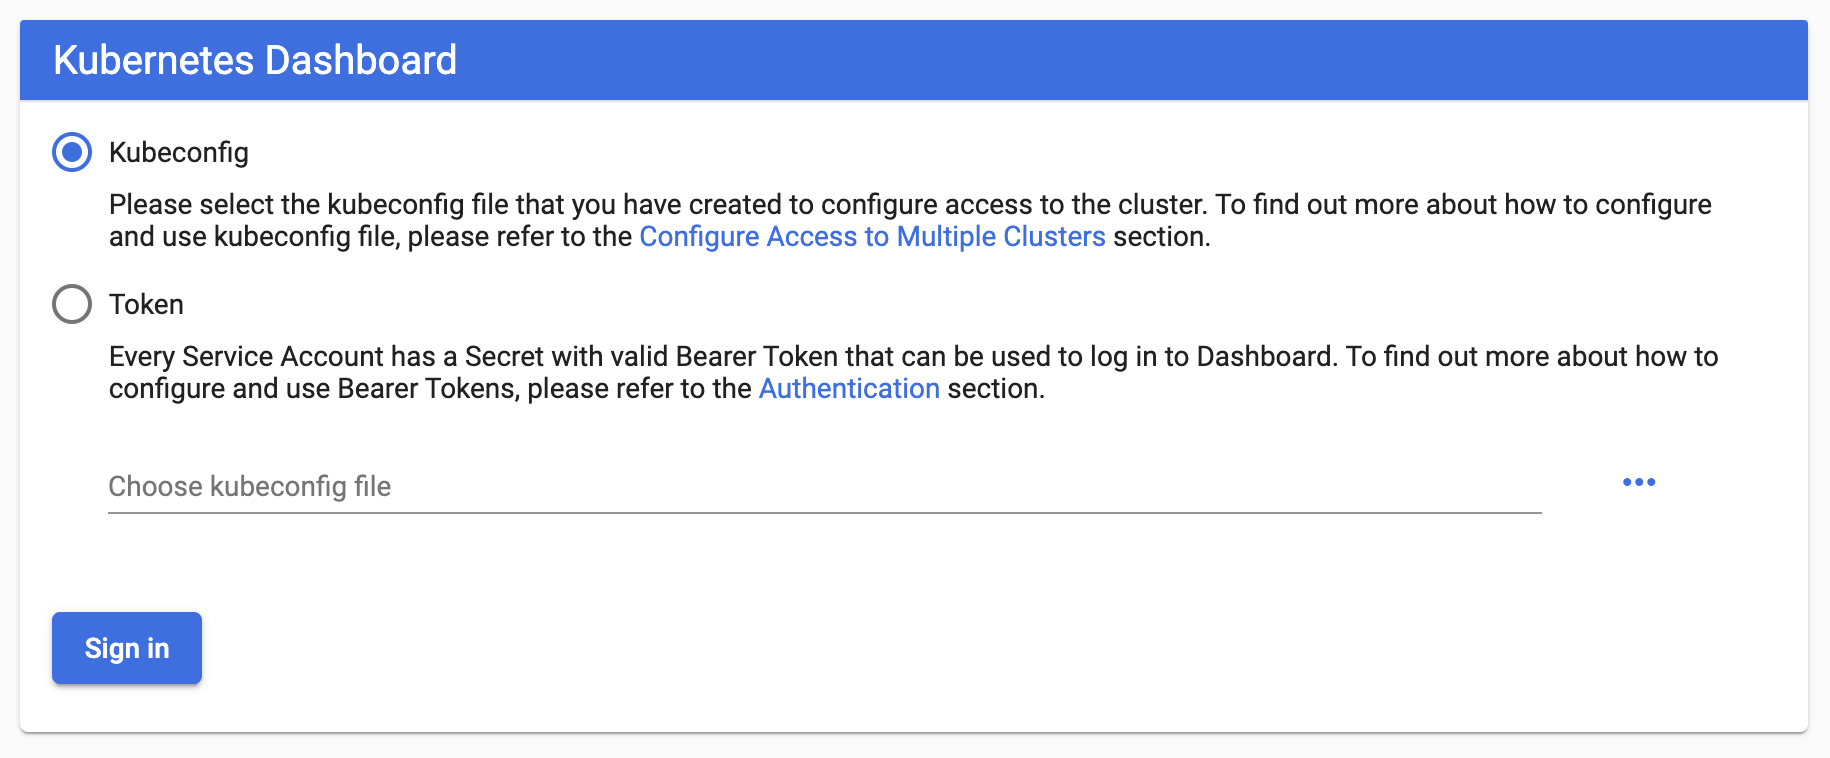
The initial screen presented requires a kubeconfig or token. Both options require resource permissions to display those resources in the dashboard.
Use a kubeconfig
For both Azure AD enabled and non-Azure AD enabled clusters, a kubeconfig can be passed in. Ensure access tokens are valid, if your tokens are expired you can refresh tokens via kubectl.
- Set the admin kubeconfig with
az aks get-credentials -a --resource-group <RG_NAME> --name <CLUSTER_NAME> - Select
Kubeconfigand clickChoose kubeconfig fileto open file selector - Select your kubeconfig file (defaults to $HOME/.kube/config)
- Click
Sign In
Use a token
- For non-Azure AD enabled cluster, run
kubectl config viewand copy the token associated with the user account of your cluster. - Paste into the token option at sign in.
- Click
Sign In
For Azure AD enabled clusters, retrieve your AAD token with the following command. Validate you've replaced the resource group and cluster name in the command.
## Update <RESOURCE_GROUP and <AKS_NAME> with your input.

kubectl config view -o jsonpath='{.users[?(@.name == "clusterUser_<RESOURCE GROUP>_<AKS_NAME>")].user.auth-provider.config.access-token}'
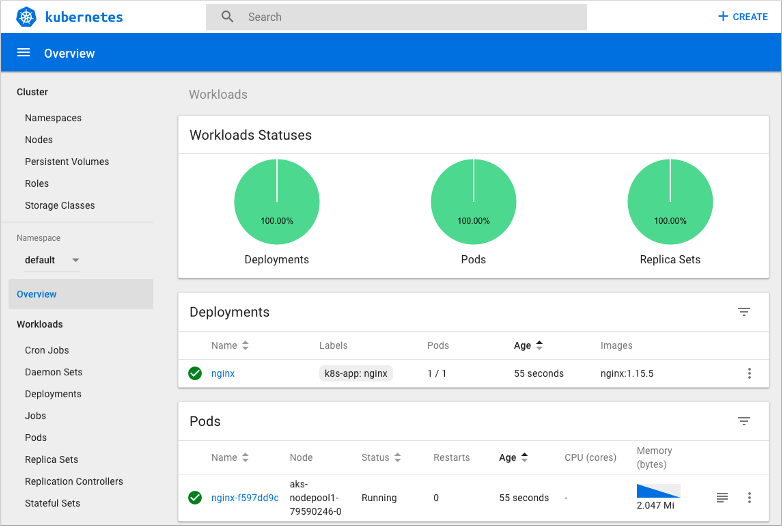
Once successful, a page similar to the below will be displayed.
Create an application
The following steps require the user to have permissions to the respective resources.
To see how the Kubernetes dashboard can reduce the complexity of management tasks, let's create an application. You can create an application from the Kubernetes dashboard by providing text input, a YAML file, or through a graphical wizard.
To create an application, complete the following steps:
- Select the Create button in the upper right window.
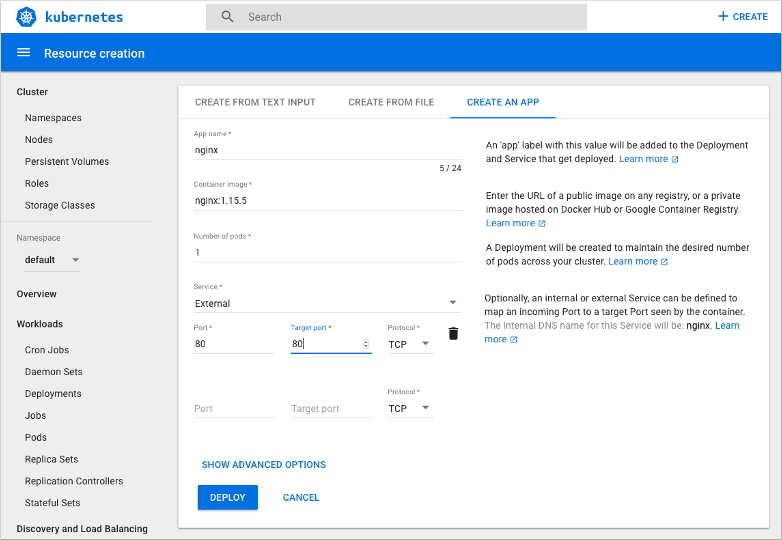
- To use the graphical wizard, choose to Create an app.
- Provide a name for the deployment, such as nginx
- Enter the name for the container image to use, such as nginx:1.15.5
- To expose port 80 for web traffic, you create a Kubernetes service. Under Service, select External, then enter 80 for both the port and target port.
- When ready, select Deploy to create the app.
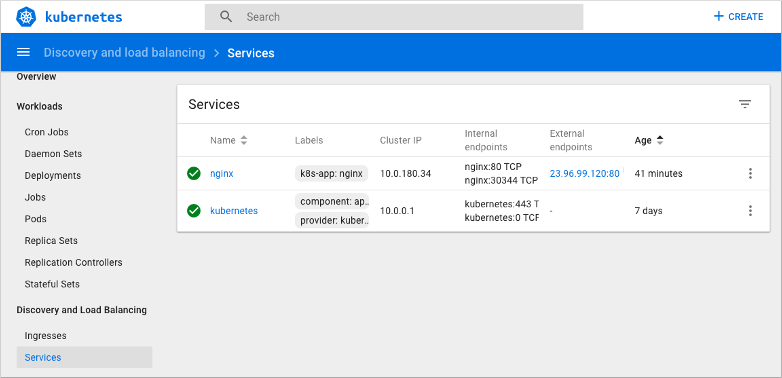
It takes a minute or two for a public external IP address to be assigned to the Kubernetes service. On the left-hand size, under Discovery and Load Balancing select Services. Your application's service is listed, including the External endpoints, as shown in the following example:
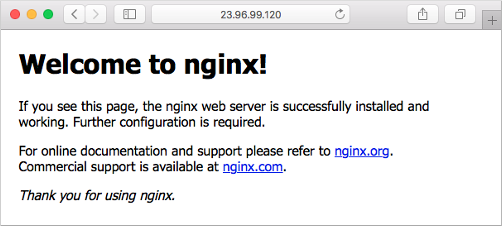
Select the endpoint address to open a web browser window to the default NGINX page:
View pod information
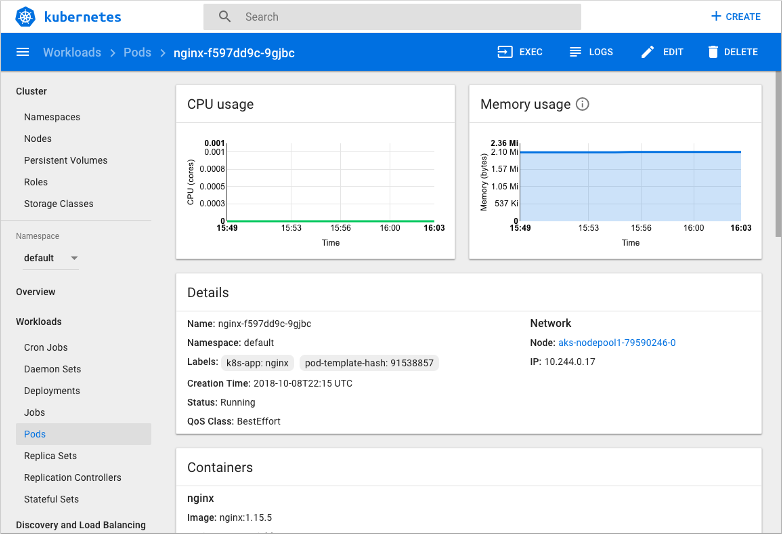
The Kubernetes dashboard can provide basic monitoring metrics and troubleshooting information such as logs.
To see more information about your application pods, select Pods in the left-hand menu. The list of available pods is shown. Choose your nginx pod to view information, such as resource consumption:
Edit the application
In addition to creating and viewing applications, the Kubernetes dashboard can be used to edit and update application deployments. To provide additional redundancy for the application, let's increase the number of NGINX replicas.
To edit a deployment:
- Select Deployments in the left-hand menu, and then choose your nginx deployment.
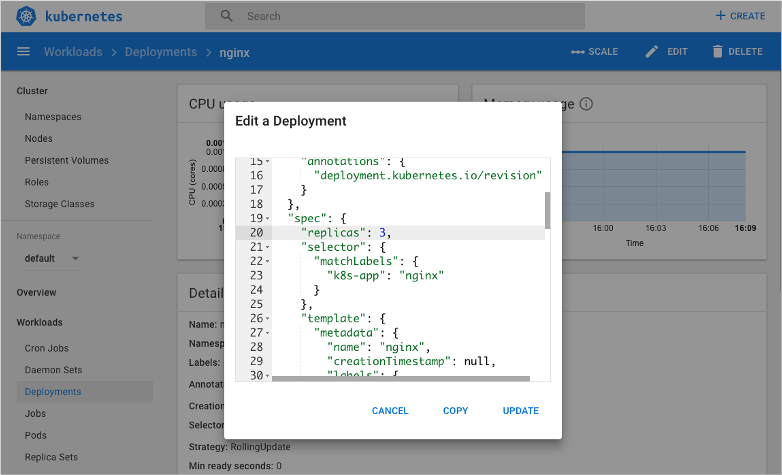
- Select Edit in the upper right-hand navigation bar.
- Locate the
spec.replicavalue, at around line 20. To increase the number of replicas for the application, change this value from 1 to 3. - Select Update when ready.
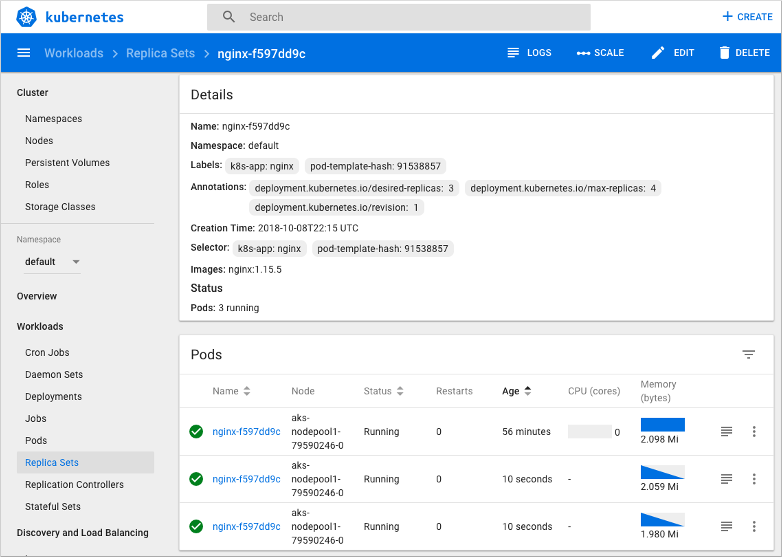
It takes a few moments for the new pods to be created inside a replica set. On the left-hand menu, choose Replica Sets, and then choose your nginx replica set. The list of pods now reflects the updated replica count, as shown in the following example output:
Next steps
For more information about the Kubernetes dashboard, see the Kubernetes Web UI Dashboard.