Note
Access to this page requires authorization. You can try signing in or changing directories.
Access to this page requires authorization. You can try changing directories.
APPLIES TO: All API Management tiers
This article explains how to use the Azure API Management Extension for Visual Studio Code to create, understand, and debug Azure API Management policies with AI assistance from GitHub Copilot for Azure.
Azure API Management policies are a sequence of statements that address cross-cutting concerns like authentication, authorization, throttling, caching, and transformation, applied to API requests or responses.
Prerequisites
Visual Studio Code and the latest version of Azure API Management Extension for Visual Studio Code.
An API Management instance. If you need to create one, see this quickstart.
Import an API to your API Management instance. For example steps, see Tutorial: Use the API Management Extension for Visual Studio Code to import and manage APIs.
Restrictions and limitations
Policy debugging is currently supported only in the API Management Developer tier.
Policy debugging uses the built-in (service-level) all-access subscription (display name "Built-in all-access subscription"). You must be a service owner to use this subscription.
Important
- API Management no longer supports subscriptions for tracing or the Ocp-Apim-Trace header.
- To improve API security, tracing can now be enabled at the level of an individual API by obtaining a time-limited token using the API Management REST API, and passing the token in a request to the gateway. For details, see Enable tracing of an API.
- Take care when enabling tracing, as it can expose sensitive information in the trace data. Ensure that you have appropriate security measures in place to protect the trace data.
Initiate a debugging session
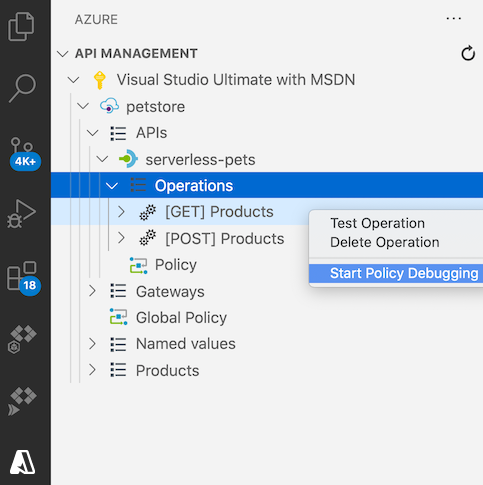
- Open the API Management extension in Visual Studio Code.
- Select the API Management instance to debug.
- Select the API and operation to debug.
- Right click on the operation and select Start Policy Debugging.
At this point, the extension starts to establish a debugging session with the API Management gateway. Check the progress in the Debug Console window.

Note
Starting a debugging session also enables request tracing for the duration of the session, to help you diagnose and solve issues.
Send a test request
When the debugging session is established, the REST Client extension opens a new editor that allows you to create and send a test HTTP request to the gateway.
The Ocp-Apim-Debug header is added automatically to the request. This header is required and the value must be set to the service-level, all-access subscription key to trigger the debugging functionality in the API Management gateway.
Modify the HTTP request in the editor according to your test scenario. Then click Send Request to send the test request to the API Management gateway.

Debug policies
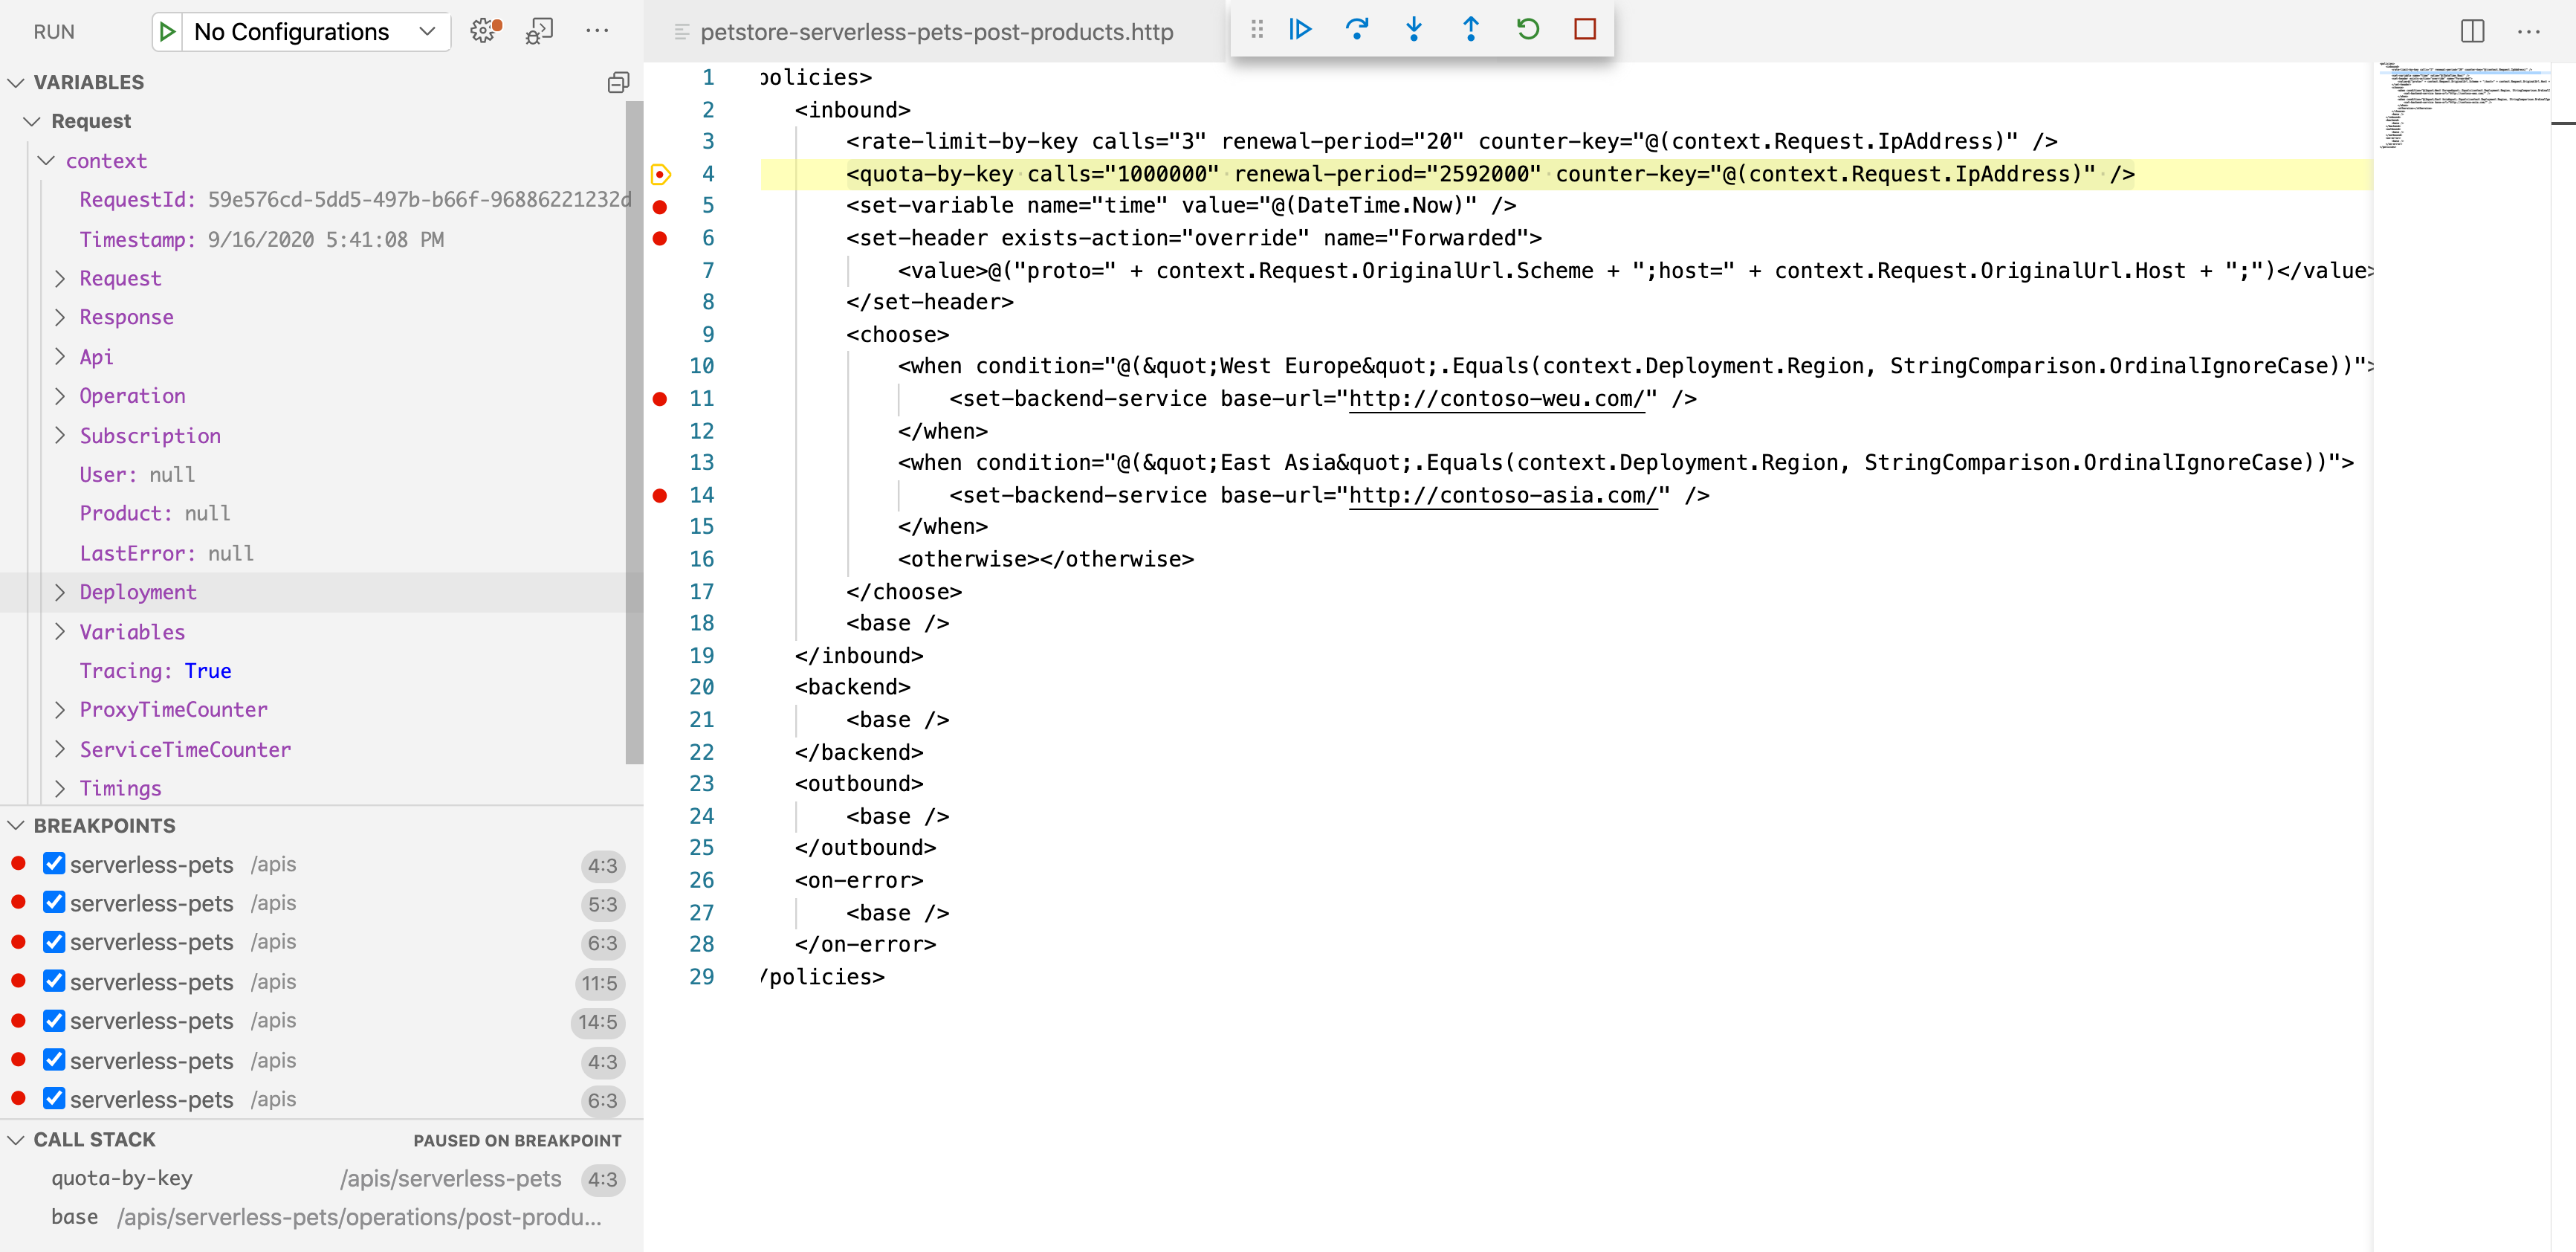
After the test HTTP request is sent, the extension opens the debugging window, which shows the effective policies of this operation and stops at the first effective policy.

To follow the policy pipeline, you can single-step through individual policies or set a breakpoint at a policy and step directly to that policy.
- In the Variables panel, inspect values of system-created and user-created variables.
- In the Breakpoints panel, view the list of all breakpoints that have been set.
- In the Call Stack panel, view the current effective policy scope.
If there is an error during policy execution, you will see the details of the error at the policy where it happened.
Exit the debugging session by clicking the Stop button when you are finished.

Tip
To review the request trace, select the value of the Ocp-Apim-Trace-Location header that is provided in the HTTP response.
Related content
- Learn more about the API Management extension for Visual Studio Code.
- Report issues in the GitHub repository