Note
Access to this page requires authorization. You can try signing in or changing directories.
Access to this page requires authorization. You can try changing directories.
This tutorial shows how to troubleshoot an Azure App Service app by using Azure Monitor. The sample app includes code meant to exhaust memory and cause HTTP 500 errors, so you can diagnose and fix the problem by using Azure Monitor. When you're finished, you have a sample app running on App Service on Linux integrated with Azure Monitor.
Azure Monitor maximizes the availability and performance of your applications and services by delivering a comprehensive solution for collecting, analyzing, and acting on system-generated logs from your cloud and on-premises environments.
In this tutorial, you learn how to:
- Configure a web app with Azure Monitor
- Send console logs to Log Analytics
- Use log queries to identify and troubleshoot web app errors
You can follow the steps in this tutorial on macOS, Linux, or Windows.
Prerequisites
An Azure subscription. If you don't have an Azure trail subscription, create a trial subscription before you begin.
If you prefer to run CLI reference commands locally, install the Azure CLI. If you're running on Windows or macOS, consider running Azure CLI in a Docker container. For more information, see How to run the Azure CLI in a Docker container.
If you're using a local installation, sign in to the Azure CLI by using the az login command. To finish the authentication process, follow the steps displayed in your terminal. For other sign-in options, see Sign in with the Azure CLI.
When you're prompted, install the Azure CLI extension on first use. For more information about extensions, see Use extensions with the Azure CLI.
Run az version to find the version and dependent libraries that are installed. To upgrade to the latest version, run az upgrade.
Create Azure resources
First, run several commands to set up a sample app to use with this tutorial. The following commands create Azure resources, create a deployment user, and deploy the sample app to Azure. You're prompted for the password supplied as a part of the creation of the deployment user.
az group create --name myResourceGroup --location "China East 2"
az webapp deployment user set --user-name <username> --password <password>
az appservice plan create --name myAppServicePlan --resource-group myResourceGroup --sku B1 --is-linux
az webapp create --resource-group myResourceGroup --plan myAppServicePlan --name <app-name> --runtime "PHP|8.4" --deployment-local-git
az webapp config appsettings set --name <app-name> --resource-group myResourceGroup --settings DEPLOYMENT_BRANCH='main'
git clone https://github.com/Azure-Samples/App-Service-Troubleshoot-Azure-Monitor
cd App-Service-Troubleshoot-Azure-Monitor
git branch -m main
git remote add azure <url-from-app-webapp-create>
git push azure main
Configure Azure Monitor
Create a Log Analytics workspace
After you deploy the sample app to Azure App Service, configure monitoring capability to troubleshoot the app when problems arise. Azure Monitor stores log data in a Log Analytics workspace. A workspace is a container that includes data and configuration information.
In this step, you create a Log Analytics workspace to configure Azure Monitor with your app.
az monitor log-analytics workspace create --resource-group myResourceGroup --workspace-name myMonitorWorkspace
Create a diagnostic setting
Azure Monitor uses diagnostic settings to collect metrics for certain Azure services for analysis with other monitoring data using log queries. For this tutorial, you enable the web server and standard output/error logs. For a complete list of log types and descriptions, see Supported resource logs.
Run the following commands to create diagnostic settings for AppServiceConsoleLogs (standard output/error) and AppServiceHTTPLogs (web server logs). Replace <app-name> and <workspace-name> with your values.
resourceID=$(az webapp show -g myResourceGroup -n <app-name> --query id --output tsv)

workspaceID=$(az monitor log-analytics workspace show -g myResourceGroup --workspace-name myMonitorWorkspace --query id --output tsv)

az monitor diagnostic-settings create --resource $resourceID \
 --workspace $workspaceID \
 -n myMonitorLogs \
 --logs '[{"category": "AppServiceConsoleLogs", "enabled": true},
  {"category": "AppServiceHTTPLogs", "enabled": true}]'
Note
The first two commands, resourceID and workspaceID, are variables to be used in the az monitor diagnostic-settings create command. To learn more, see Create diagnostic settings using Azure CLI.
Troubleshoot the app
Browse to http://<app-name>.chinacloudsites.cn.
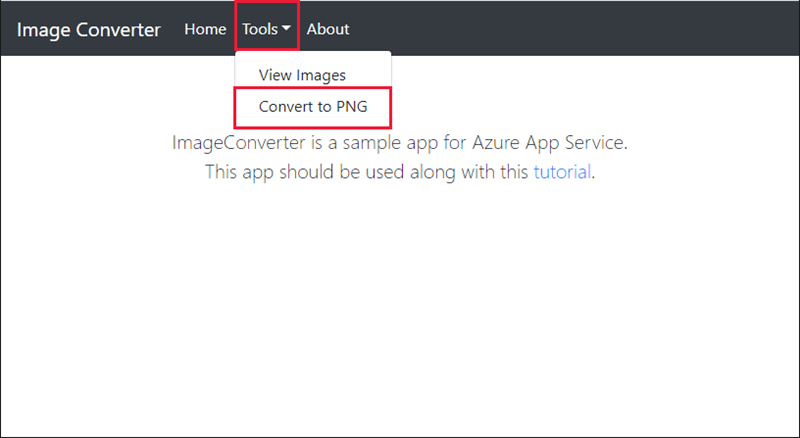
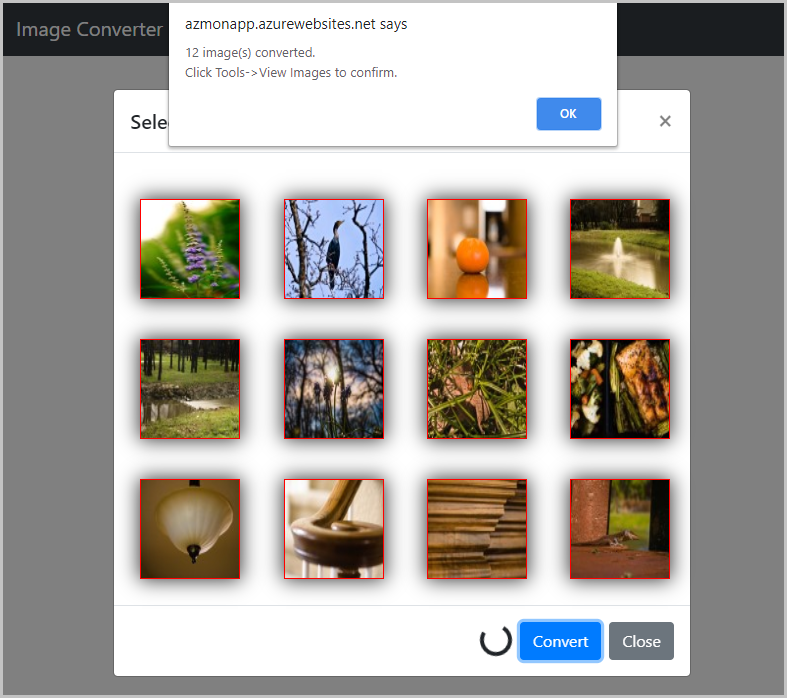
The sample app, ImageConverter, converts included images from JPG to PNG. A bug was deliberately placed in the code for this tutorial. If you select enough images, the app produces an HTTP 500 error during image conversion. Imagine this scenario wasn't considered during the development phase. You'll use Azure Monitor to troubleshoot the error.
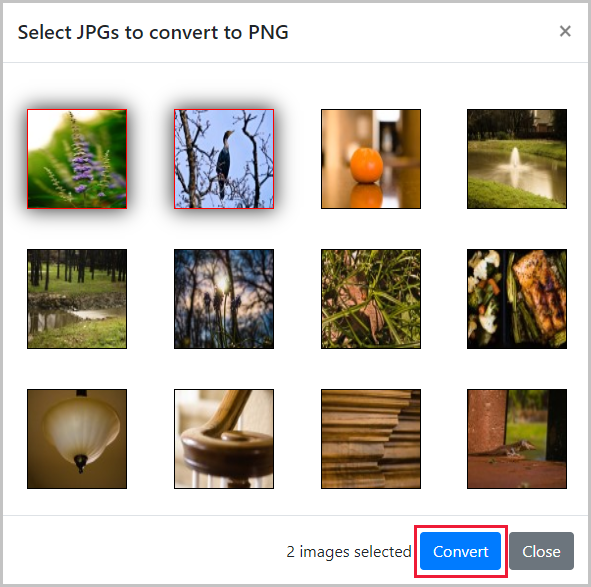
Verify the app works
To convert images, select Tools and then choose Convert to PNG.
Select the first two images and choose Convert. This converts successfully.
Break the app
After you verify the app by converting two images successfully, try to convert the first five images.
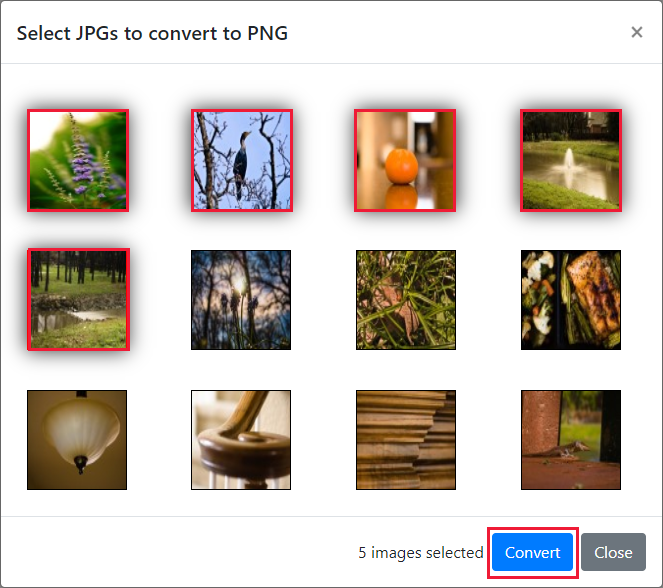
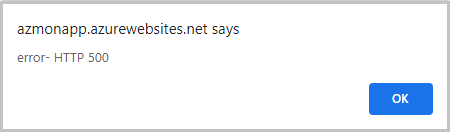
This action fails and produces an HTTP 500 error that wasn't tested during development.
Use log query to view Azure Monitor logs
Let's see what logs are available in the Log Analytics workspace.
Select this Log Analytics workspace link to access your workspace in the Azure portal.
In the Azure portal, select your Log Analytics workspace.
Log queries
Log queries help you to fully apply the value of the data collected in Azure Monitor Logs. You use log queries to identify the logs in both AppServiceHTTPLogs and AppServiceConsoleLogs. To learn more, see Log queries in Azure Monitor.
View AppServiceHTTPLogs with log query
After you access the app, view the data associated with HTTP requests, found in the AppServiceHTTPLogs.
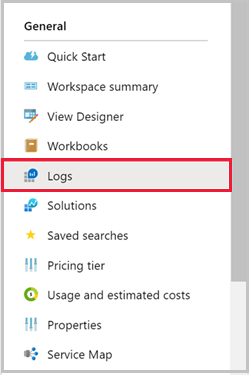
Select Logs from the sidebar menu.
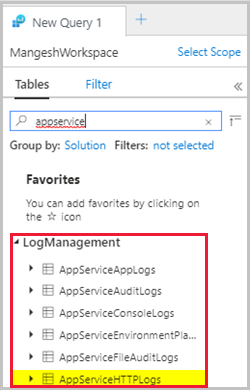
Search for appservice and double-click AppServiceHTTPLogs.
Select Run.
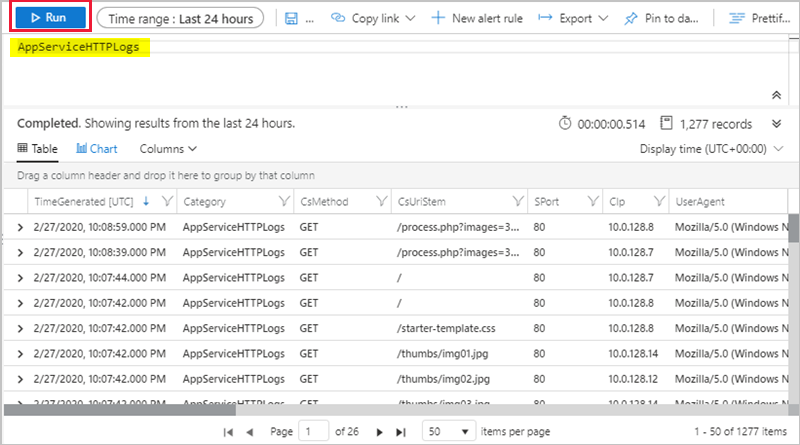
The AppServiceHTTPLogs query returns all requests in the past 24 hours. The column ScStatus contains the HTTP status. To diagnose the HTTP 500 errors, limit ScStatus to 500 and run the query:
AppServiceHTTPLogs
| where ScStatus == 500
View AppServiceConsoleLogs with log query
After you confirm the HTTP 500s, take a look at the standard output/errors from the app. These logs are found in AppServiceConsoleLogs.
Select + to create a new query.
Double-click the AppServiceConsoleLogs table and select Run.
Since converting five images results in server errors, you can see if the app is also writing errors by filtering ResultDescription for errors:
AppServiceConsoleLogs |
where ResultDescription  contains "error"
In the ResultDescription column, you see the following error:
PHP Fatal error:  Allowed memory size of 134217728 bytes exhausted
(tried to allocate 16384 bytes) in /home/site/wwwroot/process.php on line 20,
referer: http://<app-name>.chinacloudsites.cn/
Join AppServiceHTTPLogs and AppServiceConsoleLogs
After you identify both HTTP 500 and standard errors, you need to confirm if there's a correlation between these messages. Join the tables together based on the time stamp TimeGenerated.
Note
A query was prepared for you that does the following:
- Filters HTTPLogs for 500 errors
- Queries console logs
- Joins the tables on
TimeGenerated
Run the following query:
let myHttp = AppServiceHTTPLogs | where  ScStatus == 500 | project TimeGen=substring(TimeGenerated, 0, 19), CsUriStem, ScStatus;

let myConsole = AppServiceConsoleLogs | project TimeGen=substring(TimeGenerated, 0, 19), ResultDescription;

myHttp | join myConsole on TimeGen | project TimeGen, CsUriStem, ScStatus, ResultDescription;
In the ResultDescription column, you'll see the following error at the same time as web server errors:
PHP Fatal error:  Allowed memory size of 134217728 bytes exhausted
(tried to allocate 16384 bytes) in /home/site/wwwroot/process.php on line 20,
referer: http://<app-name>.chinacloudsites.cn/
The message states memory has been exhausted on line 20 of process.php. You've now confirmed that the application produced an HTTP 500 error. Let's take a look at the code to identify the problem.
Identify the error
In the local directory App-Service-Troubleshoot-Azure-Monitor, open process.php and look at line 20.
imagepng($imgArray[$x], $filename);
The first argument, $imgArray[$x], is a variable holding all JPGs (in-memory) needing conversion. However, imagepng only needs the image being converted and not all images. Preloading images isn't necessary and might cause memory exhaustion, leading to HTTP 500 errors. Let's update the code to load images on demand to see if it resolves the issue. Next, improve the code to address the memory problem.
Fix the app
Update locally and redeploy the code
Make the following changes to process.php to handle the memory exhaustion:
<?php

//Retrieve query parameters
$maxImages = $_GET['images'];
$imgNames  = explode(",",$_GET['imgNames']);

//Load JPEGs into an array (in memory)
for ($x=0; $x<$maxImages; $x++){
    $filename = './images/converted_' . substr($imgNames[$x],0,-4) . '.png';
    imagepng(imagecreatefromjpeg("./images/" . $imgNames[$x]), $filename);
}
Commit your changes in Git, and then push the code changes to Azure.
git commit -am "Load images on-demand in process.php"
git push azure main
Browse to the Azure app
Browse to http://<app-name>.chinacloudsites.cn.
Converting images should no longer produce the HTTP 500 errors.
Clean up resources
In the preceding steps, you created Azure resources in a resource group. If you don't expect to need these resources in the future, delete the resource group by running the following command in the local Azure CLI:
az group delete --name myResourceGroup
This command might take a minute to run.
Delete the diagnostic settings by running the following command:
az monitor diagnostic-settings delete --resource $resourceID -n myMonitorLogs