Note
Access to this page requires authorization. You can try signing in or changing directories.
Access to this page requires authorization. You can try changing directories.
Azure Functions integrates with Azure Monitor Metrics to let you analyze the metrics generated by your function app during execution. To learn more, see the Azure Monitor Metrics overview. These metrics indicate how your function app is running on the App Service platform. You can review resource consumption data used to estimate consumption plan costs. To investigate detailed telemetry from your function executions, including log data, you should also use Application Insights in Azure Monitor.
Available metrics
Azure Monitor collects numeric data from a set of monitored resources, which are entered into a time series database. Azure Monitor collects metrics specific to both Functions and the underlying App Service resources.
Functions-specific metrics
There are two metrics specific to Functions that are of interest:
| Metric | Description |
|---|---|
| FunctionExecutionCount | Function execution count indicates the number of times your function app has executed. This value correlates to the number of times a function runs in your app. |
| FunctionExecutionUnits | Function execution units are a combination of execution time and your memory usage. Memory data isn't a metric currently available through Azure Monitor. However, if you want to optimize the memory usage of your app, can use the performance counter data collected by Application Insights. This metric isn't currently supported for Premium and Dedicated (App Service) plans running on Linux. |
These metrics are used specifically when estimating Consumption plan costs.
General App Service metrics
Aside from function-specific metrics, the App Service platform implements more metrics, which you can use to monitor function apps. For the complete list, see metrics available to App Service apps.
Accessing metrics
You can use either Azure Monitor metrics explorer in the Azure portal or REST APIs to get Monitor Metrics data.
The following examples use Monitor Metrics to help estimate the cost of running your function app on a Consumption plan. To learn more about estimating Consumption plan costs, see Estimating Consumption plan costs.
Use Azure Monitor metrics explorer to view cost-related data for your Consumption plan function apps in a graphical format.
In the Azure portal, go to your function app.
In the left panel, scroll down to Monitoring and select Metrics.
From Metric, select Function Execution Count and Sum for Aggregation. This selection adds the sum of the execution counts during the chosen period to the chart.
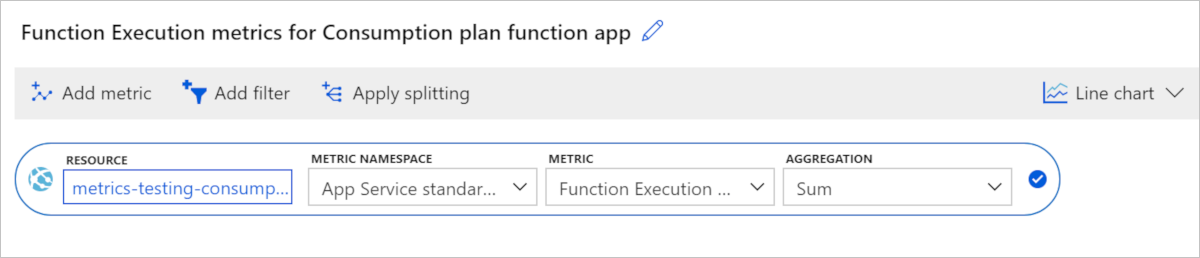
Select Add metric and repeat steps 2-4 to add Function Execution Units to the chart.
The resulting chart contains the totals for both execution metrics in the chosen time range, which in this case is two hours.
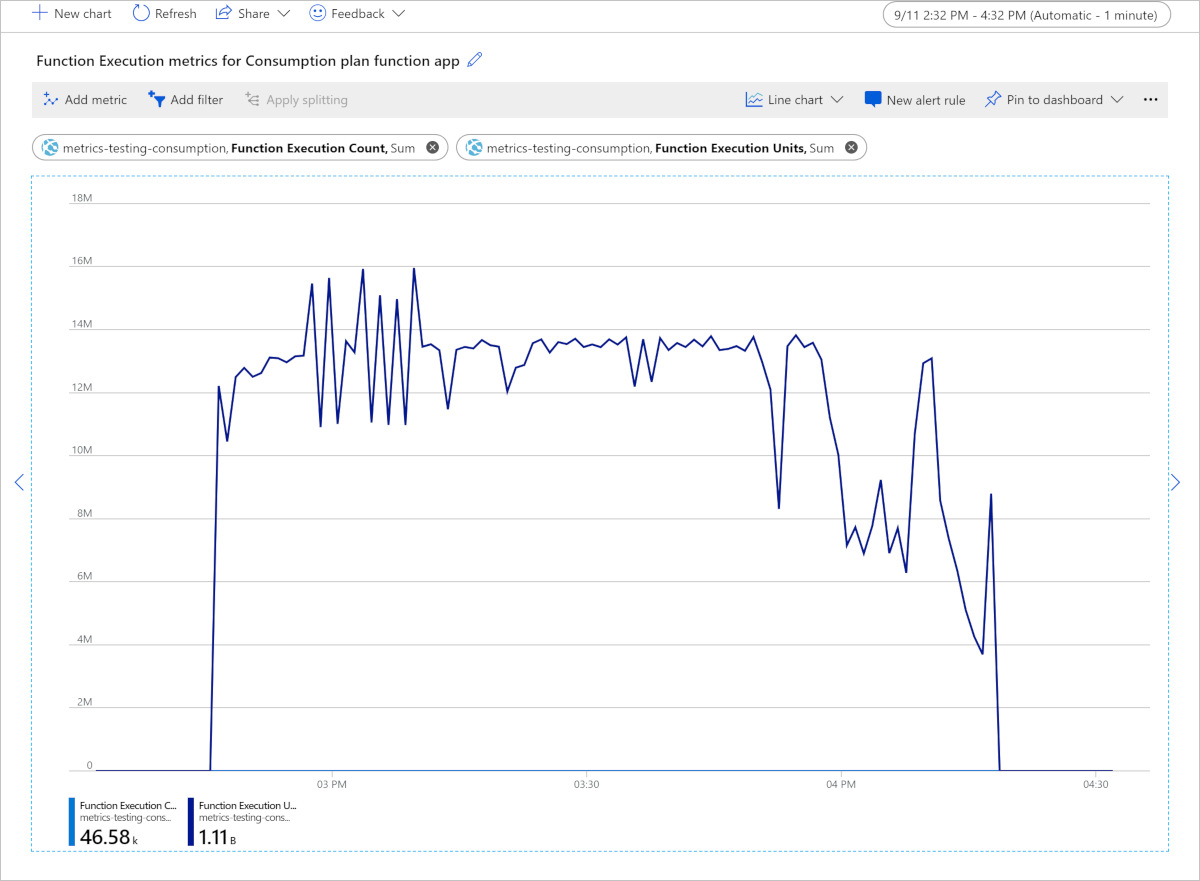
Because the number of execution units is much greater than the execution count, the chart shows only execution units.
This chart shows a total of 1.11 billion Function Execution Units consumed in a two-hour period, measured in MB-milliseconds. To convert to GB-seconds, divide by 1,024,000. In this example, the function app consumed 1,110,000,000 / 1,024,000 = 1,083.98 GB-seconds. Multiply this value by the current price of execution time on the Functions pricing page, which gives you the cost of these two hours, assuming you already used any free grants of execution time.
To learn more about using Monitor Explorer to view metrics, see Getting started with Azure Metrics Explorer.
Next steps
Learn more about monitoring Azure Functions: