Note
Access to this page requires authorization. You can try signing in or changing directories.
Access to this page requires authorization. You can try changing directories.
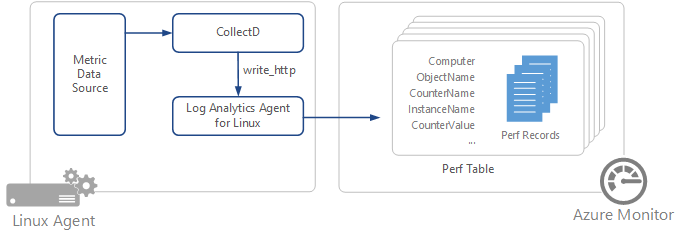
CollectD is an open source Linux daemon that periodically collects performance metrics from applications and system level information. Example applications include the Java Virtual Machine (JVM), MySQL Server, and Nginx. This article provides information on collecting performance data from CollectD in Azure Monitor using the Log Analytics agent.
Important
The legacy Log Analytics agent is deprecated as of August 31, 2024. Microsoft will no longer provide any support for the Log Analytics agent. If you use the Log Analytics agent to ingest data to Azure Monitor, migrate now to Azure Monitor agent.
A full list of available plugins can be found at Table of Plugins.
The following CollectD configuration is included in the Log Analytics agent for Linux to route CollectD data to the Log Analytics agent for Linux.
Note
As part of the ongoing transition from Microsoft Operations Management Suite to Azure Monitor, the Operations Management Suite Agent for Windows or Linux will be referred to as the Log Analytics agent for Windows and Log Analytics agent for Linux.
LoadPlugin write_http

<Plugin write_http>
    <Node "oms">
        URL "127.0.0.1:26000/oms.collectd"
        Format "JSON"
        StoreRates true
    </Node>
</Plugin>
Additionally, if using an versions of collectD before 5.5 use the following configuration instead.
LoadPlugin write_http

<Plugin write_http>
    <URL "127.0.0.1:26000/oms.collectd">
        Format "JSON"
        StoreRates true
    </URL>
</Plugin>
The CollectD configuration uses the defaultwrite_http plugin to send performance metric data over port 26000 to Log Analytics agent for Linux.
Note
This port can be configured to a custom-defined port if needed.
The Log Analytics agent for Linux also listens on port 26000 for CollectD metrics and then converts them to Azure Monitor schema metrics. The following is the Log Analytics agent for Linux configuration collectd.conf.
<source>
    type http
    port 26000
    bind 127.0.0.1
</source>

<filter oms.collectd>
    type filter_collectd
</filter>
Note
CollectD by default is set to read values at a 10-second interval. As this directly affects the volume of data sent to Azure Monitor Logs, you might need to tune this interval within the CollectD configuration to strike a good balance between the monitoring requirements and associated costs and usage for Azure Monitor Logs.
Versions supported
- Azure Monitor currently supports CollectD version 4.8 and above.
- Log Analytics agent for Linux v1.1.0-217 or above is required for CollectD metric collection.
Configuration
The following are basic steps to configure collection of CollectD data in Azure Monitor.
- Configure CollectD to send data to the Log Analytics agent for Linux using the write_http plugin.
- Configure the Log Analytics agent for Linux to listen for the CollectD data on the appropriate port.
- Restart CollectD and Log Analytics agent for Linux.
Configure CollectD to forward data
To route CollectD data to the Log Analytics agent for Linux,
oms.confneeds to be added to CollectD's configuration directory. The destination of this file depends on the Linux distro of your machine.If your CollectD config directory is located in /etc/collectd.d/:
sudo cp /etc/opt/microsoft/omsagent/sysconf/omsagent.d/oms.conf /etc/collectd.d/oms.confIf your CollectD config directory is located in /etc/collectd/collectd.conf.d/:
sudo cp /etc/opt/microsoft/omsagent/sysconf/omsagent.d/oms.conf /etc/collectd/collectd.conf.d/oms.confNote
For CollectD versions before 5.5 you will have to modify the tags in
oms.confas shown above.Copy collectd.conf to the desired workspace's omsagent configuration directory.
sudo cp /etc/opt/microsoft/omsagent/sysconf/omsagent.d/collectd.conf /etc/opt/microsoft/omsagent/<workspace id>/conf/omsagent.d/
sudo chown omsagent:omiusers /etc/opt/microsoft/omsagent/<workspace id>/conf/omsagent.d/collectd.conf
Restart CollectD and Log Analytics agent for Linux with the following commands.
sudo service collectd restart
sudo /opt/microsoft/omsagent/bin/service_control restart
CollectD metrics to Azure Monitor schema conversion
To maintain a familiar model between infrastructure metrics already collected by Log Analytics agent for Linux and the new metrics collected by CollectD the following schema mapping is used:
| CollectD Metric field | Azure Monitor field |
|---|---|
host |
Computer |
plugin |
None |
plugin_instance |
Instance Name If plugin_instance is null then InstanceName="_Total" |
type |
ObjectName |
type_instance |
CounterName If type_instance is null then CounterName=blank |
dsnames[] |
CounterName |
dstypes |
None |
values[] |
CounterValue |
Next steps
- Learn about log queries to analyze the data collected from data sources and solutions.
- Use Custom Fields to parse data from syslog records into individual fields.
