Collect Windows and Linux performance data sources with the Log Analytics agent
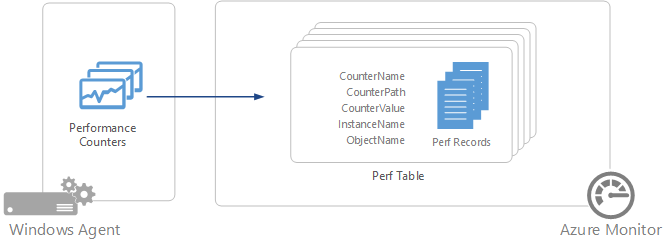
Performance counters in Windows and Linux provide insight into the performance of hardware components, operating systems, and applications. Azure Monitor can collect performance counters from Log Analytics agents at frequent intervals for near real time analysis. Azure Monitor can also aggregate performance data for longer-term analysis and reporting.
Important
The legacy Log Analytics agent is deprecated as of August 31, 2024. Azure will no longer provide any support for the Log Analytics agent. If you use the Log Analytics agent to ingest data to Azure Monitor, migrate now to Azure Monitor agent.
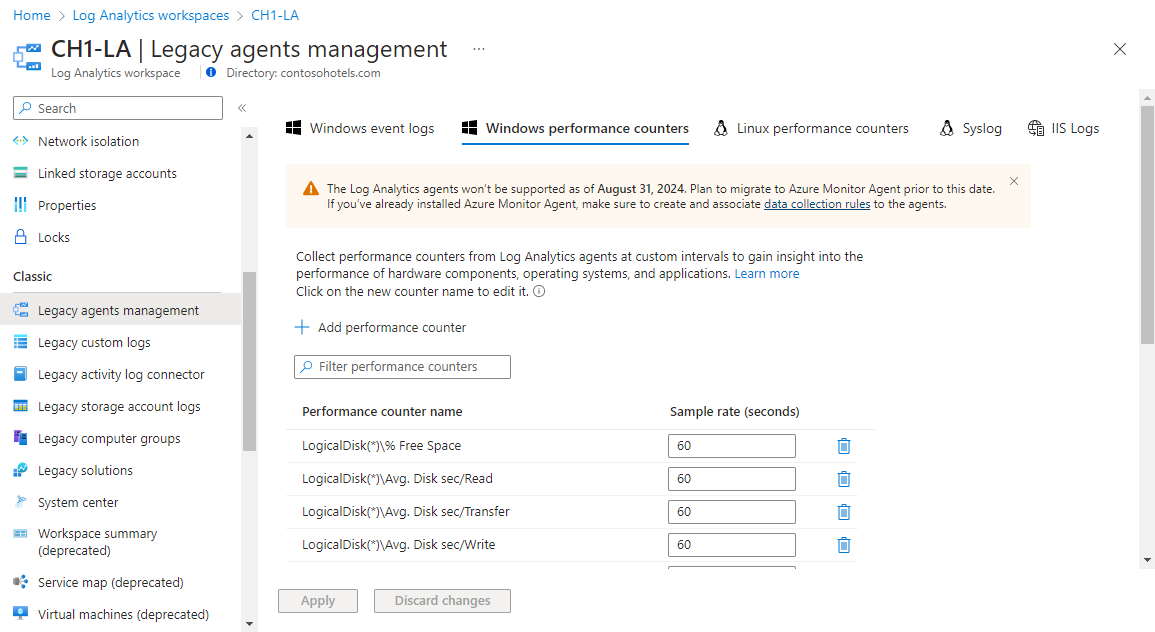
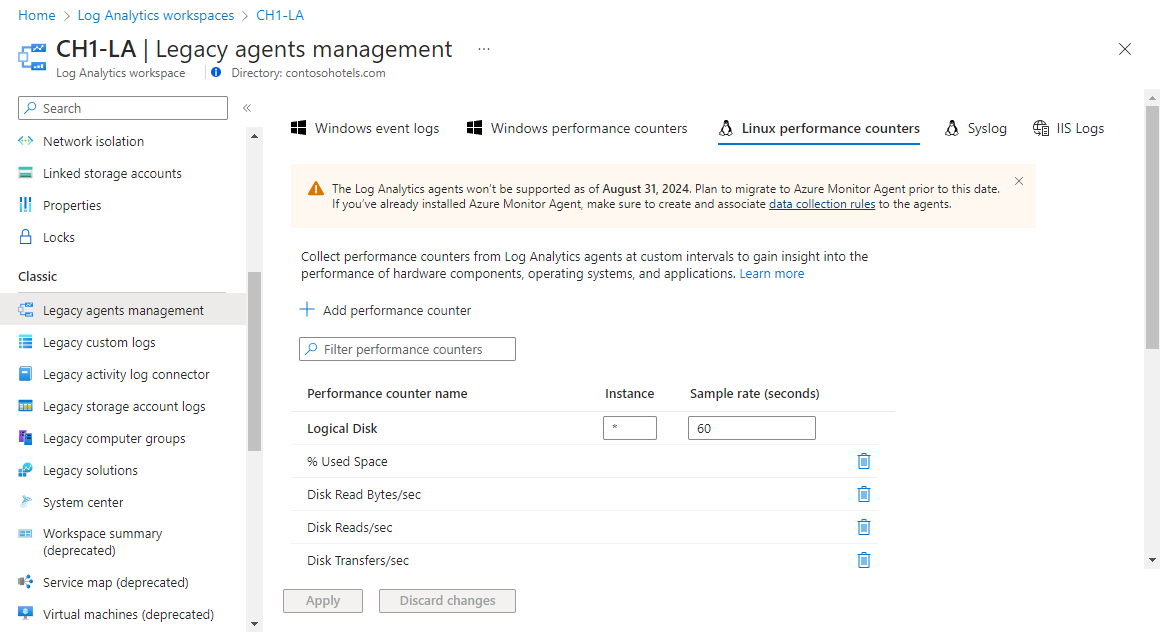
Configure performance counters from the Legacy agents management menu for the Log Analytics workspace.
When you first configure Windows or Linux performance counters for a new workspace, you're given the option to quickly create several common counters. They're listed with a checkbox next to each. Ensure that any counters you want to initially create are selected and then select Add the selected performance counters.
For Windows performance counters, you can choose a specific instance for each performance counter. For Linux performance counters, the instance of each counter that you choose applies to all child counters of the parent counter. The following table shows the common instances available to both Windows and Linux performance counters.
| Instance name | Description |
|---|---|
| _Total | Total of all the instances |
| * | All instances |
| (/|/var) | Matches instances named / or /var |
Follow this procedure to add a new Windows performance counter to collect. V2 Windows performance counters aren't supported.
Select Add performance counter.
Enter the name of the counter in the text box in the format object(instance)\counter. When you start typing, a matching list of common counters appears. You can either select a counter from the list or enter one of your own. You can also return all instances for a particular counter by specifying object\counter.
When SQL Server performance counters are collected from named instances, all named instance counters start with MSSQL$ followed by the name of the instance. For example, to collect the Log Cache Hit Ratio counter for all databases from the Database performance object for named SQL instance INST2, specify
MSSQL$INST2:Databases(*)\Log Cache Hit Ratio.When you add a counter, it uses the default of 60 seconds for its Sample rate. Change this default value to a higher value of up to 1,800 seconds (30 minutes) if you want to reduce the storage requirements of the collected performance data.
After you're finished adding counters, select Apply at the top of the screen to save the configuration.
Follow this procedure to add a new Linux performance counter to collect.
- Select Add performance counter.
- Enter the name of the counter in the text box in the format object(instance)\counter. When you start typing, a matching list of common counters appears. You can either select a counter from the list or enter one of your own.
- All counters for an object use the same Sample rate. The default is 60 seconds. Change this default value to a higher value of up to 1,800 seconds (30 minutes) if you want to reduce the storage requirements of the collected performance data.
- After you're finished adding counters, select Apply at the top of the screen to save the configuration.
Instead of configuring Linux performance counters by using the Azure portal, you have the option of editing configuration files on the Linux agent. Performance metrics to collect are controlled by the configuration in /etc/opt/microsoft/omsagent/<workspace id>/conf/omsagent.conf.
Each object, or category, of performance metrics to collect should be defined in the configuration file as a single <source> element. The syntax follows the pattern here:
<source>
    type oms_omi
    object_name "Processor"
    instance_regex ".*"
    counter_name_regex ".*"
    interval 30s
</source>
The parameters in this element are described in the following table.
| Parameters | Description |
|---|---|
| object_name | Object name for the collection. |
| instance_regex | A regular expression that defines which instances to collect. The value .* specifies all instances. To collect processor metrics for only the _Total instance, you could specify _Total. To collect process metrics for only the crond or sshd instances, you could specify (crond\|sshd). |
| counter_name_regex | A regular expression that defines which counters (for the object) to collect. To collect all counters for the object, specify .*. To collect only swap space counters for the memory object, for example, you could specify .+Swap.+ |
| interval | Frequency at which the object's counters are collected. |
The following table lists the objects and counters that you can specify in the configuration file. More counters are available for certain applications. For more information, see Collect performance counters for Linux applications in Azure Monitor.
| Object name | Counter name |
|---|---|
| Logical Disk | % Free Inodes |
| Logical Disk | % Free Space |
| Logical Disk | % Used Inodes |
| Logical Disk | % Used Space |
| Logical Disk | Disk Read Bytes/sec |
| Logical Disk | Disk Reads/sec |
| Logical Disk | Disk Transfers/sec |
| Logical Disk | Disk Write Bytes/sec |
| Logical Disk | Disk Writes/sec |
| Logical Disk | Free Megabytes |
| Logical Disk | Logical Disk Bytes/sec |
| Memory | % Available Memory |
| Memory | % Available Swap Space |
| Memory | % Used Memory |
| Memory | % Used Swap Space |
| Memory | Available MBytes Memory |
| Memory | Available MBytes Swap |
| Memory | Page Reads/sec |
| Memory | Page Writes/sec |
| Memory | Pages/sec |
| Memory | Used MBytes Swap Space |
| Memory | Used Memory MBytes |
| Network | Total Bytes Transmitted |
| Network | Total Bytes Received |
| Network | Total Bytes |
| Network | Total Packets Transmitted |
| Network | Total Packets Received |
| Network | Total Rx Errors |
| Network | Total Tx Errors |
| Network | Total Collisions |
| Physical Disk | Avg. Disk sec/Read |
| Physical Disk | Avg. Disk sec/Transfer |
| Physical Disk | Avg. Disk sec/Write |
| Physical Disk | Physical Disk Bytes/sec |
| Process | Pct Privileged Time |
| Process | Pct User Time |
| Process | Used Memory kBytes |
| Process | Virtual Shared Memory |
| Processor | % DPC Time |
| Processor | % Idle Time |
| Processor | % Interrupt Time |
| Processor | % IO Wait Time |
| Processor | % Nice Time |
| Processor | % Privileged Time |
| Processor | % Processor Time |
| Processor | % User Time |
| System | Free Physical Memory |
| System | Free Space in Paging Files |
| System | Free Virtual Memory |
| System | Processes |
| System | Size Stored In Paging Files |
| System | Uptime |
| System | Users |
The following configuration is the default for performance metrics:
<source>
    type oms_omi
	object_name "Physical Disk"
	instance_regex ".*"
	counter_name_regex ".*"
	interval 5m
</source>

<source>
	type oms_omi
	object_name "Logical Disk"
	instance_regex ".*"
	counter_name_regex ".*"
	interval 5m
</source>

<source>
    type oms_omi
	object_name "Processor"
	instance_regex ".*"
	counter_name_regex ".*"
	interval 30s
</source>

<source>
	type oms_omi
	object_name "Memory"
	instance_regex ".*"
	counter_name_regex ".*"
	interval 30s
</source>
Azure Monitor collects all specified performance counters at their specified sample interval on all agents that have that counter installed. The data isn't aggregated. The raw data is available in all log query views for the duration specified by your Log Analytics workspace.
Performance records have a type of Perf and have the properties listed in the following table.
| Property | Description |
|---|---|
| Computer | Computer that the event was collected from. |
| CounterName | Name of the performance counter. |
| CounterPath | Full path of the counter in the form \\<Computer>\object(instance)\counter. |
| CounterValue | Numeric value of the counter. |
| InstanceName | Name of the event instance. Empty if no instance. |
| ObjectName | Name of the performance object. |
| SourceSystem | Type of agent the data was collected from: OpsManager - Windows agent, either direct connect or SCOM Linux - All Linux agents AzureStorage - Azure Diagnostics |
| TimeGenerated | Date and time the data was sampled. |
A rough estimate for collection of a particular counter at 10-second intervals is about 1 MB per day per instance. You can estimate the storage requirements of a particular counter with the following formula:
1 MB x (number of counters) x (number of agents) x (number of instances)
The following table provides different examples of log queries that retrieve performance records.
| Query | Description |
|---|---|
| Perf | All performance data |
| Perf | where Computer == "MyComputer" | All performance data from a particular computer |
| Perf | where CounterName == "Current Disk Queue Length" | All performance data for a particular counter |
| Perf | where ObjectName == "Processor" and CounterName == "% Processor Time" and InstanceName == "_Total" | summarize AVGCPU = avg(CounterValue) by Computer | Average CPU utilization across all computers |
| Perf | where CounterName == "% Processor Time" | summarize AggregatedValue = max(CounterValue) by Computer | Maximum CPU utilization across all computers |
| Perf | where ObjectName == "LogicalDisk" and CounterName == "Current Disk Queue Length" and Computer == "MyComputerName" | summarize AggregatedValue = avg(CounterValue) by InstanceName | Average current disk queue length across all the instances of a given computer |
| Perf | where CounterName == "Disk Transfers/sec" | summarize AggregatedValue = percentile(CounterValue, 95) by Computer | 95th percentile of disk transfers/sec across all computers |
| Perf | where CounterName == "% Processor Time" and InstanceName == "_Total" | summarize AggregatedValue = avg(CounterValue) by bin(TimeGenerated, 1h), Computer | Hourly average of CPU usage across all computers |
| Perf | where Computer == "MyComputer" and CounterName startswith_cs "%" and InstanceName == "_Total" | summarize AggregatedValue = percentile(CounterValue, 70) by bin(TimeGenerated, 1h), CounterName | Hourly 70th percentile of every percent counter for a particular computer |
| Perf | where CounterName == "% Processor Time" and InstanceName == "_Total" and Computer == "MyComputer" | summarize ["min(CounterValue)"] = min(CounterValue), ["avg(CounterValue)"] = avg(CounterValue), ["percentile75(CounterValue)"] = percentile(CounterValue, 75), ["max(CounterValue)"] = max(CounterValue) by bin(TimeGenerated, 1h), Computer | Hourly average, minimum, maximum, and 75-percentile CPU usage for a specific computer |
| Perf | where ObjectName == "MSSQL$INST2:Databases" and InstanceName == "master" | All performance data from the database performance object for the master database from the named SQL Server instance INST2 |
- Collect performance counters from Linux applications, including MySQL and Apache HTTP Server.
- Learn about log queries to analyze the data collected from data sources and solutions.
- Export collected data to Power BI for more visualizations and analysis.


