Note
Access to this page requires authorization. You can try signing in or changing directories.
Access to this page requires authorization. You can try changing directories.
This article shows you how to create a new metric alert rule or edit an existing metric alert rule. To learn more about alerts, see the alerts overview.
You create an alert rule by combining the resources to monitor, the monitoring data from the resource, and the conditions that you want to trigger the alert. You can then define action groups and alert processing rules to determine what happens when an alert is triggered.
You can define what payload is included in alerts triggered by these alert rules. They can contain a payload that uses the common alert schema, or less-recommended individualized schemas per alert type.
Prerequisites
Before creating a metric alert rule, ensure you have the following permissions:
- Read permission (such as Reader) on the target resource of the alert rule.
- Read permission on any action group associated to the alert rule, if applicable.
- Write permission (such as Contributor) on the resource group in which you create the alert rule. If you're creating the alert rule from the Azure portal, you create the alert rule by default in the same resource group in which the target resource resides.
Manage these permissions through Azure Role-Based Access Control (RBAC). For more information, see Roles, permissions, and security in Azure Monitor and Assign Azure roles using the Azure portal.
Note
It can take 10 to 15 minutes after you create the resource for a metric to be available.
Create or edit an alert rule from the portal home page
Follow these steps:
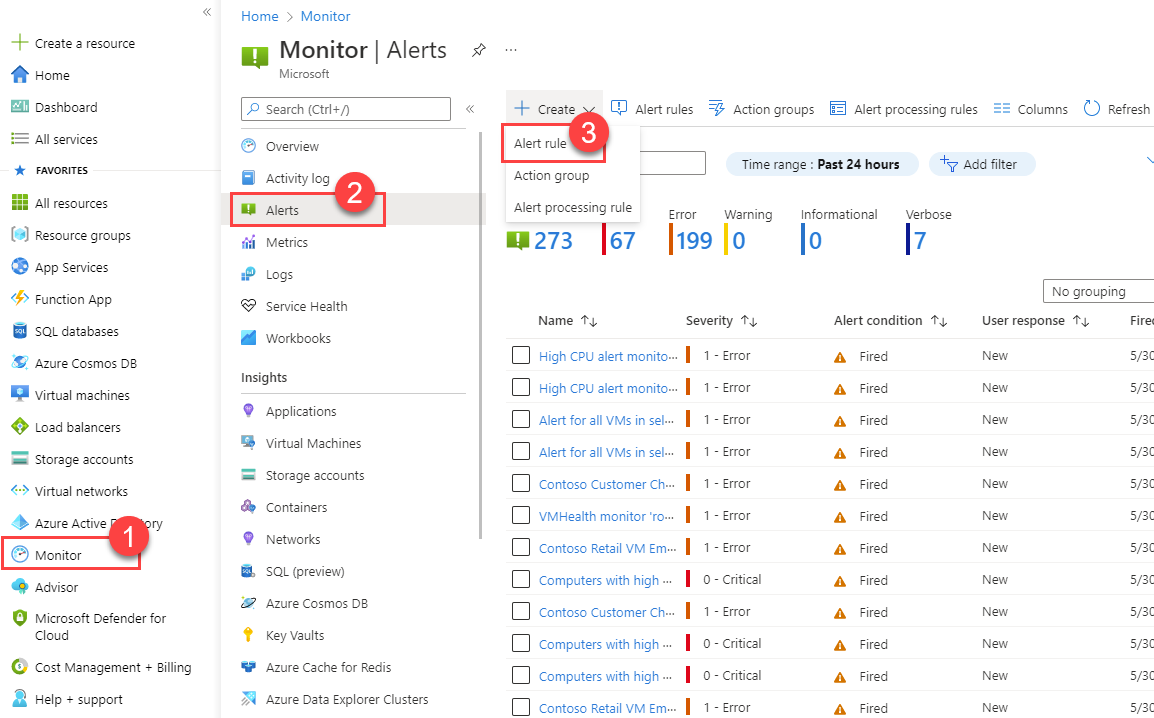
In the Azure portal, select Monitor > Alerts.
Open the + Create menu, and select Alert rule.
Create or edit an alert rule from a specific resource
Follow these steps:
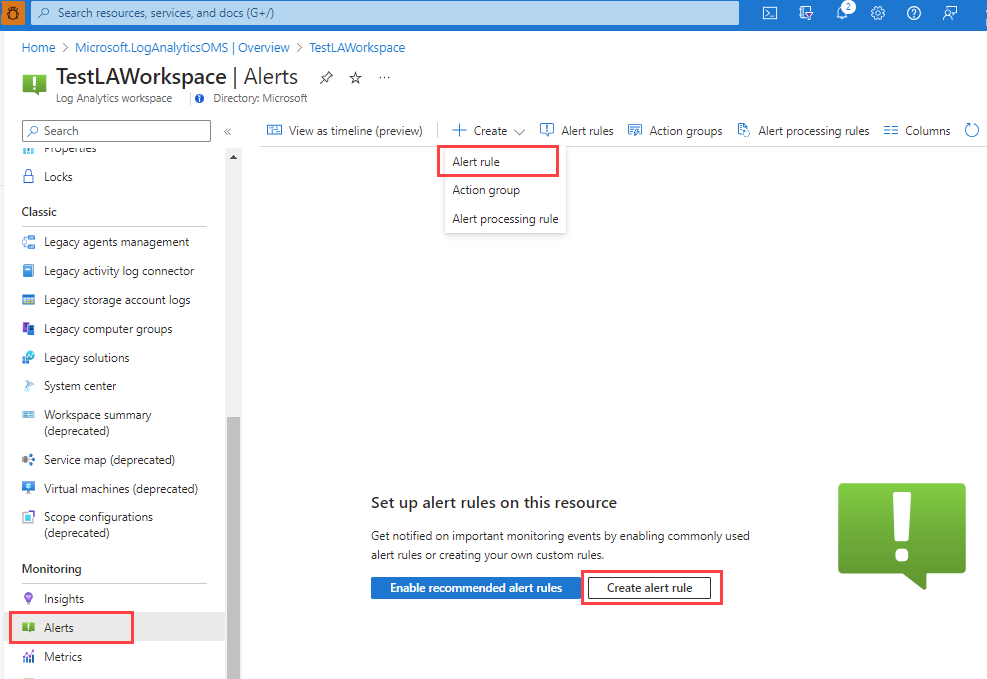
In the Azure portal, go to the resource.
Select Alerts from the left pane, and then select + Create > Alert rule.
The scope of the alert rule is set to the resource you selected. Continue with setting the conditions for the alert rule.
Edit an existing alert rule
Follow these steps:
In the Azure portal, select Alerts from the left pane, either from the home page or from a specific resource.
Select Alert rules.
Select the alert rule you want to edit, and then select Edit.
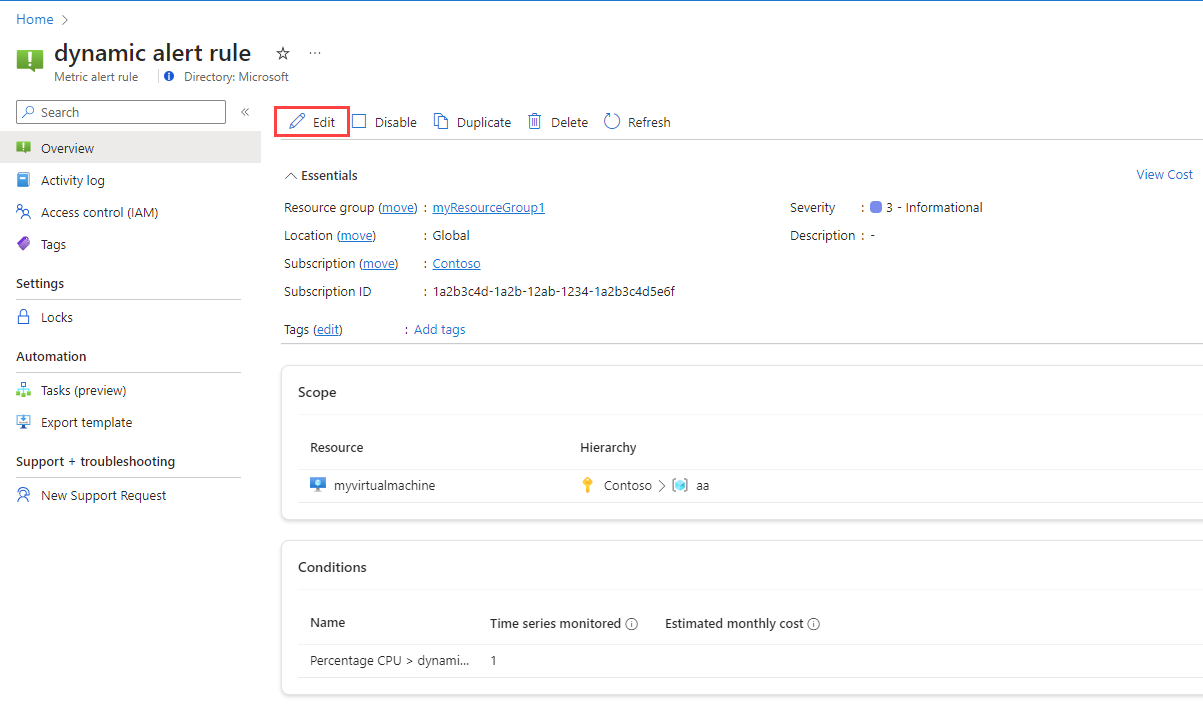
Select any of the tabs for the alert rule to edit the settings.
Configure the scope of the alert rule
Follow these steps:
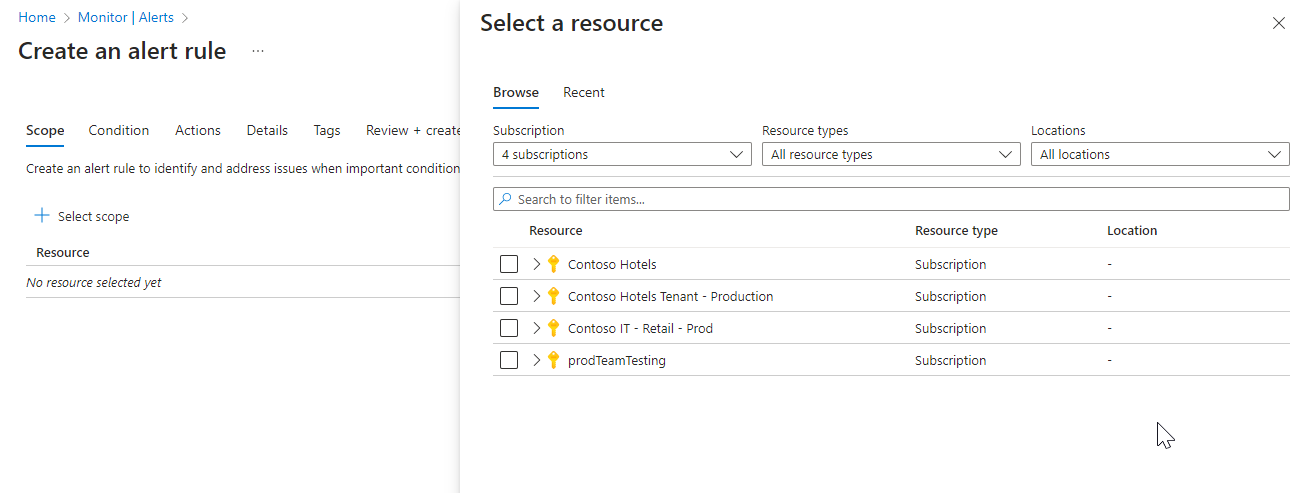
On Select a resource, set the scope for your alert rule. Filter by subscription, resource type, or resource location.
Select Apply.
Configure the alert rule conditions
Follow these steps:
On the Condition tab, when you select the Signal name field, the most commonly used signals appear in the drop-down list. Select one of these popular signals, or select See all signals if you want to choose a different signal for the condition.
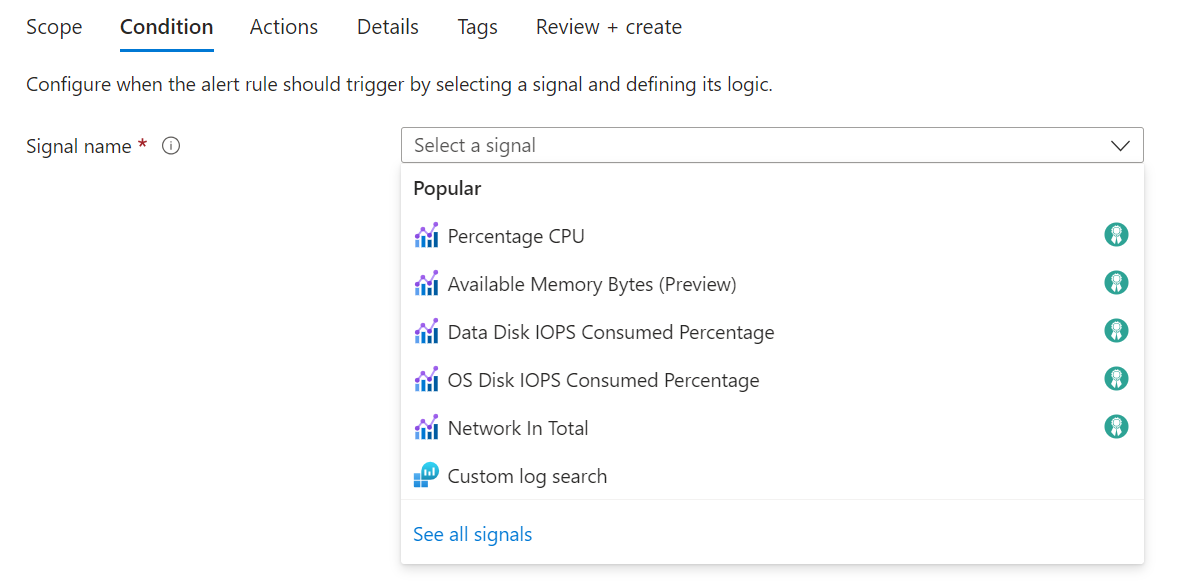
(Optional) If you chose See all signals in the previous step, use the Select a signal pane to search for the signal name or filter the list of signals. Filter by:
- Signal type: The type of alert rule you're creating.
- Signal source: The service sending the signal.
This table describes the services available for metric alert rules:
Signal source Description Platform For metric signals, the monitor service is the metric namespace. "Platform" means the metrics are provided by the resource provider, namely, Azure. Azure.ApplicationInsights Customer-reported metrics, sent by the Application Insights SDK. Azure.VM.Windows.GuestMetrics VM guest metrics, collected by an extension running on the VM. Can include built-in operating system perf counters and custom perf counters. <your custom namespace> A custom metric namespace, containing custom metrics sent with the Azure Monitor Metrics API. Select the Signal name and Apply.
Preview the results of the selected metric signal in the Preview section. Select values for the following fields.
Field Description Time range The time range to include in the results. Can be from the last six hours to the last week. Time series The time series to include in the results. In the Alert logic section:
Field Description Threshold Select if the threshold should be evaluated based on a static value or a dynamic value.
A static threshold evaluates the rule by using the threshold value that you configure.
Dynamic thresholds use machine learning algorithms to continuously learn the metric behavior patterns and calculate the appropriate thresholds for unexpected behavior. Learn more about using dynamic thresholds.Operator Select the operator for comparing the metric value against the threshold.
If you're using dynamic thresholds, alert rules can use tailored thresholds based on metric behavior for both upper and lower bounds in the same alert rule. Select one of these operators:
• Greater than the upper threshold or lower than the lower threshold (default)
• Greater than the upper threshold
• Lower than the lower thresholdAggregation type Select the aggregation function to apply on the data points: Sum, Count, Average, Min, or Max. Threshold value If you selected a static threshold, enter the threshold value for the condition logic. Unit If the selected metric signal supports different units, such as bytes, KB, MB, and GB, and if you selected a static threshold, enter the unit for the condition logic. Threshold sensitivity If you selected a dynamic threshold, enter the sensitivity level. The sensitivity level affects the amount of deviation from the metric series pattern that's required to trigger an alert.
• High: Thresholds are tight and close to the metric series pattern. An alert rule is triggered on the smallest deviation, resulting in more alerts.
• Medium: Thresholds are less tight and more balanced. There are fewer alerts than with high sensitivity (default).
• Low: Thresholds are loose, allowing greater deviation from the metric series pattern. Alert rules are only triggered on large deviations, resulting in fewer alerts.(Optional) You can configure splitting by dimensions.
Dimensions are name-value pairs that contain more data about the metric value. By using dimensions, you can filter the metrics and monitor specific time-series, instead of monitoring the aggregate of all the dimensional values.
If you select more than one dimension value, each time series that results from the combination triggers its own alert and is charged separately. For example, the transactions metric of a storage account can have an API name dimension that contains the name of the API called by each transaction (for example, GetBlob, DeleteBlob, and PutPage). You can choose to have an alert fired when there's a high number of transactions in a specific API (the aggregated data). Or you can use dimensions to alert only when the number of transactions is high for specific APIs.
Field Description Dimension name Dimensions can be either number or string columns. Dimensions are used to monitor specific time series and provide context to a fired alert.
Splitting on the Azure Resource ID column makes the specified resource into the alert target. If detected, the ResourceID column is selected automatically and changes the context of the fired alert to the record's resource.Operator The operator used on the dimension name and value. Dimension values The dimension values are based on data from the last 48 hours. Select Add custom value to add custom dimension values. Include all future values Select this field to include any future values added to the selected dimension. In the When to evaluate section:
Field Description Check every Select how often the alert rule checks if the condition is met. Lookback period Select how far back to look each time the data is checked. For example, every 1 minute, look back 5 minutes. (Optional) If you're using dynamic thresholds, in the Advanced options section, specify how many failures within a specific time period trigger an alert. For example, you can specify that you only want to trigger an alert if there were three failures in the last hour. Your application business policy should determine this setting.
Select values for these fields:
Field Description Number of violations The number of violations within the configured time frame that trigger the alert. Evaluation period The time period in which the number of violations occurs. Ignore data before Use this setting to select the date from which to start using the metric historical data for calculating the dynamic thresholds. For example, if a resource was running in testing mode and is moved to production, you might want to disregard the metric behavior while the resource was in testing. Select Done. After you configure the alert rule conditions, you can configure the alert rule details to complete creation of the alert. Optionally, you can also add actions and tags to the alert rule.
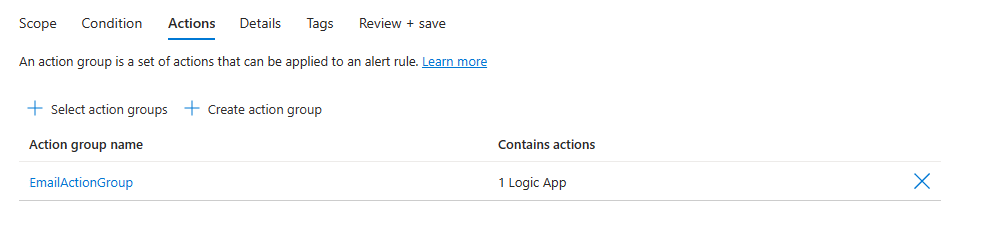
Configure the alert rule actions
(Optional) Follow these steps to add actions to your alert rule:
Select the Actions tab.
Select or create the required action groups.
Configure the alert rule details
Follow these steps:
On the Details tab, define the Project details.
- Select the Subscription.
- Select the Resource group.
Define the Alert rule details.
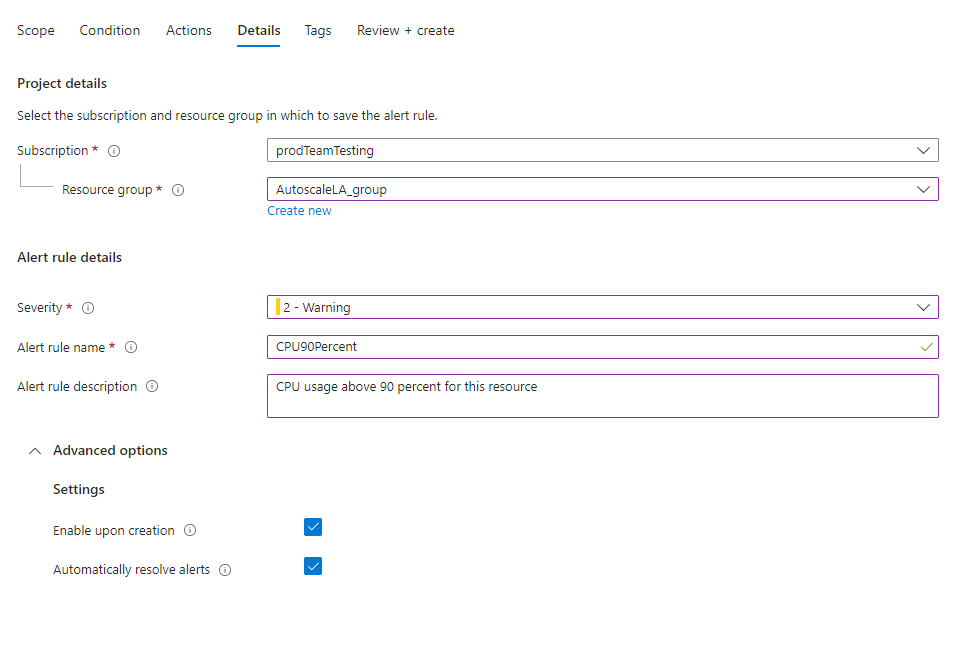
Select the Severity.
Enter values for the Alert rule name and the Alert rule description.
(Optional) In the Advanced options section, set several options.
Field Description Enable upon creation Select for the alert rule to start running as soon as you're done creating it. Automatically resolve alerts Select to make the alert stateful. When an alert is stateful, the alert is resolved when the condition is no longer met.
If you don't select this checkbox, metric alerts are stateless. Stateless alerts fire each time the condition is met, even if alert already fired.
The frequency of notifications for stateless metric alerts differs based on the alert rule's configured frequency:
Alert frequency of less than 5 minutes: While the condition continues to be met, a notification is sent somewhere between one and six minutes.
Alert frequency of more than 5 minutes: While the condition continues to be met, a notification is sent between the configured frequency and doubles the value of the frequency. For example, for an alert rule with a frequency of 15 minutes, a notification is sent somewhere between 15 to 30 minutes.-
(Optional) In the Custom properties section, if this alert rule contains action groups, you can add your own properties to include in the alert notification payload. You can use these properties in the actions that the action group calls, such as by a webhook, Azure function, or logic app action.
The custom properties are specified as key/value pairs by using static text, a dynamic value extracted from the alert payload, or a combination of both.
The format for extracting a dynamic value from the alert payload is:
${<path to schema field>}. For example:${data.essentials.monitorCondition}.Use the format of the common alert schema to specify the field in the payload, whether or not the action groups configured for the alert rule use the common schema.
Note
Add custom properties to the JSON payload that's sent to webhook, Logic Apps, Azure Functions, and Automation runbook actions. They aren't included in email, SMS, or push notifications, and they don't appear in the alert details page in the Azure portal.
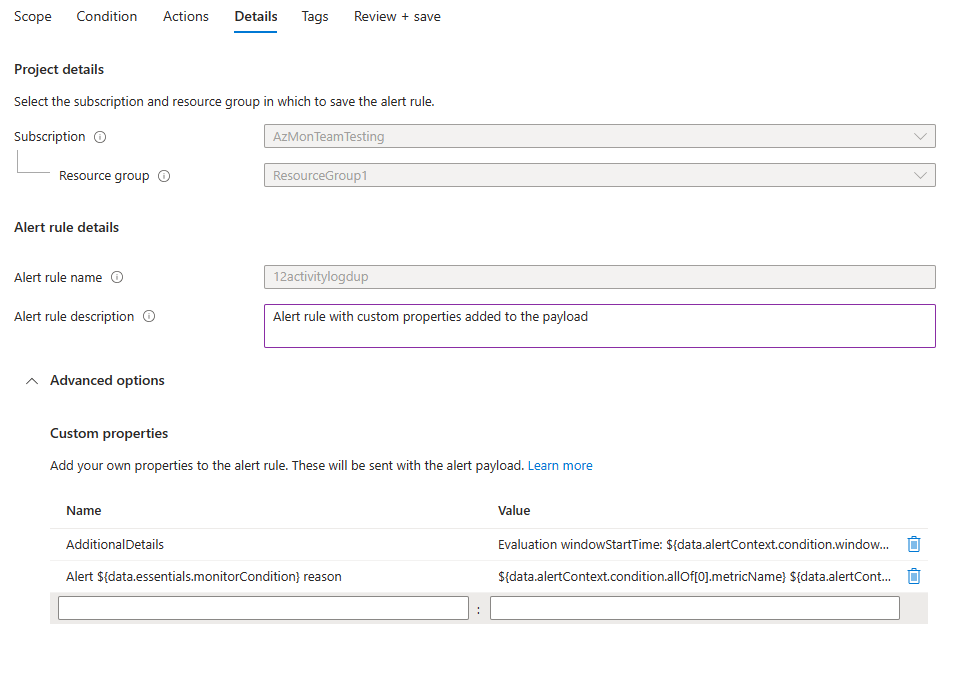
The following examples use values in Custom properties to utilize data from a payload that uses the common alert schema.
This example creates an Additional Details tag with data regarding the window start time and window end time:
- Name:
Additional Details - Value:
Evaluation windowStartTime: ${data.alertContext.condition.windowStartTime}. windowEndTime: ${data.alertContext.condition.windowEndTime} - Result:
AdditionalDetails:Evaluation windowStartTime: 2023-04-04T14:39:24.492Z. windowEndTime: 2023-04-04T14:44:24.492Z
This example adds data regarding the reason for resolving or firing the alert:
- Name:
Alert ${data.essentials.monitorCondition} reason - Value:
${data.alertContext.condition.allOf[0].metricName} ${data.alertContext.condition.allOf[0].operator} ${data.alertContext.condition.allOf[0].threshold} ${data.essentials.monitorCondition}. The value is ${data.alertContext.condition.allOf[0].metricValue} - Potential results:
Alert Resolved reason: Percentage CPU GreaterThan5 Resolved. The value is 3.585Alert Fired reason": "Percentage CPU GreaterThan5 Fired. The value is 10.585
- Name:
When you finish configuring the scope, conditions, and details, select Review + create.
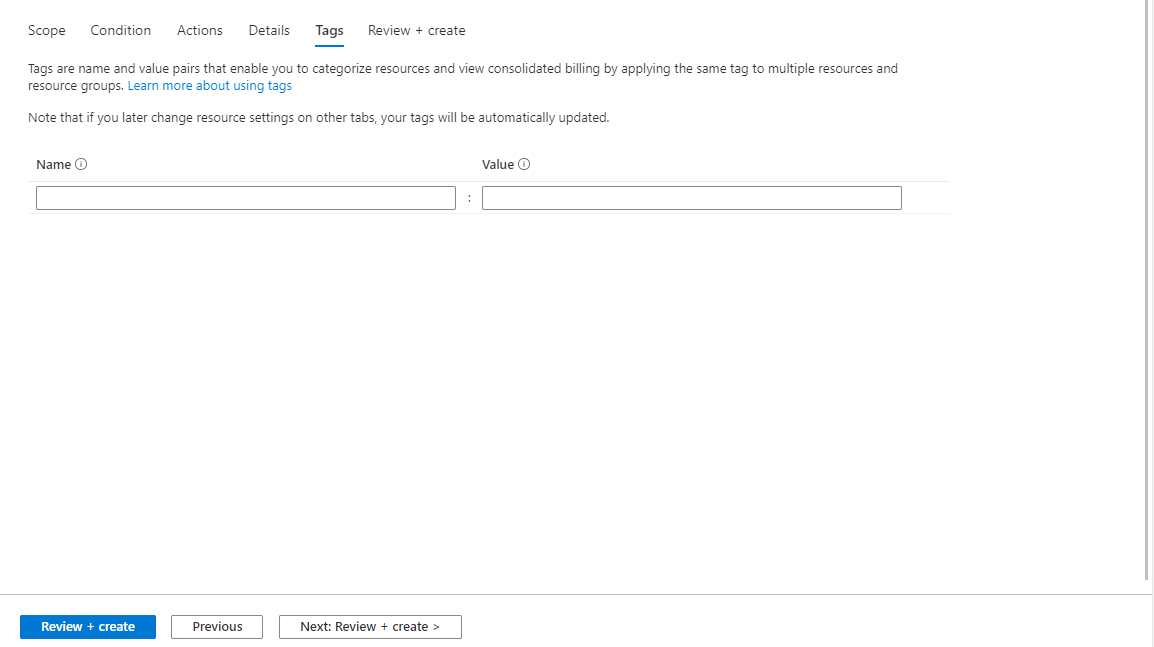
Configure alert rule tags
(Optional) Follow these steps to add tags to your alert rule:
Select the Tags tab.
Set any required tags on the alert rule resource.
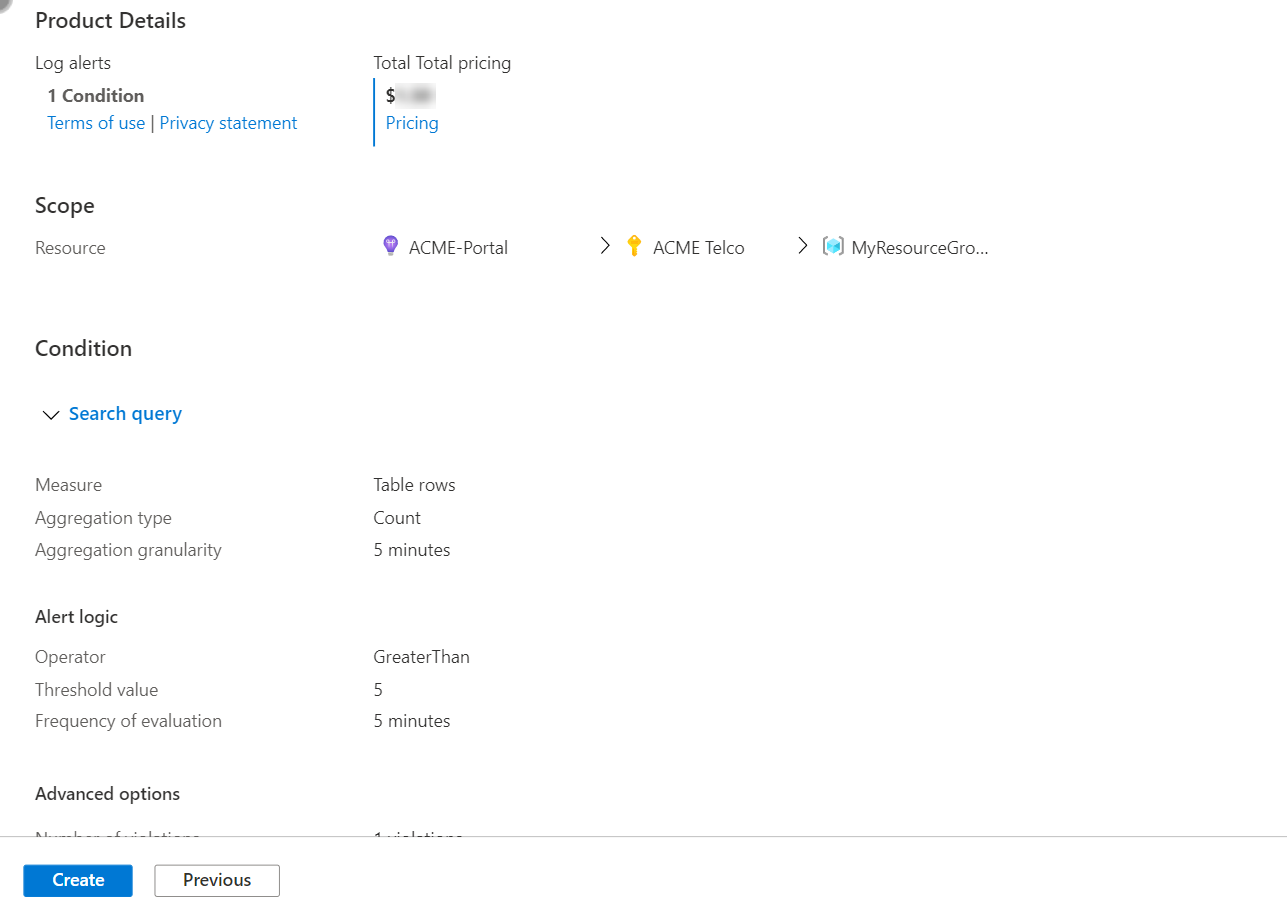
Review and create the alert rule
Follow these steps:
On the Review + create tab, the rule is validated, and you see any problems.
When validation passes and you review the settings, select Create.
Naming restrictions for metric alert rules
Consider the following restrictions for metric alert rule names:
- You can't change (rename) metric alert rule names after you create them.
- Metric alert rule names must be unique within a resource group.
- Metric alert rule names can't contain the following characters: * # & + : < > ? @ % { } \ /
- Metric alert rule names can't end with a space or a period.
- The combined resource group name and alert rule name can't exceed 252 characters.
Note
If the alert rule name contains characters that aren't alphabetic or numeric, certain clients might URL-encode these characters when retrieving the name. Examples include spaces, punctuation marks, and symbols.
Restrictions when you use dimensions in a metric alert rule with multiple conditions
Metric alerts support alerting on multidimensional metrics and support defining multiple conditions, up to five conditions per alert rule.
Consider the following constraints when you use dimensions in an alert rule that contains multiple conditions:
You can only select one value per dimension within each condition.
You can't use the Select all current and future values option (the asterisk *). You must specify each dimension value explicitly.
You can't use dynamic thresholds in alert rules that monitor multiple conditions.
When metrics that are configured in different conditions support the same dimension, you must explicitly set a configured dimension value in the same way for all those metrics in the relevant conditions.
For example:
Consider a metric alert rule that's defined on a storage account and monitors two conditions:
- Total Transactions > 5
- Average SuccessE2ELatency > 250 ms
You want to update the first condition and only monitor transactions where the ApiName dimension equals
"GetBlob".Because both the Transactions and SuccessE2ELatency metrics support an ApiName dimension, you need to update both conditions, and have them specify the ApiName dimension with a
"GetBlob"value.