Note
Access to this page requires authorization. You can try signing in or changing directories.
Access to this page requires authorization. You can try changing directories.
This article shows you how to create a new simple log alert rule or edit an existing simple log alert rule in Azure Monitor. To learn more about alerts, see the alerts overview.
Note
Simple log alert rules support querying either Analytics or Basic logs table plan.
Alert rules
Alert rules combine the resources to be monitored, the monitoring data from the resource, and the conditions that you want to trigger the alert. You can then define action groups and alert processing rules to determine what happens when an alert is triggered.
Alerts triggered by these alert rules contain a payload that uses the common alert schema.
Prerequisites
To create or edit an alert rule, you must have the following permissions:
- Read permission on the target resource of the alert rule.
- Write permission on the resource group in which the alert rule is created. If you're creating the alert rule from the Azure portal, the alert rule is created by default in the same resource group in which the target resource resides.
- Read permission on any action group associated to the alert rule, if applicable.
Access the alert rule wizard in the Azure portal
There are multiple ways to create or edit an alert rule.
Create or edit an alert rule from the portal home page
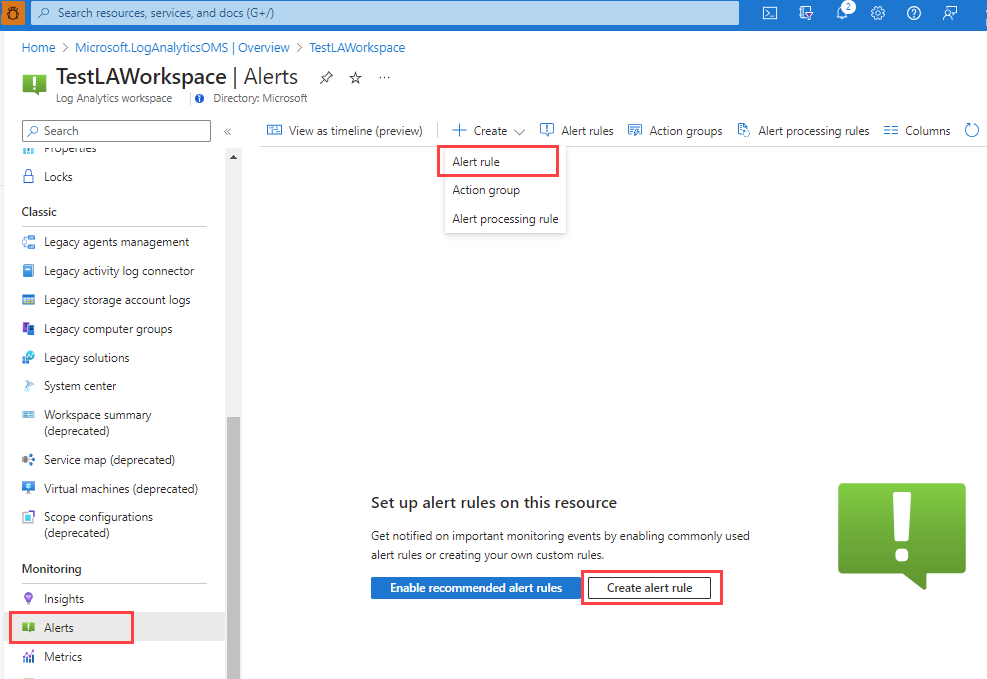
- In the Azure portal, select Monitor.
- On the left pane, select Alerts.
- Select + Create > Alert rule.
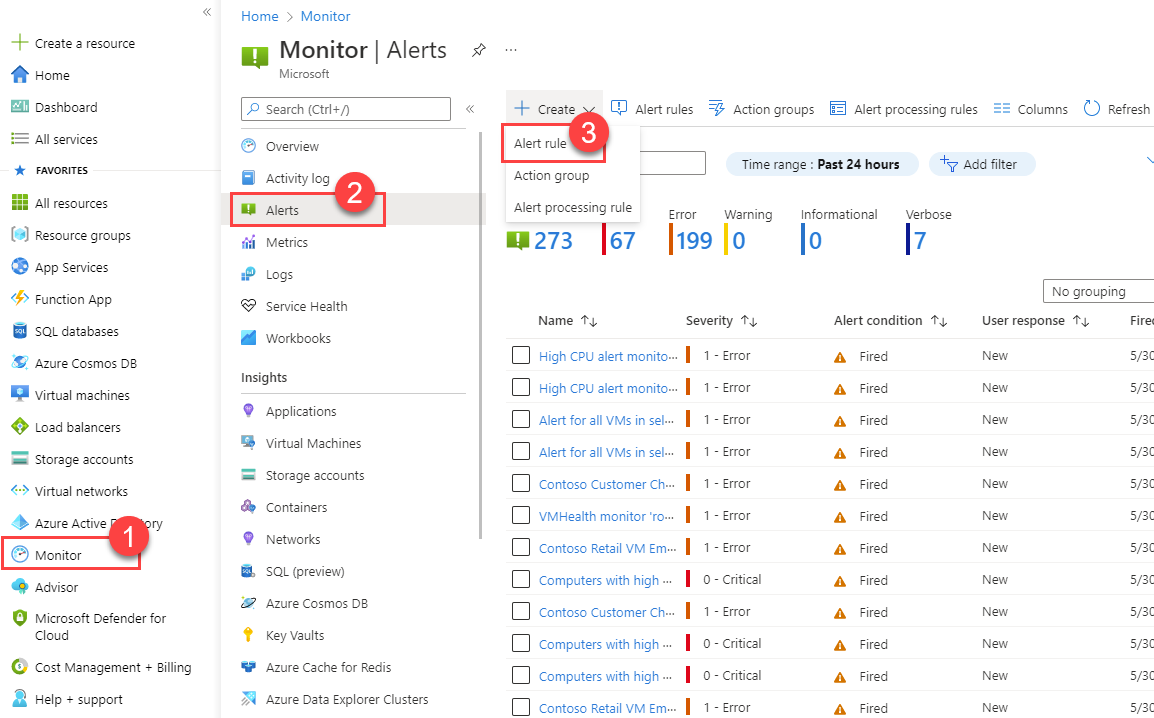
Create or edit an alert rule from a specific resource
- In the Azure portal, go to the resource.
- On the left pane, select Alerts.
- Select + Create > Alert rule.
- The scope of the alert rule is set to the resource you selected. Continue with setting the conditions for the alert rule.
Configure the simple log search alert rule conditions
Note
Simple log alert rules don't support splitting by dimensions or mute actions.
Select the Condition tab.
Select Custom log search for the Signal name field. Alternatively, select See all signals if you want to choose a different signal for the condition.
(Optional) If you selected See all signals in the previous step, use the Select a signal pane to search for the signal name or filter the list of signals. Filter by:
- Signal type: Select Log search.
- Signal source: The service that sends the Custom log search and Log (saved query) signals. Select the signal name, and then select Apply.
- Query type: Select Aggregated logs.
To create a simple log alerts:
- Close the Log pane.
- Select Single event in the query type radio button.
- On the Logs pane, write a query that returns the log events you want to create an alert. Notice the simple log alert is based on a simple KQL query that is based on Transformation KQL language.
Note
Simple log alert rule queries don't support print, datatable, and let.
Select Run to run the alert.
The Preview section shows you the query results. When you finish editing your query, select Continue Editing Alert.
The Condition tab opens and is populated with your log query. By default, the rule counts the number of results in the last five minutes. If the system detects summarized query results, the rule is automatically updated with that information.
Optional: in the When to trigger the alert section you can define the number of rows that should match to trigger an alert for a certain minute. For example:
- Alert per every row that matches the query
- When the condition is met at least once in the minute - one row matches
- When the condition is met at least twice in the minute - two rows match
- When the condition is met at least three times in the minute - three rows match
- Custom definition of how many rows need to match to have an alert on a certain minute
Show different output columns
In the output, the number of rows that are shown in the email or in the alert consumption is limited. The first five columns of the query are displayed in the output. Therefore, if you would like to show different columns, change the order of the columns in the KQL query that is in the log pane.
Remaining steps
The remaining steps are the same as log search.