Profile web apps running on an Azure virtual machine or a virtual machine scale set by using Application Insights Profiler
Note
We recommend that you use the Azure Az PowerShell module to interact with Azure. See Install Azure PowerShell to get started. To learn how to migrate to the Az PowerShell module, see Migrate Azure PowerShell from AzureRM to Az.
You can also deploy Azure Application Insights Profiler on these services:
Deploy Profiler on a virtual machine or a virtual machine scale set
This article shows you how to get Application Insights Profiler running on your Azure virtual machine (VM) or Azure virtual machine scale set. Profiler is installed with the Azure Diagnostics extension for VMs. Configure the extension to run Profiler, and build the Application Insights SDK into your application.
Add the Application Insights SDK to your ASP.NET application.
To view profiles for your requests, you must send request telemetry to Application Insights.
Install Azure Diagnostics extension on your VM. For full Resource Manager template examples, see:
-
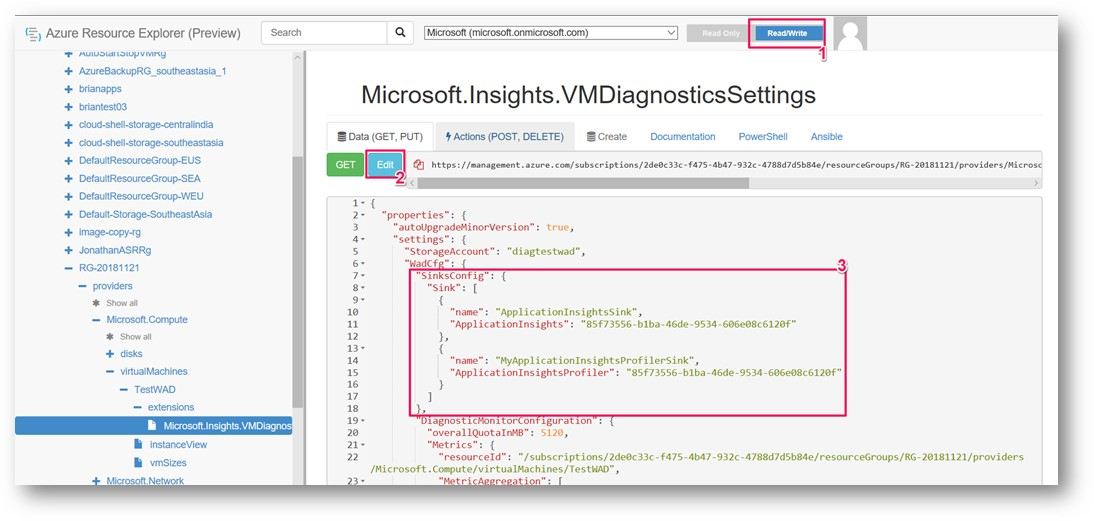
The key part is the ApplicationInsightsProfilerSink in the WadCfg. To have Azure Diagnostics enable Profiler to send data to your iKey, add another sink to this section.
"SinksConfig": {
  "Sink": [
    {
      "name": "ApplicationInsightsSink",
      "ApplicationInsights": "85f73556-b1ba-46de-9534-606e08c6120f"
    },
    {
      "name": "MyApplicationInsightsProfilerSink",
      "ApplicationInsightsProfiler": "85f73556-b1ba-46de-9534-606e08c6120f"
    }
  ]
},
Deploy the modified environment deployment definition.
Applying the modifications usually involves a full template deployment or a cloud service-based publish through PowerShell cmdlets or Visual Studio.
The following PowerShell commands are an alternate approach for existing virtual machines that touch only the Azure Diagnostics extension. Add the previously mentioned ProfilerSink to the config that's returned by the Get-AzVMDiagnosticsExtension command. Then pass the updated config to the Set-AzVMDiagnosticsExtension command.
$ConfigFilePath = [IO.Path]::GetTempFileName()
# After you export the currently deployed Diagnostics config to a file, edit it to include the ApplicationInsightsProfiler sink.
(Get-AzVMDiagnosticsExtension -ResourceGroupName "MyRG" -VMName "MyVM").PublicSettings | Out-File -Verbose $ConfigFilePath
# Set-AzVMDiagnosticsExtension might require the -StorageAccountName argument
# If your original diagnostics configuration had the storageAccountName property in the protectedSettings section (which is not downloadable), be sure to pass the same original value you had in this cmdlet call.
Set-AzVMDiagnosticsExtension -ResourceGroupName "MyRG" -VMName "MyVM" -DiagnosticsConfigurationPath $ConfigFilePath
If the intended application is running through IIS, enable the
IIS Http TracingWindows feature.Establish remote access to the environment, and then use the Add Windows features window. Or run the following command in PowerShell (as administrator):
Enable-WindowsOptionalFeature -FeatureName IIS-HttpTracing -Online -AllIf establishing remote access is a problem, you can use the Azure CLI to run the following command:
az vm run-command invoke -g MyResourceGroupName -n MyVirtualMachineName --command-id RunPowerShellScript --scripts "Enable-WindowsOptionalFeature -FeatureName IIS-HttpTracing -Online -All"
Deploy your application.
Set Profiler Sink using Azure Resource Explorer
We don't yet have a way to set the Application Insights Profiler sink from the portal. Instead of using PowerShell as described above, you can use Azure Resource Explorer to set the sink. But note, if you deploy the VM again, the sink will be lost. You'll need to update the config you use when deploying the VM to preserve this setting.
Check that the Azure Diagnostics extension is installed by viewing the extensions installed for your virtual machine.
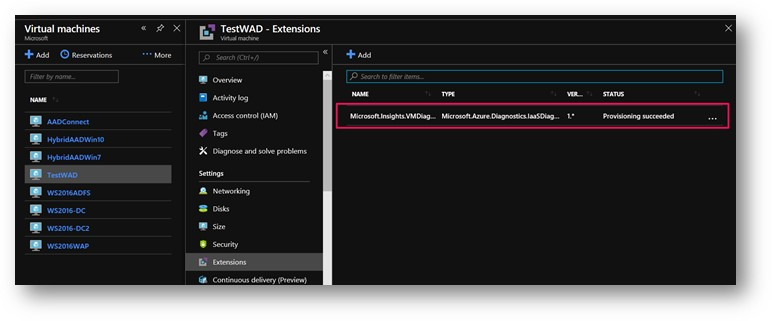
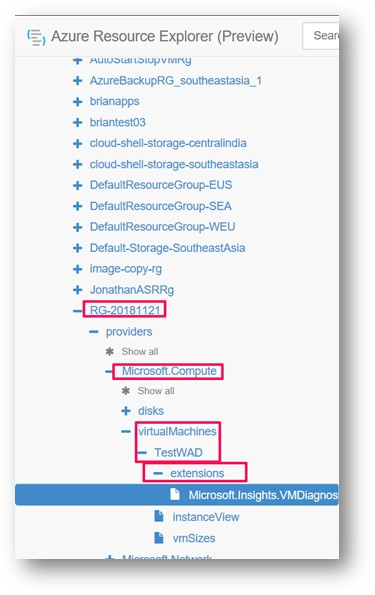
Find the VM Diagnostics extension for your VM. Go to https://portal.azure.cn/#blade/HubsExtension/ArmExplorerBlade. Expand your resource group, Microsoft.Compute virtualMachines, virtual machine name, and extensions.
Add the Application Insights Profiler sink to the SinksConfig node under WadCfg. If you don't already have a SinksConfig section, you may need to add one. Be sure to specify the proper Application Insights iKey in your settings. You'll need to switch the explorers mode to Read/Write in the upper right corner and Press the blue 'Edit' button.
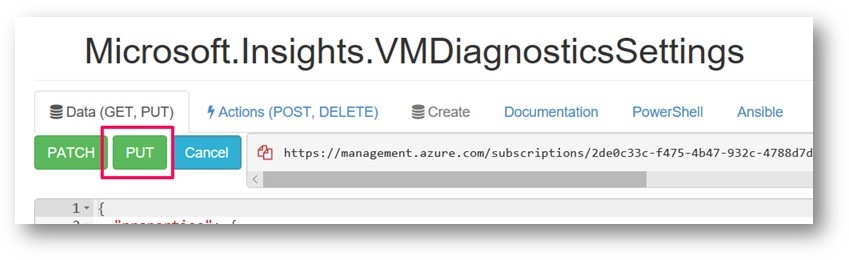
When you're done editing the config, press 'Put'. If the put is successful, a green check will appear in the middle of the screen.
Can Profiler run on on-premises servers?
We have no plan to support Application Insights Profiler for on-premises servers.
Next steps
- Generate traffic to your application (for example, launch an availability test). Then, wait 10 to 15 minutes for traces to start to be sent to the Application Insights instance.
- See Profiler traces in the Azure portal.
- For help with troubleshooting Profiler issues, see Profiler troubleshooting.