Note
Access to this page requires authorization. You can try signing in or changing directories.
Access to this page requires authorization. You can try changing directories.
Azure provides a complete set of services based on Azure Monitor for monitoring the health and performance of different layers of your Kubernetes infrastructure and the applications that depend on it. These services work in conjunction with each other to provide a complete monitoring solution for your clusters running in Azure Kubernetes Service (AKS).
You may have an existing investment in cloud native technologies endorsed by the Cloud Native Computing Foundation, or your organization may use alternative tools to collect and analyze Kubernetes logs, such as Splunk or Datadog. Your choice of which Azure tools to deploy and their configuration will depend on the requirements of your particular environment. You may choose to migrate your existing monitoring solution to Azure Monitor or integrate Azure services into your existing environment. For example, you may use the managed offerings in Azure for Prometheus and Grafana in other clouds, or you may choose to use your existing installation of these tools with your Kubernetes clusters in Azure.
Tip
This article describes the features of Azure Monitor used to monitor the health and performance of your Kubernetes clusters and the workloads running on them. See Monitor Kubernetes clusters using Azure Monitor and cloud native tools for best practices on how to configure these services to monitor the different layers of your Kubernetes environment based on the typical roles that manage them.
Kubernetes layers
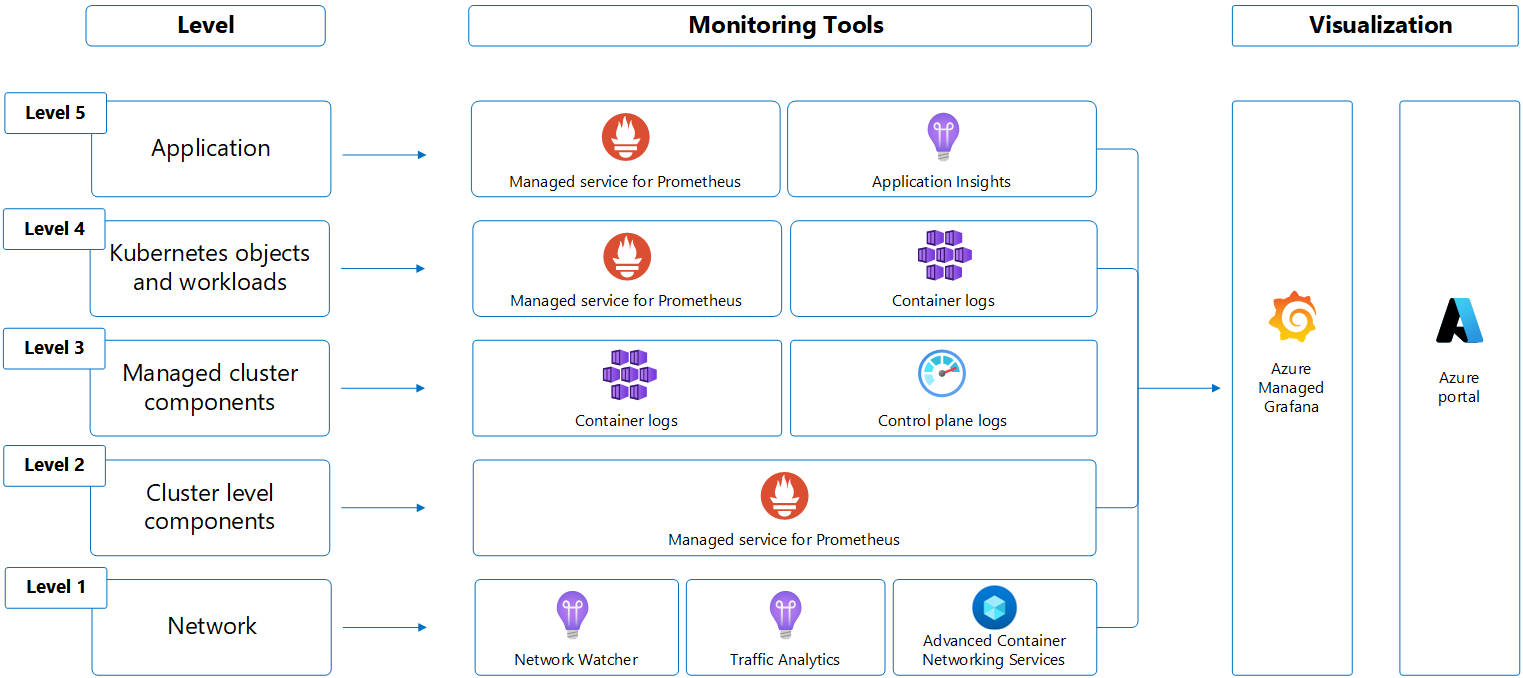
Following is an illustration of a typical Kubernetes environment, starting from the infrastructure layer up through applications. Each layer has distinct monitoring requirements that are addressed by different Azure services that are each described below.
Network level
Virtual network components supporting traffic to and from the Kubernetes cluster are monitored with the following services.
| Service | Description |
|---|---|
| Network Watcher | Suite of tools in Azure to monitor the virtual networks used by your Kubernetes clusters and diagnose detected issues. |
| Traffic analytics | Feature of Network Watcher that analyzes flow logs to provide insights into traffic flow. |
| Network insights | Feature of Azure Monitor that includes a visual representation of the performance and health of different network components and provides access to the network monitoring tools that are part of Network Watcher. |
Container levels
The Container levels include Kubernetes objects such as deployments, containers, and replicasets, cluster control plane components including API servers, cloud controller, and kubelet, and virtual machine scale sets abstracted as nodes and node pools. These layers are monitored with the following services.
| Service | Description |
|---|---|
| Azure Monitor managed service for Prometheus | Prometheus is a cloud-native metrics solution from the Cloud Native Compute Foundation and the most common tool used for collecting and analyzing metric data from Kubernetes clusters. Azure Monitor managed service for Prometheus is a fully managed solution that's compatible with the Prometheus query language (PromQL) and Prometheus alerts and integrates with Azure Managed Grafana for visualization. This service supports your investment in open source tools without the complexity of managing your own Prometheus environment. |
| Container log collection | Azure service for AKS and Azure Arc-enabled Kubernetes clusters that use a containerized version of the Azure Monitor agent to collect stdout/stderr logs and Kubernetes events from each node in your cluster. Analyze the data in the Azure portal or query it using Log Analytics. |
| Control plane log collection | Control plane logs are implemented as resource logs in Azure Monitor. Create a diagnostic setting to collect these logs in the same Log Analytics workspace as your container logs. |
| Azure Arc-enabled Kubernetes | Allows you to attach to Kubernetes clusters running on-premises or in other clouds using Azure as a centralized control plane. With the Arc agent installed, you can monitor AKS and hybrid clusters together using the same methods and tools, including collection of container logs Prometheus metrics. |
Application level
Application workloads running on your Kubernetes cluster are monitored with the following services.
| Service | Description |
|---|---|
| Application insights | Feature of Azure Monitor that provides application performance monitoring (APM) to monitor applications running on your Kubernetes cluster from development, through test, and into production. Quickly identify and mitigate latency and reliability issues using distributed traces. Supports OpenTelemetry for vendor-neutral instrumentation. |
Analysis
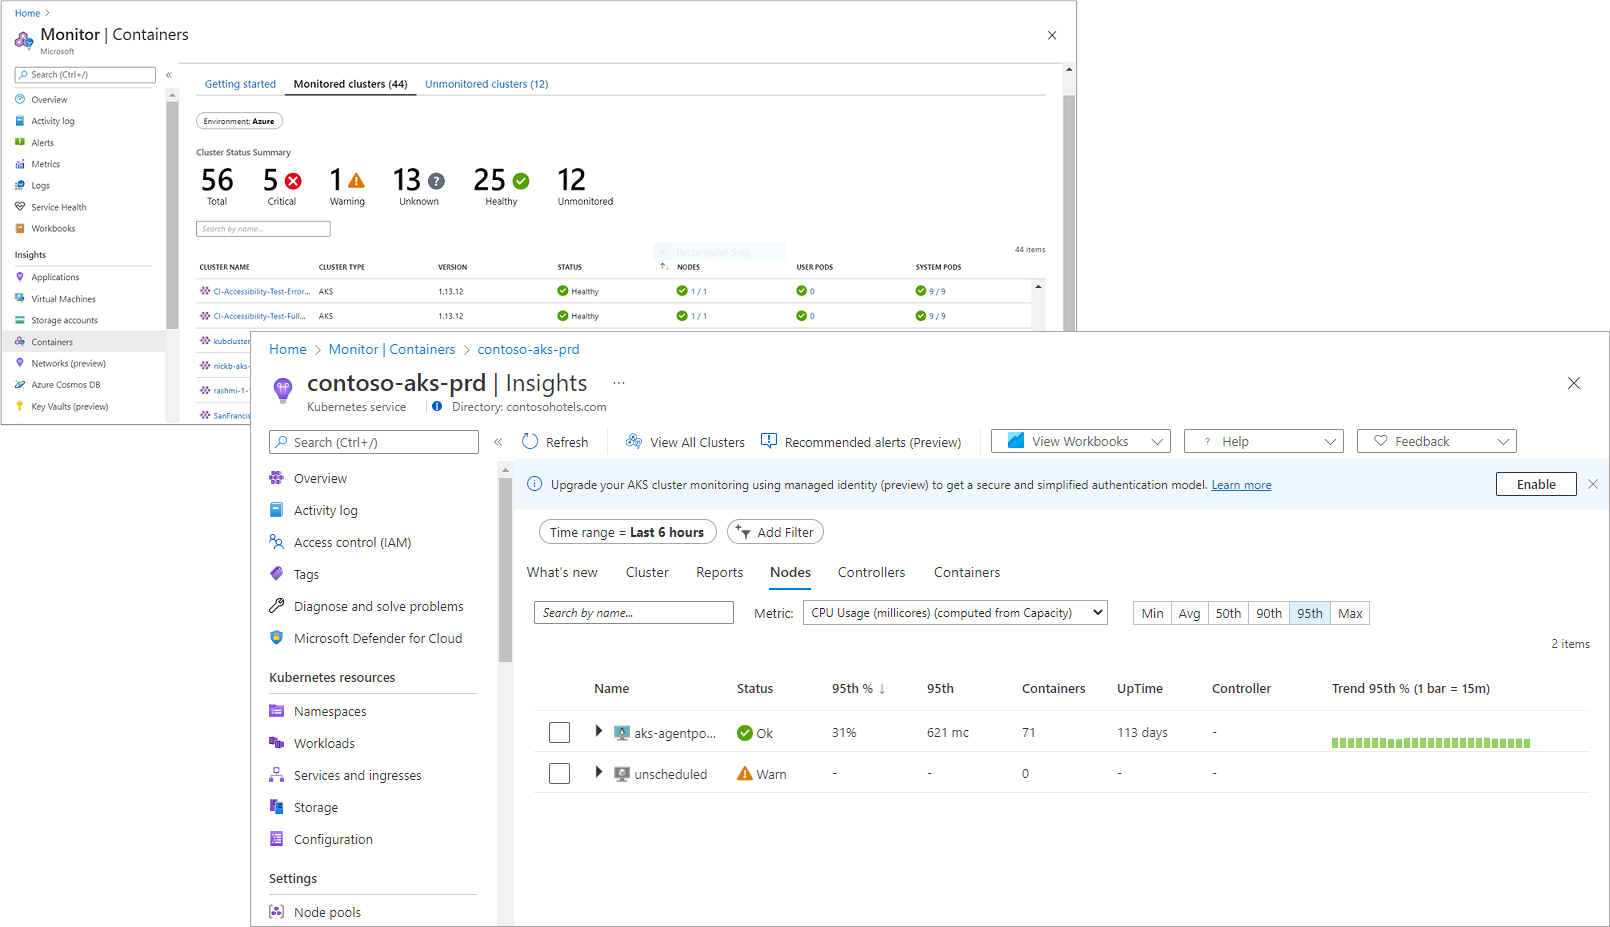
Azure Monitor provides multiple tools to analyze the data collected by other features. Start with a summary of all clusters in your environment and then drill down into interactive views for a single cluster. You can also take advantage of a variety of available Grafana dashboards that combine different sets of Kubernetes telemetry. For proactive notification, enable a set of common alert rules based on Prometheus metrics.
| Service | Description |
|---|---|
| Unified monitoring dashboard | The unified monitoring dashboard in the Azure portal consolidates data gathered by the different services for interactive analysis in a single screen. Get a high level status of your different clusters and then drill down into the details of individual clusters and their components. |
| Azure Managed Grafana | Fully managed implementation of Grafana, which is an open-source data visualization platform commonly used to present Prometheus and other data. Multiple predefined Grafana dashboards are available for monitoring Kubernetes and full-stack troubleshooting. |
Next steps
- See Monitor Kubernetes clusters using Azure Monitor and cloud native tools for best practices and recommendations for configuring Azure Monitor features to monitor your Kubernetes environment.
- See Enable monitoring for Kubernetes clusters to enable Managed Prometheus and log collection on your cluster.

