Note
Access to this page requires authorization. You can try signing in or changing directories.
Access to this page requires authorization. You can try changing directories.
Whether you create a new AKS cluster in your Azure subscription, or add an Arc-enabled cluster, Azure Monitor provides a set of features to help you understand the performance and health of your cluster along with its nodes and workloads. This quickstart walks you through the default monitoring experience provided by Azure Monitor and how to quickly enable additional features to enhance your monitoring experience.
View default monitoring data
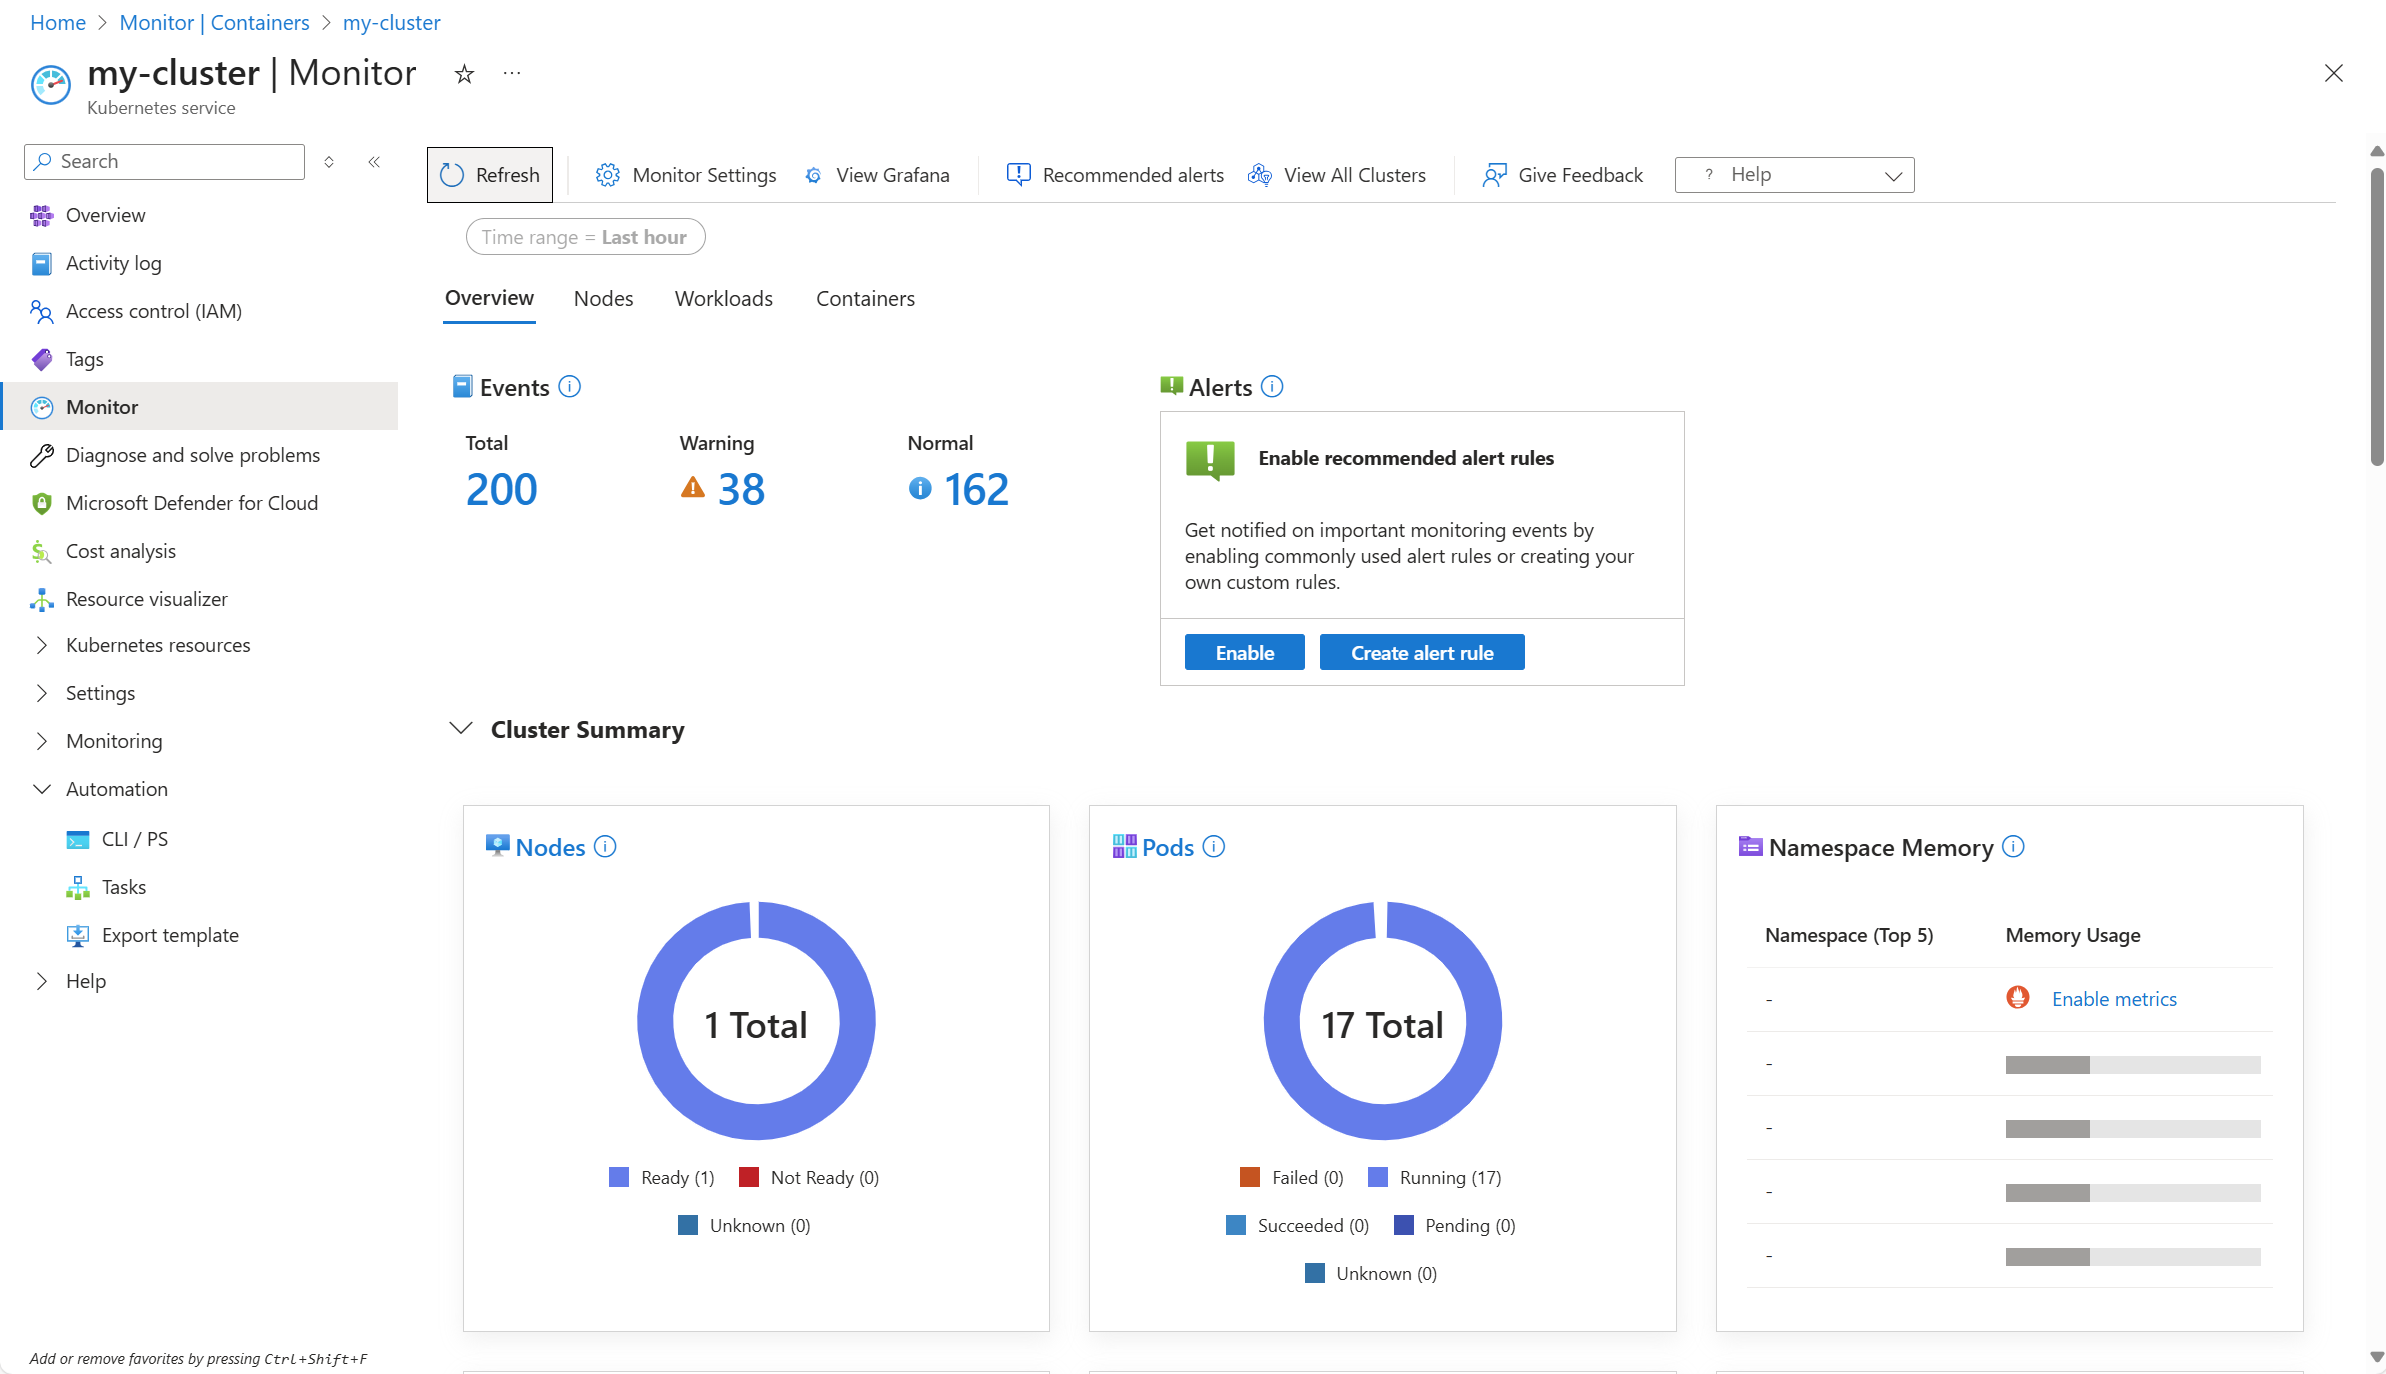
Go to one of your Kubernetes clusters in the Azure portal and select the Monitor option to get an overview of various telemetry indicating the health and performance of the cluster's nodes, workloads, and containers. Scroll through this screen and inspect the different tiles that provide information about the cluster. Several of the tiles may be disabled since the feature supporting them has not yet been enabled for the cluster. The ones that are populated with data are accessing platform metrics which are automatically collected for the cluster. If the tiles aren't disabled then you may have enabled monitoring when you created the cluster.
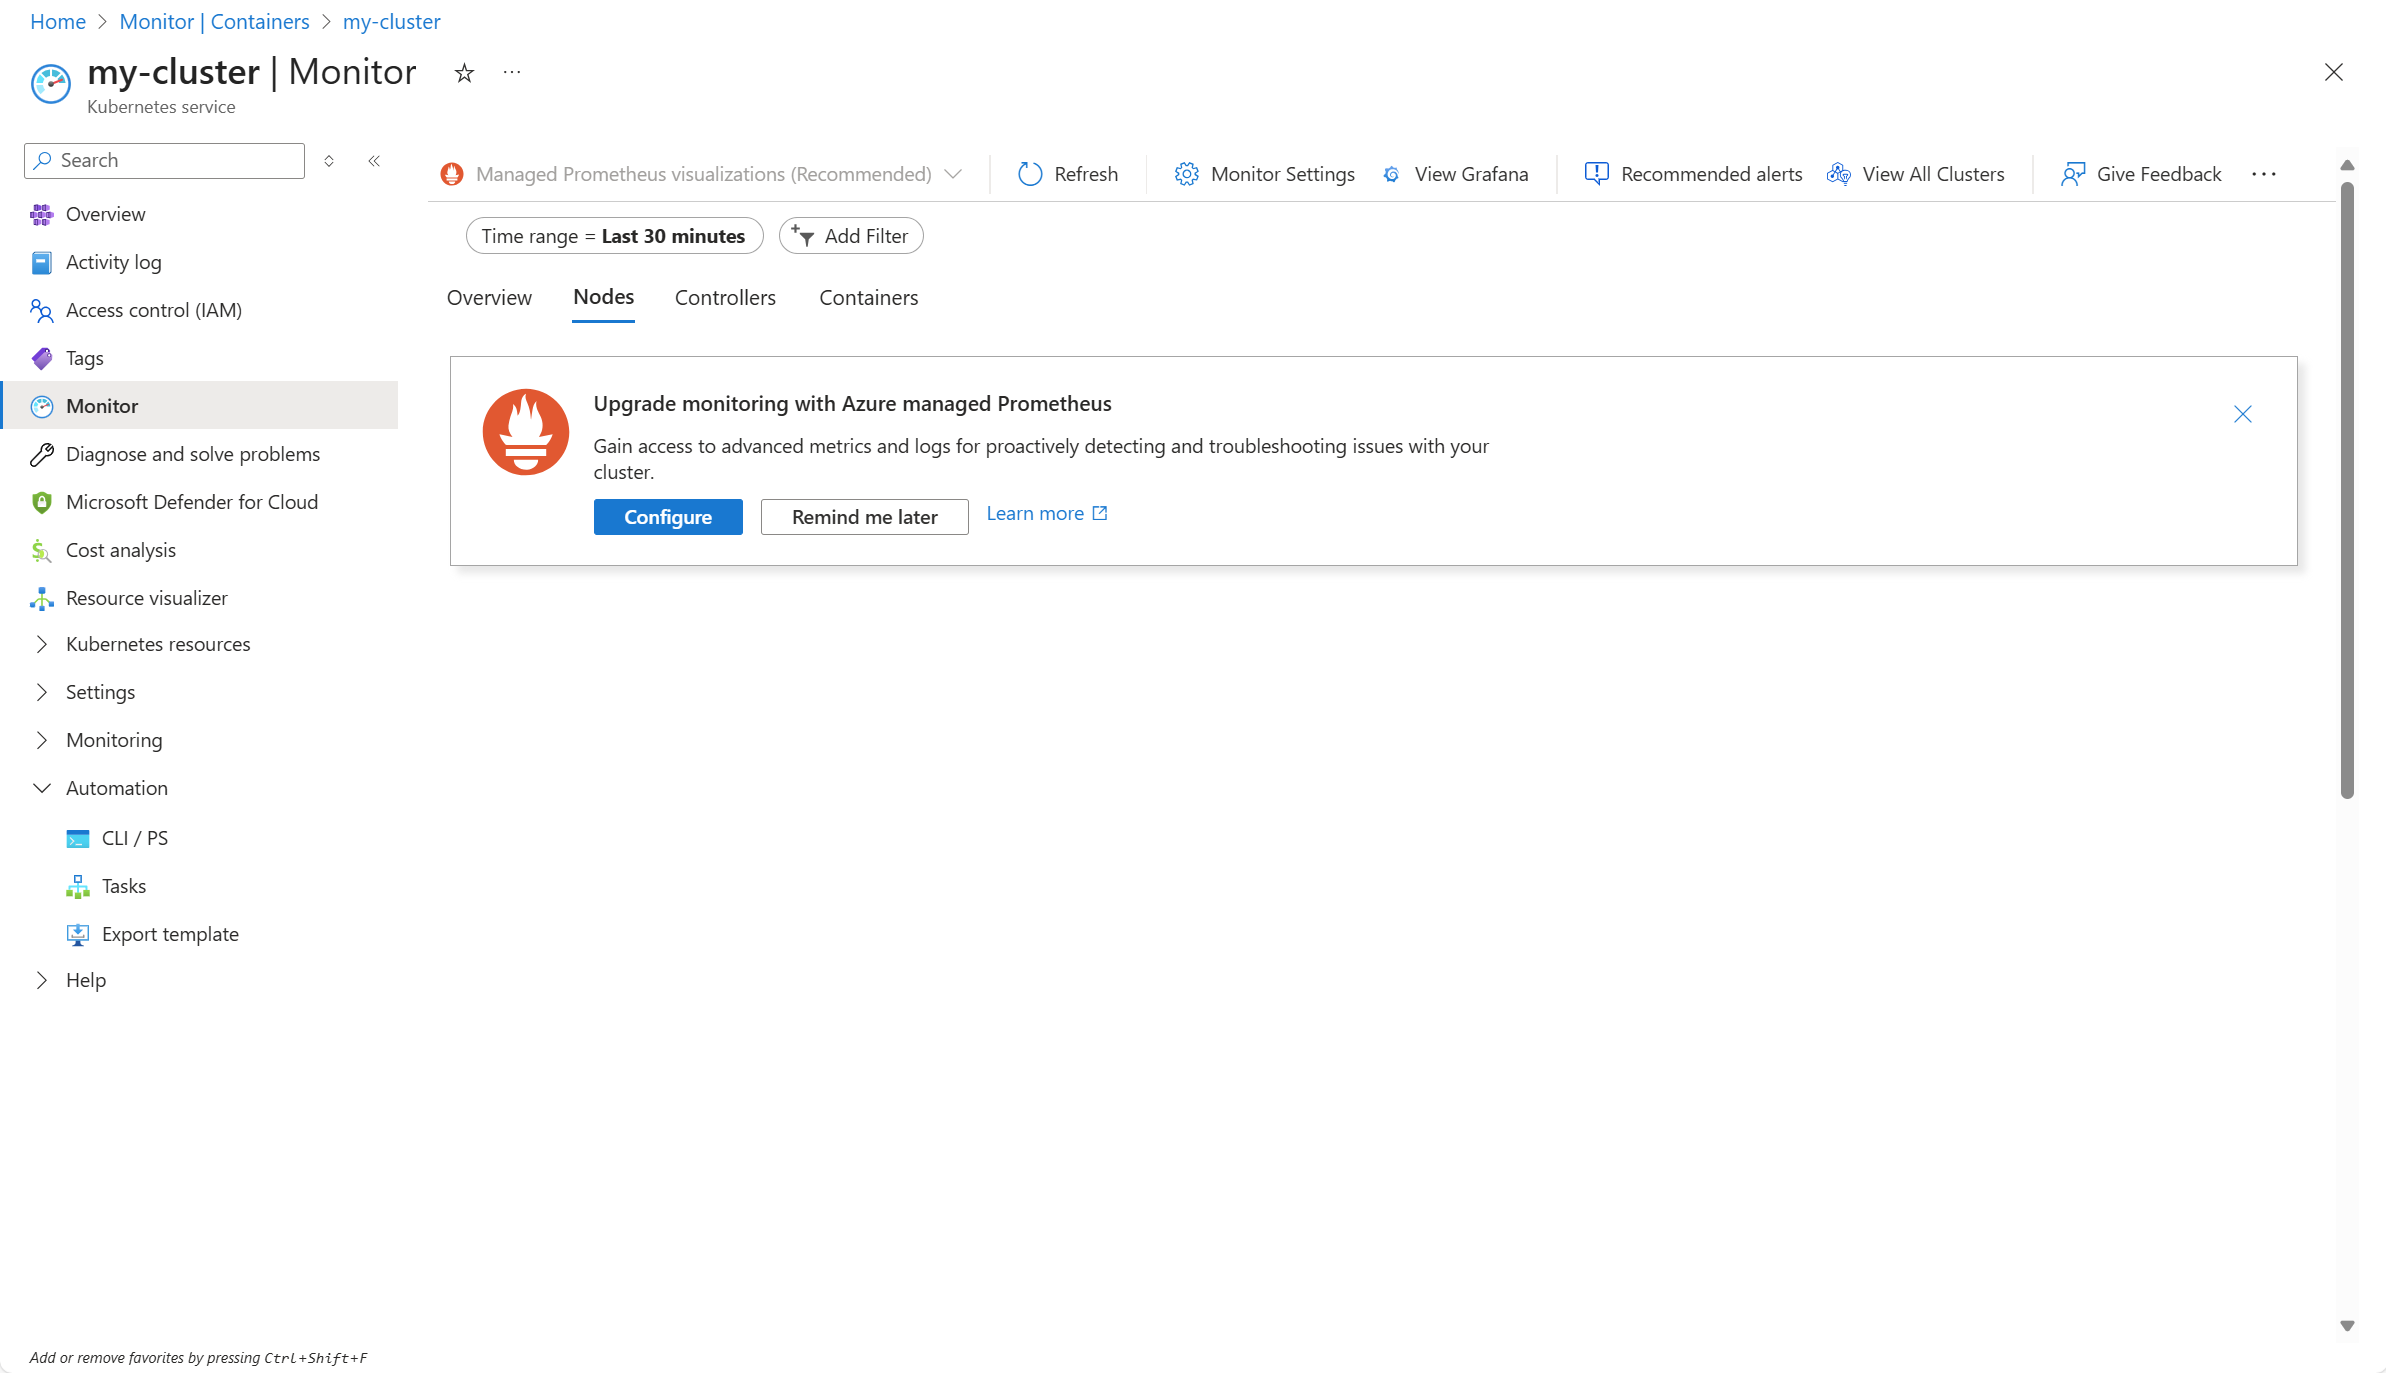
Select the Nodes, Controllers, and Containers and notice that these tabs are disable and provide an option to enable Managed Prometheus.
Enable additional monitoring features
To provide more complete monitoring of your Kubernetes cluster, you want to enable the following features:
- Managed Prometheus to collect a wider range of metrics from your cluster nodes, workloads, and containers.
- Container logging to collect stdout and stderr logs from your containers.
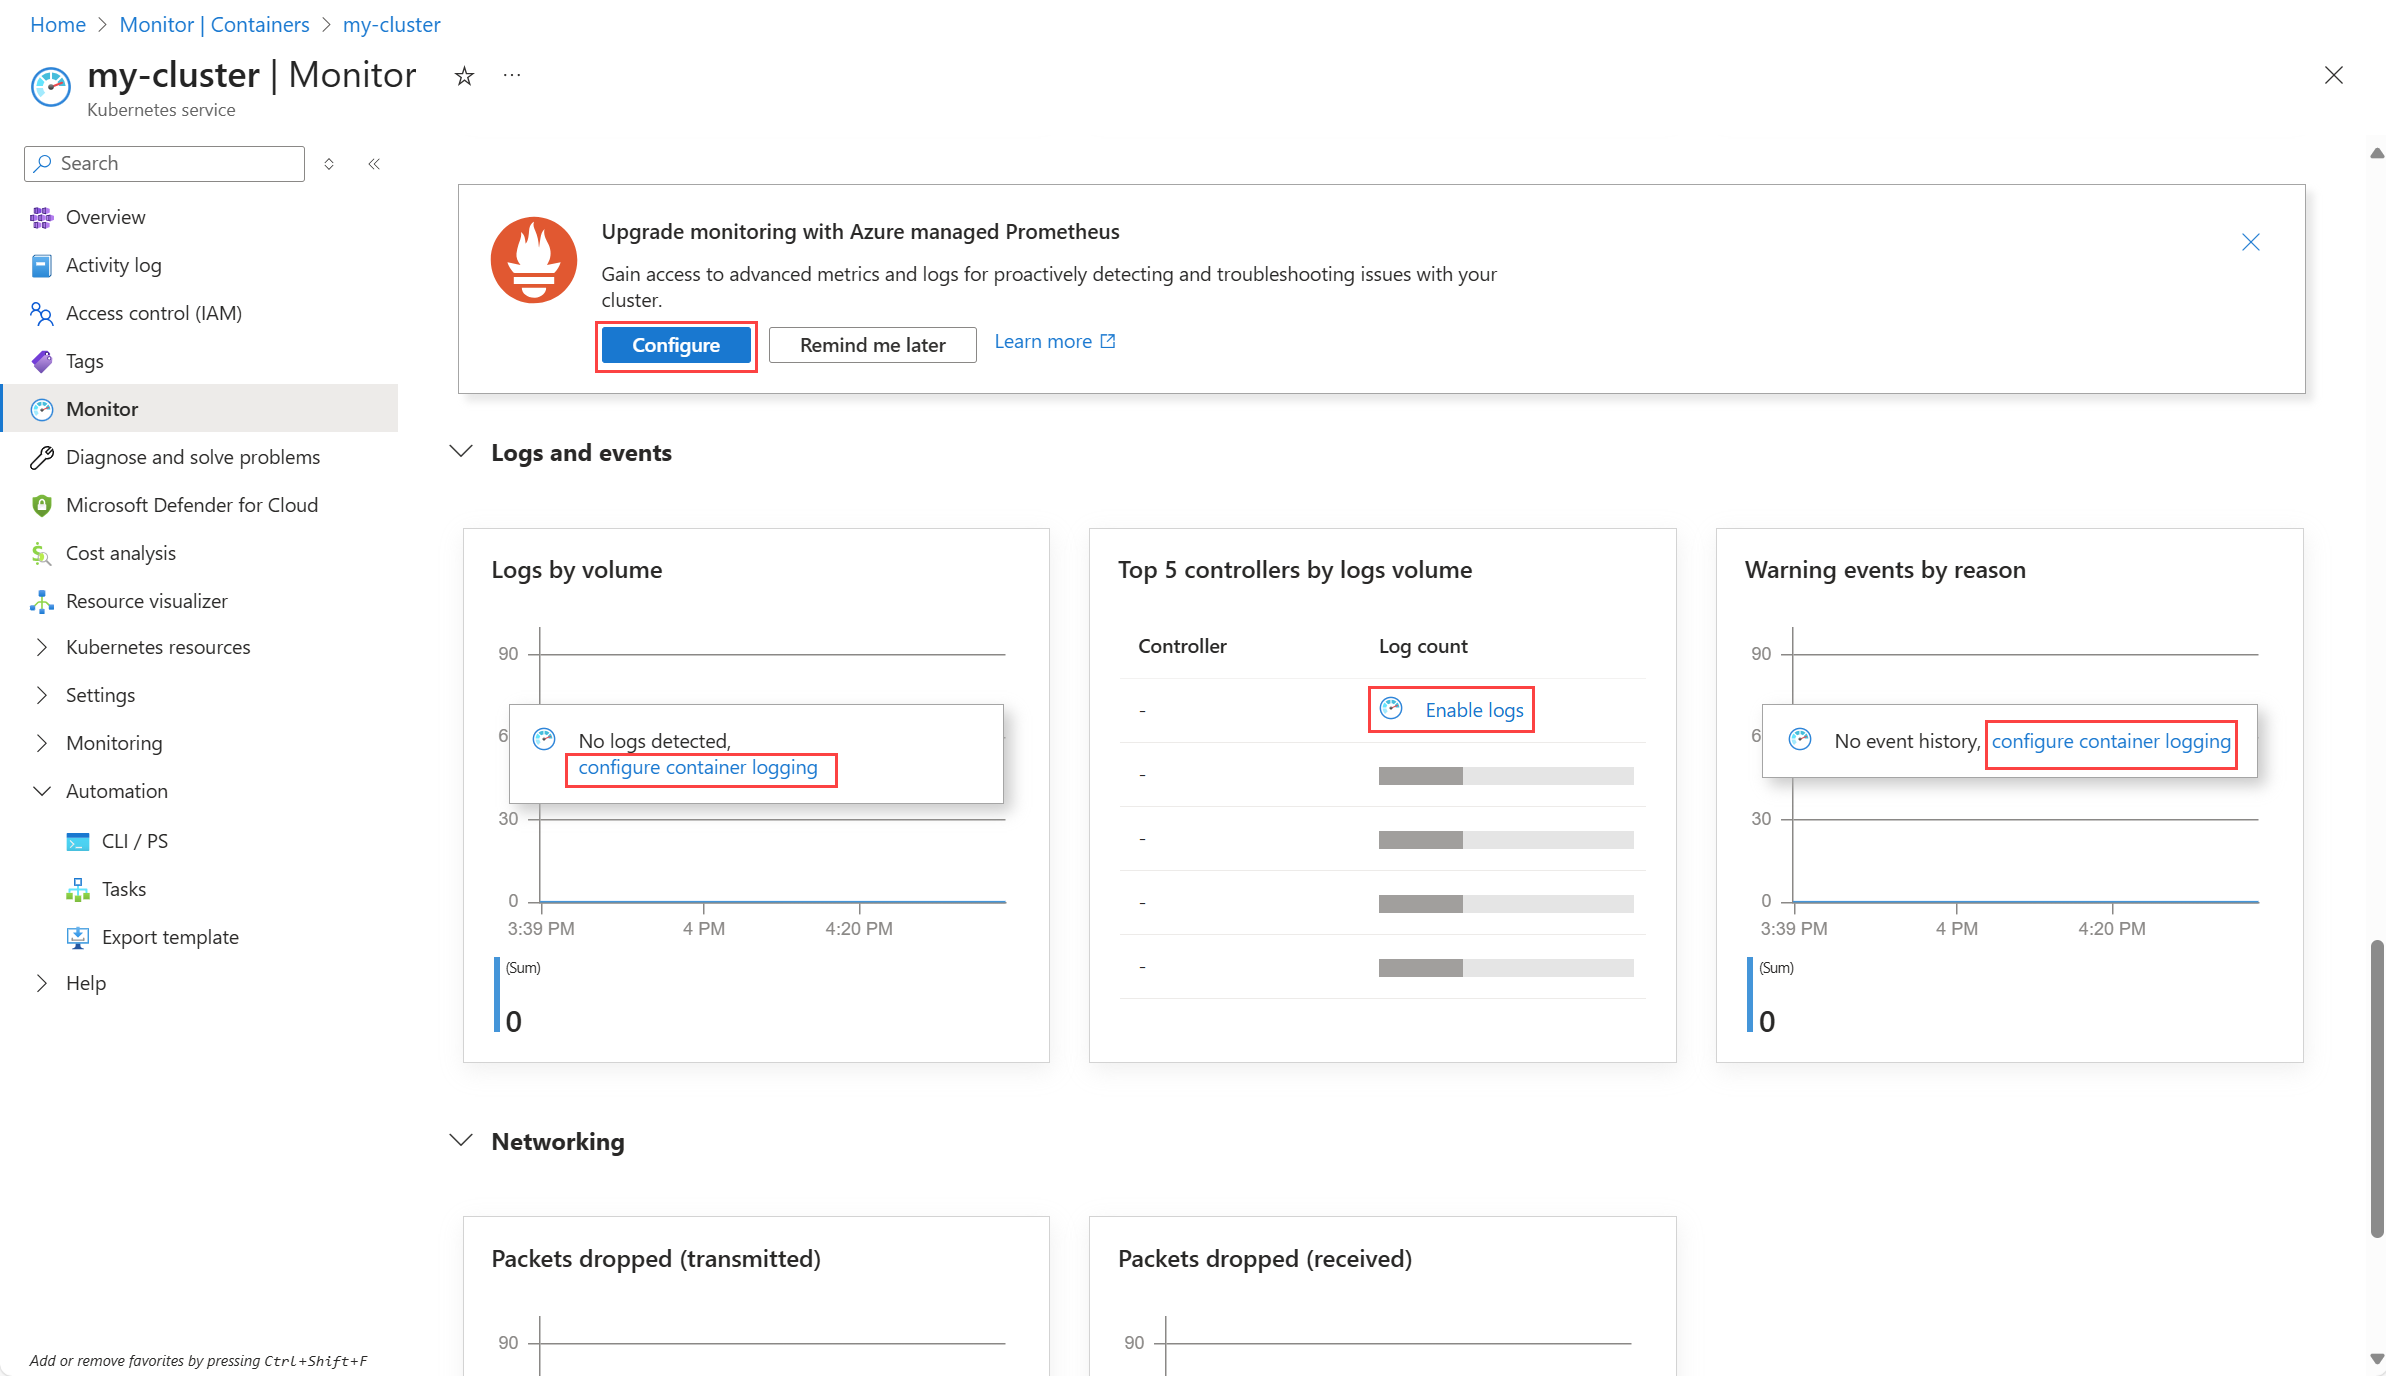
Click on any of the options on the screen for Enable metrics, configure Managed Prometheus, or configure container logging to open the configuration panel for the cluster. The same configuration screen will open regardless of which link you click.
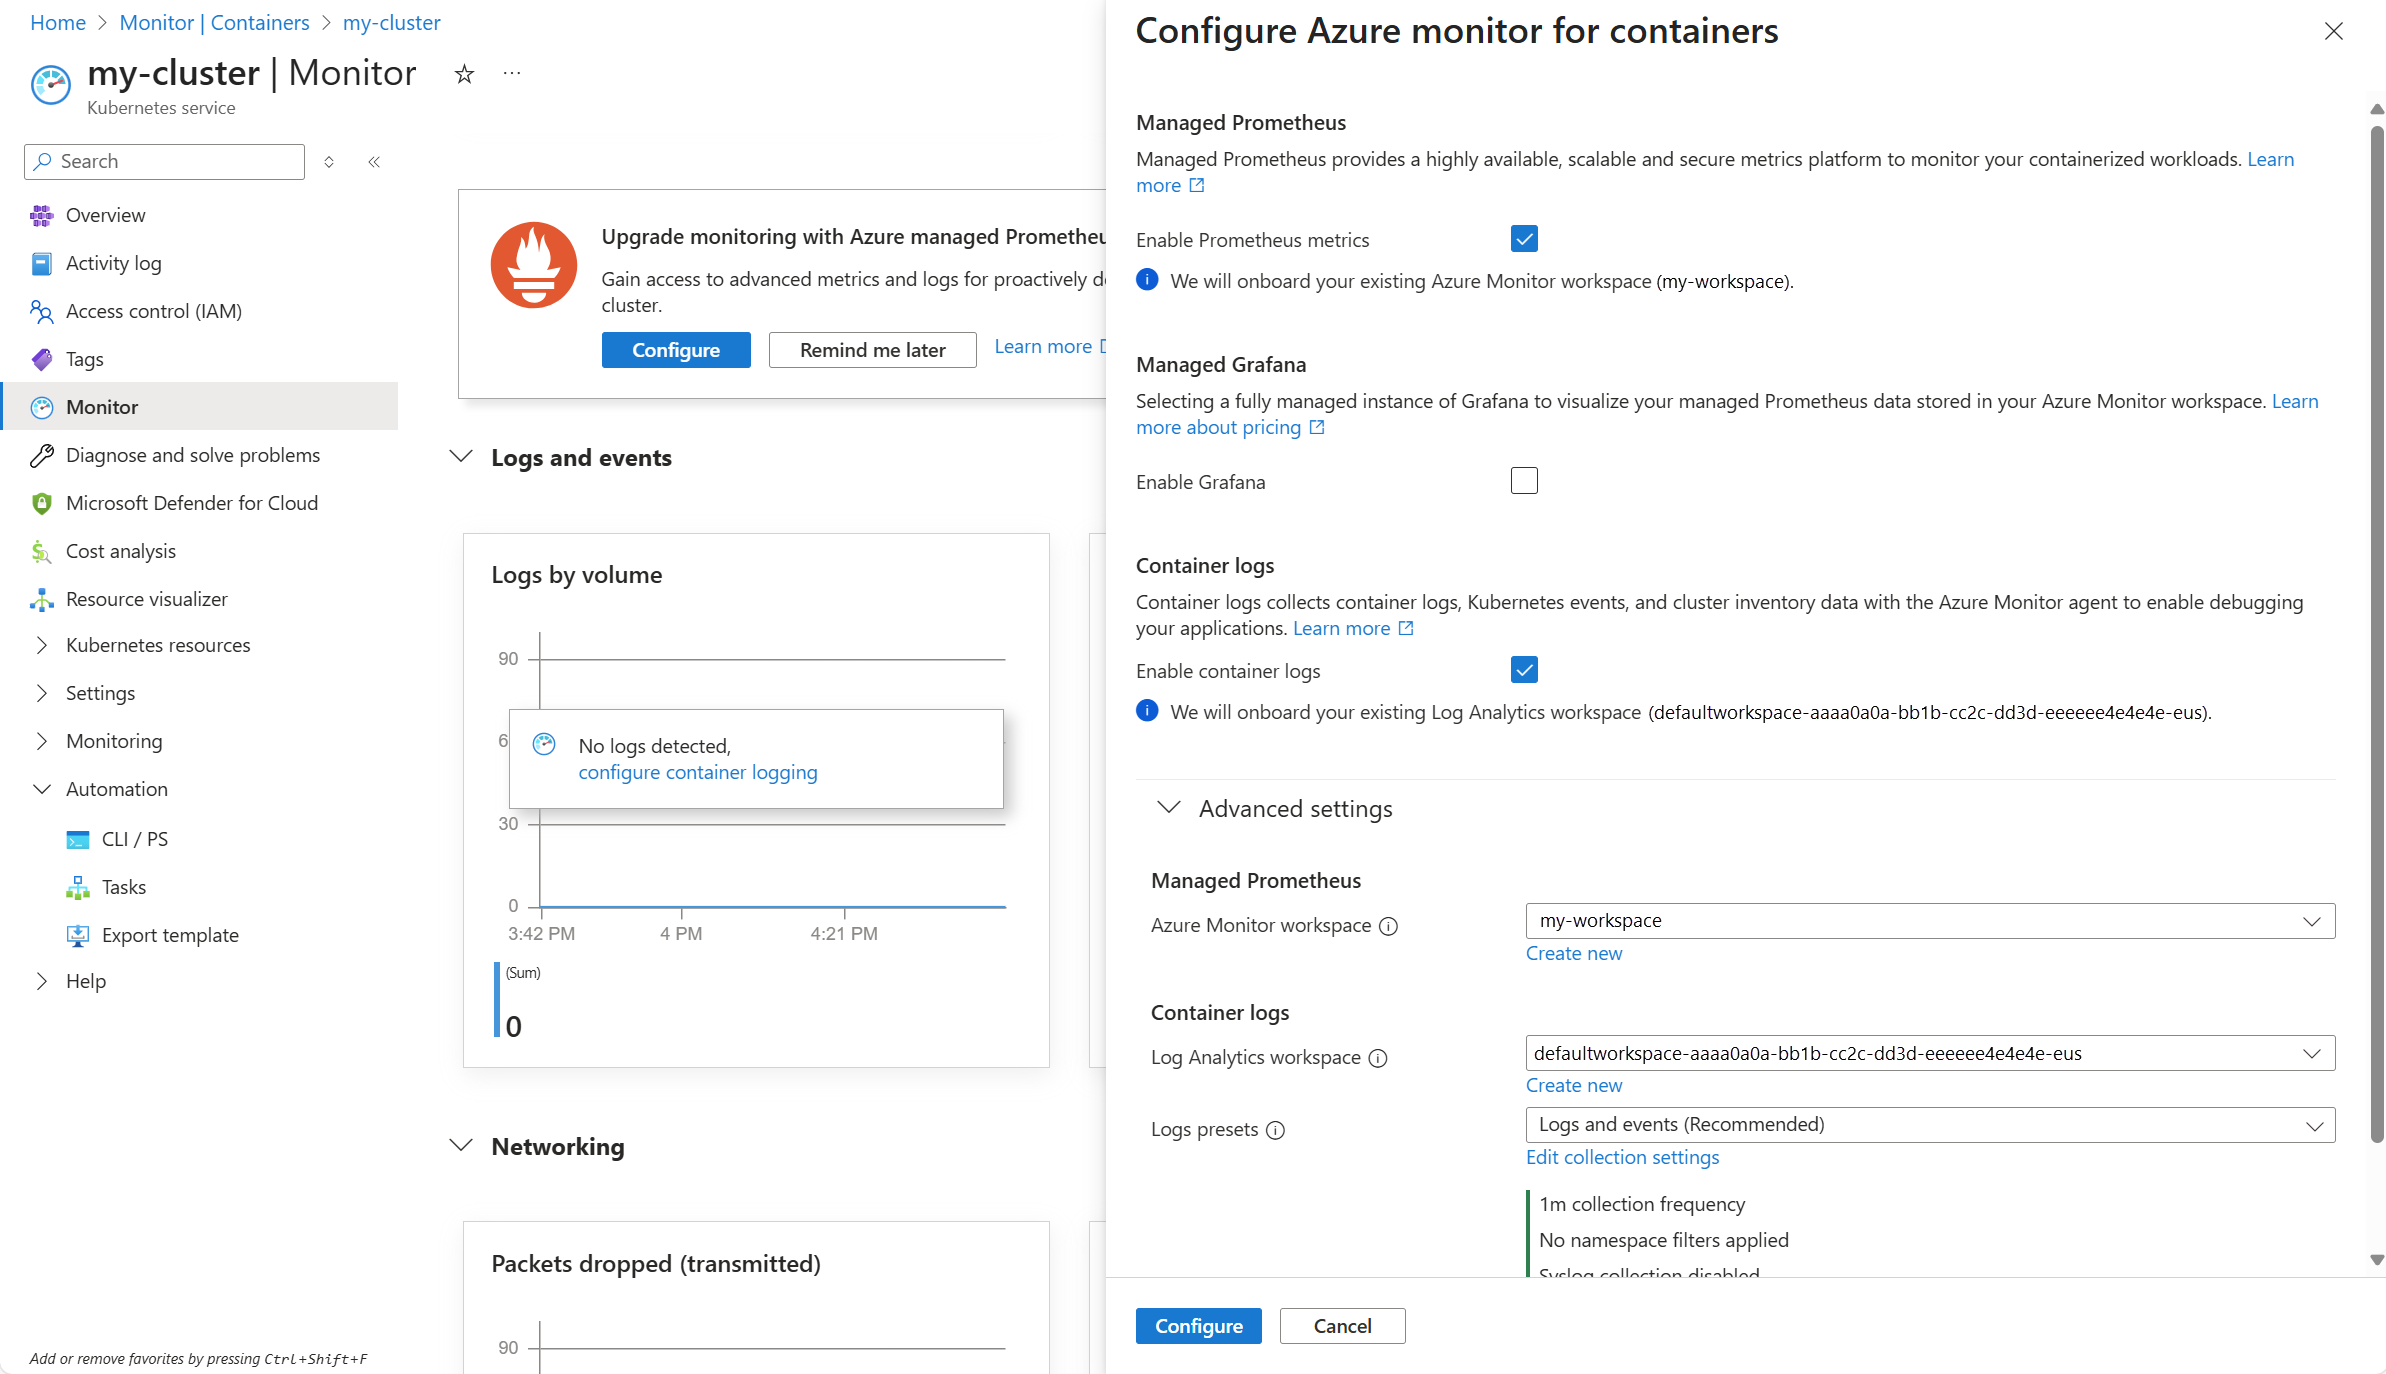
The configuration panel defaults to enabling all features and selects a workspace for each. Managed Prometheus requires an Azure Monitor workspace, while container logging requires a Log Analytics workspace. If Azure Monitor doesn't find an existing workspace to select, then it will create one automatically.
Expand Advanced settings if you want to select a different workspace. This will also allow you to modify the log collection settings to balance between your particular requirements and the cost of collecting data.
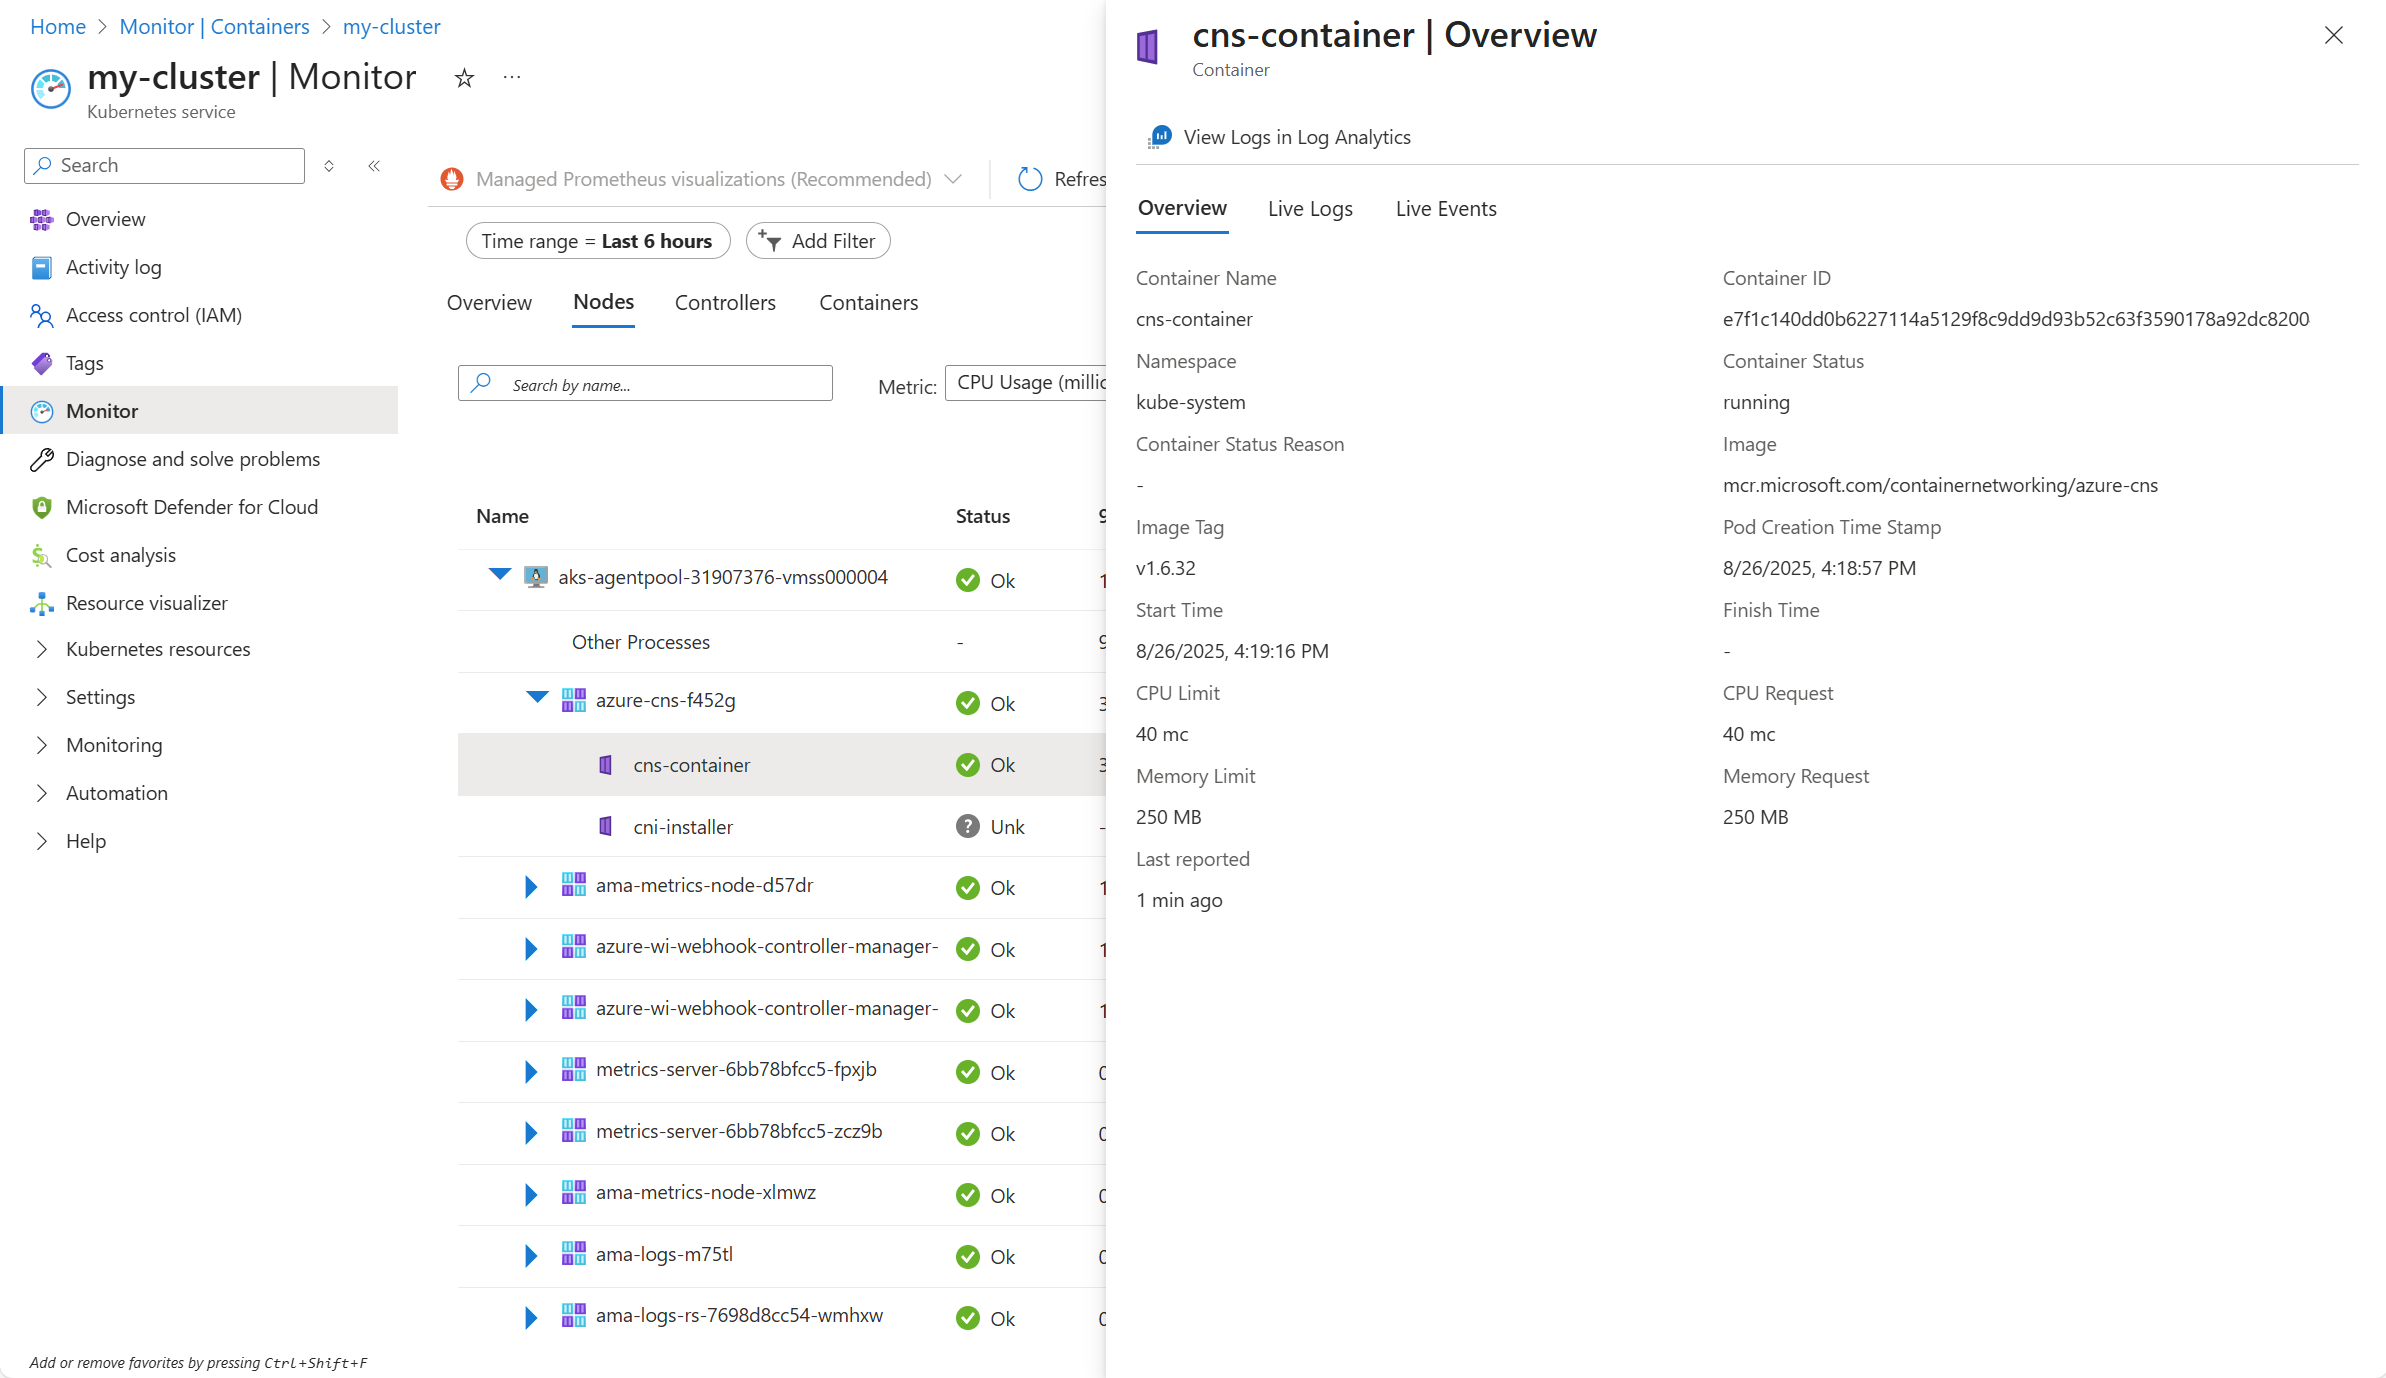
When you have the options you want, click Configure. This will deploy the Azure Monitor agent to your cluster and begin collecting data. Within a few minutes, the tiles on the Monitor screen will begin to populate with data. Select the Nodes, Controllers, and Containers and notice that these tabs are populated with resources in the cluster. Expand the objects to inspect different resource types. Click on one to view its details.
Enable alerting
Alerts in Azure Monitor proactively notify you when a metric or log query indicates a potential issue with your cluster that requires attention. You can quickly enable a common set of alert rules based on Prometheus metrics.
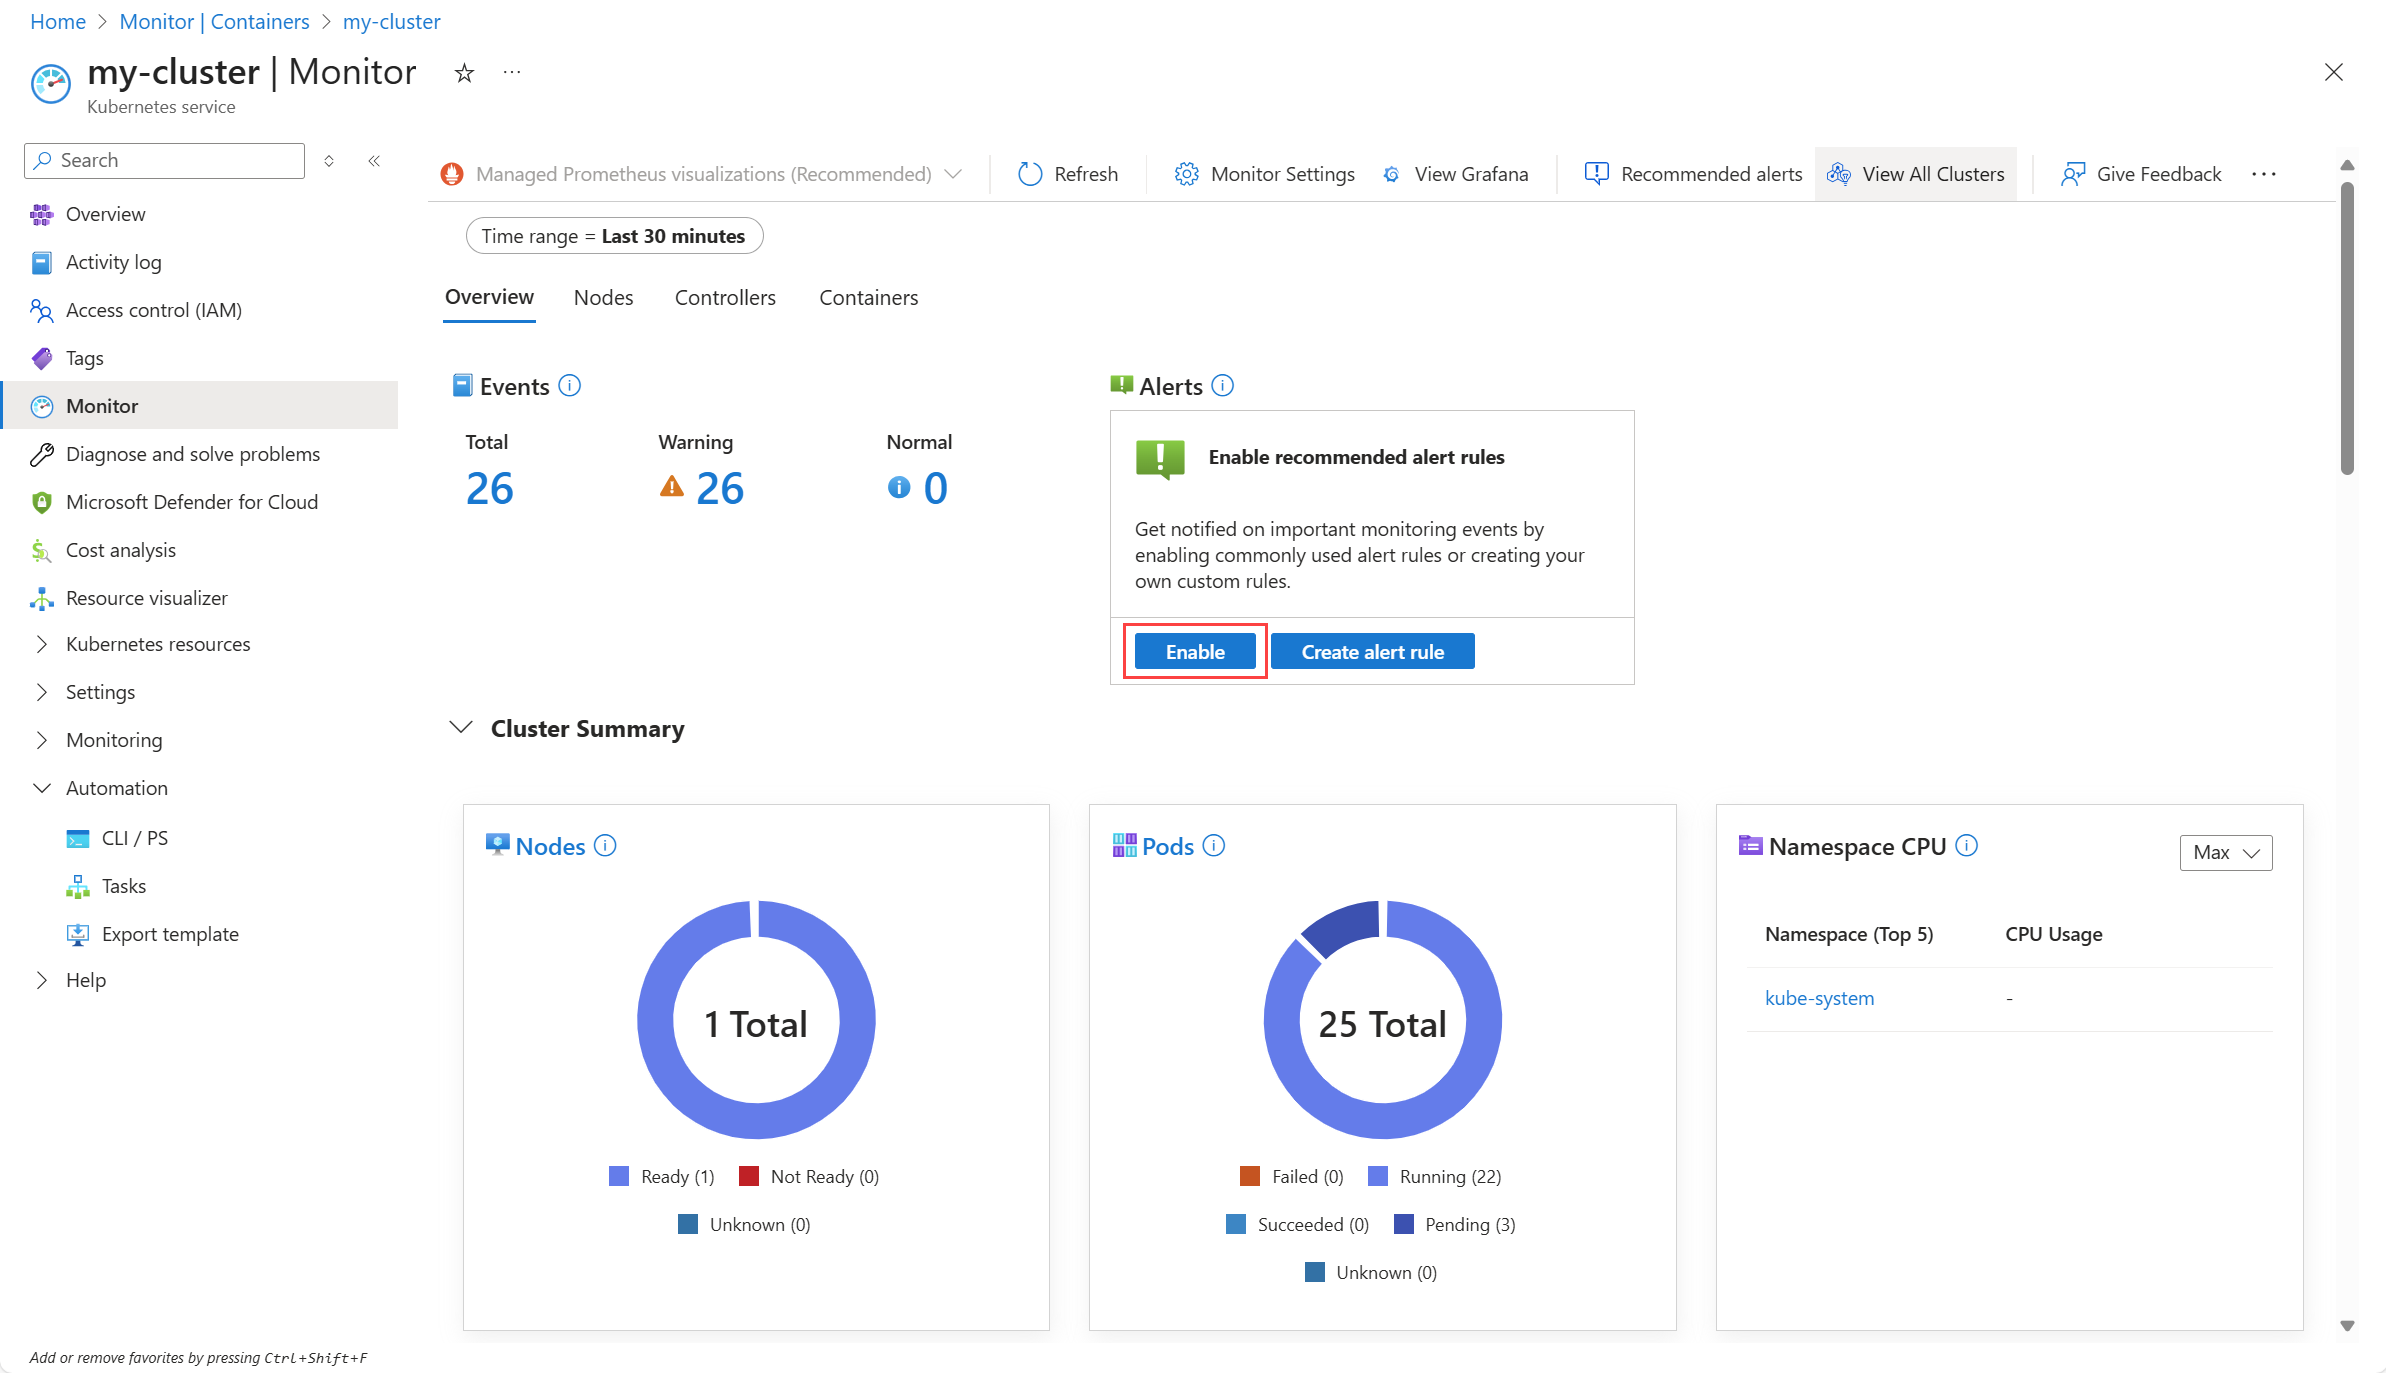
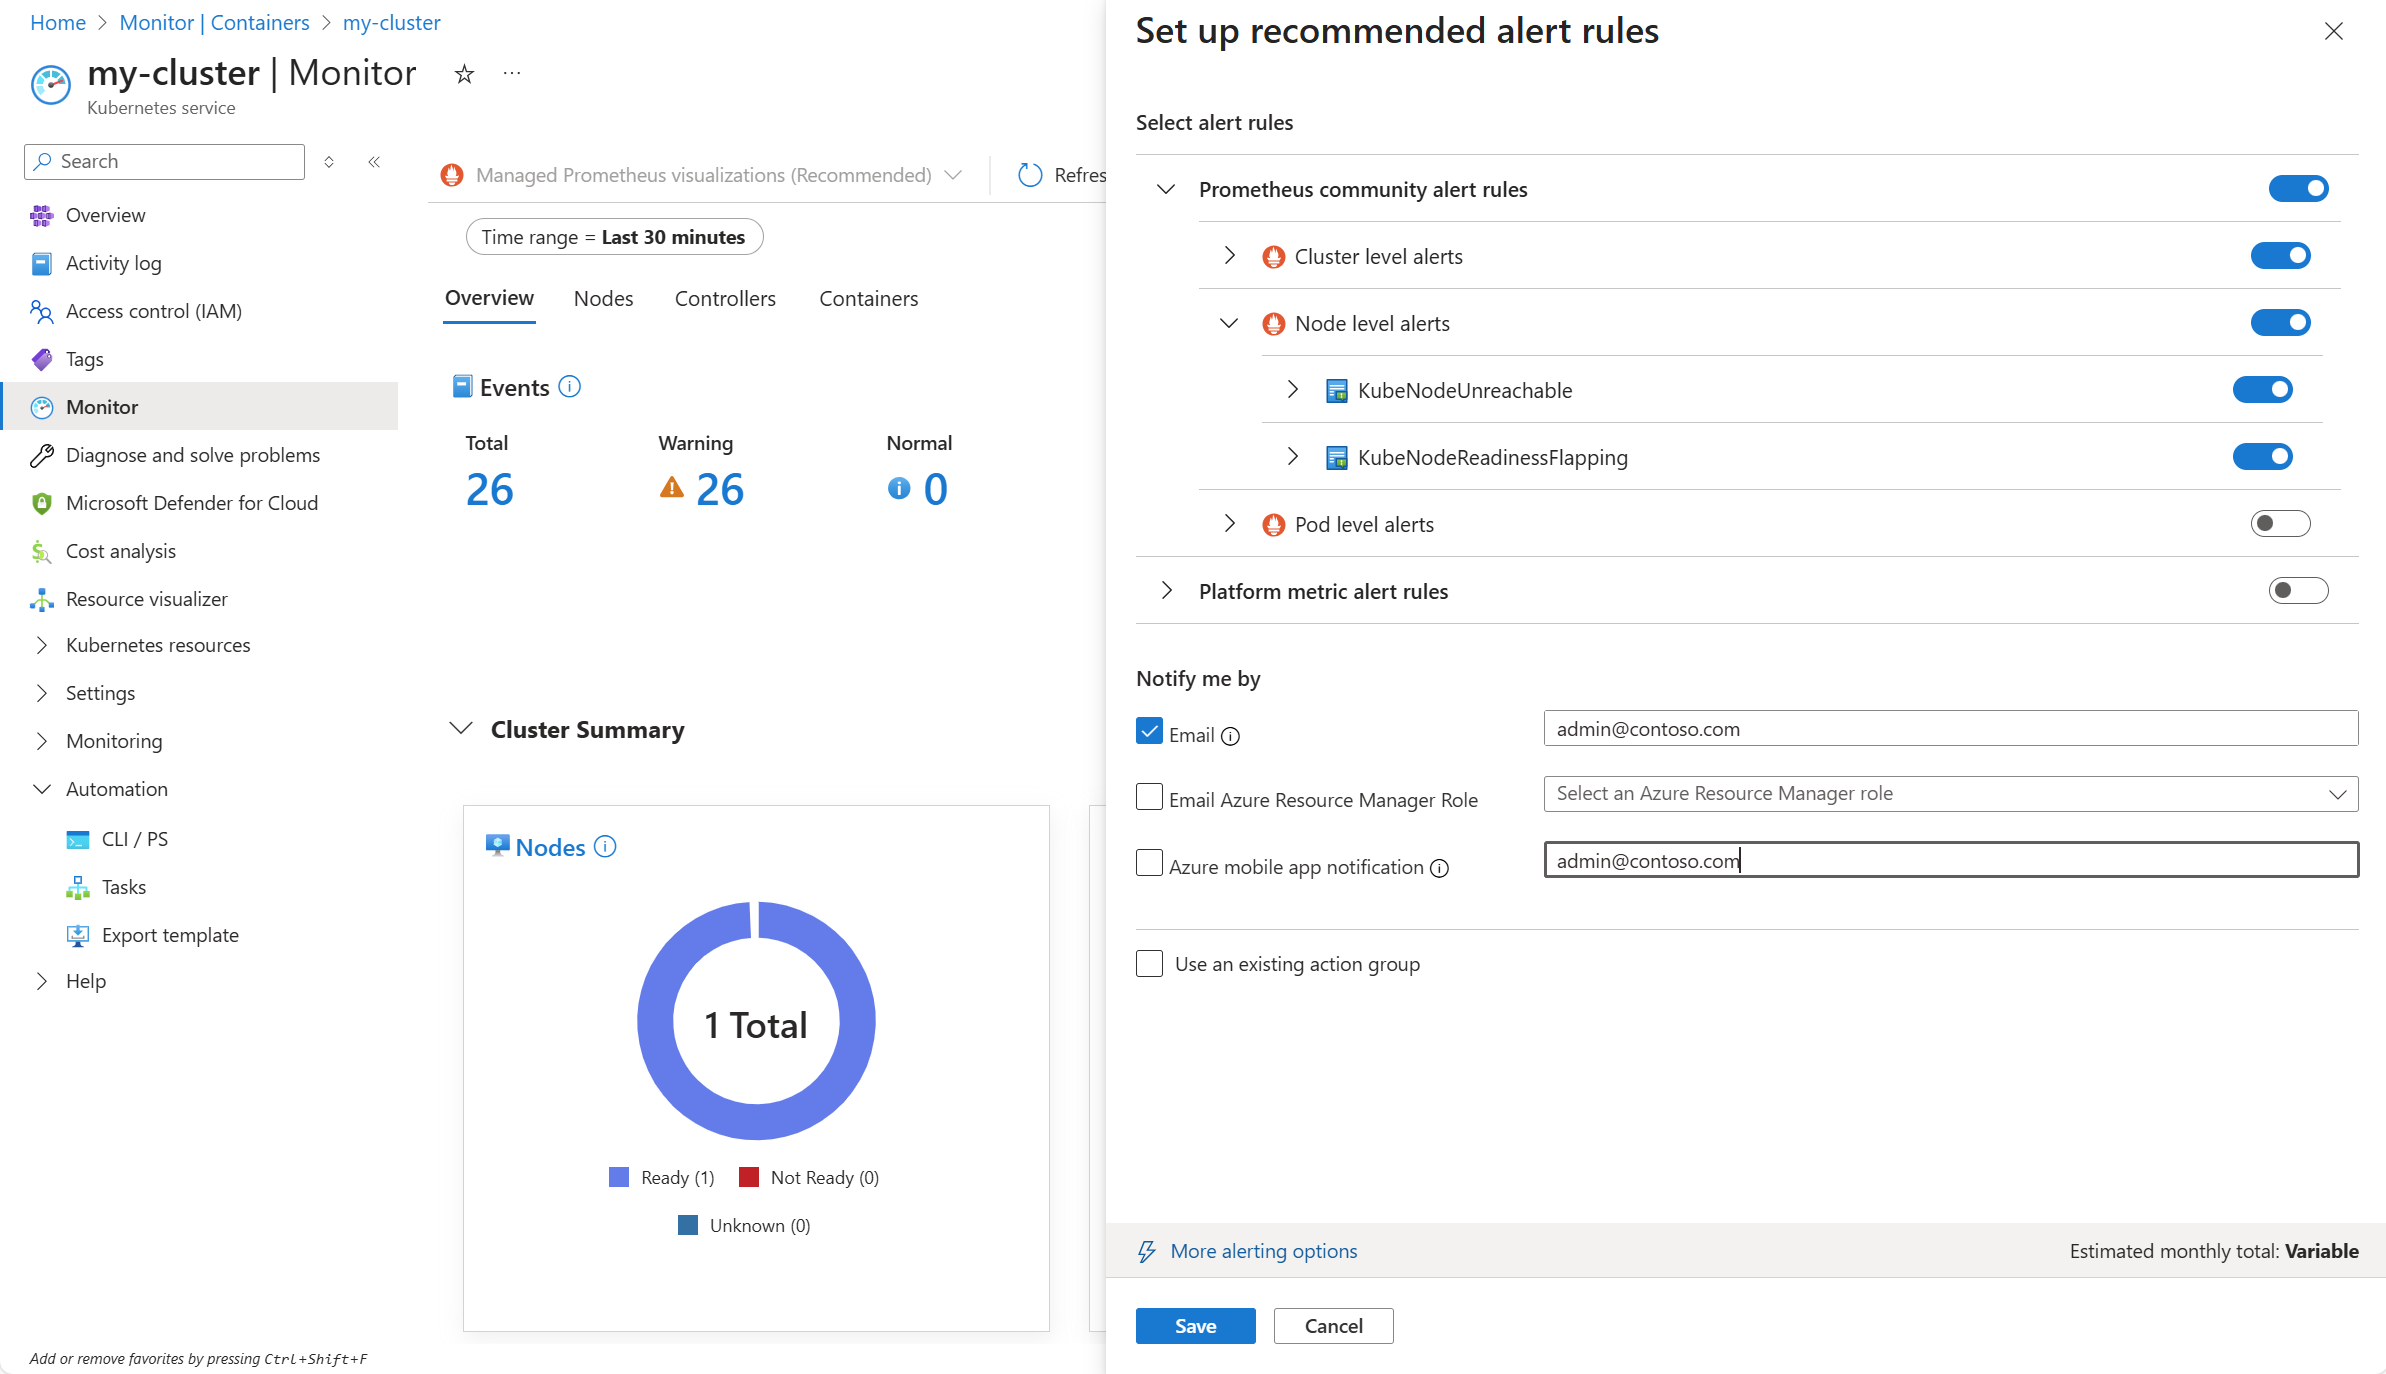
Go back to the Monitor menu and click Enable to open the recommended alerts panel.
You can select from a set of common alerts defined by the community for the cluster, node, and pod levels. Enable the different alert conditions you want and then provide an email to send the notification when an alert condition is met.
View all of your clusters
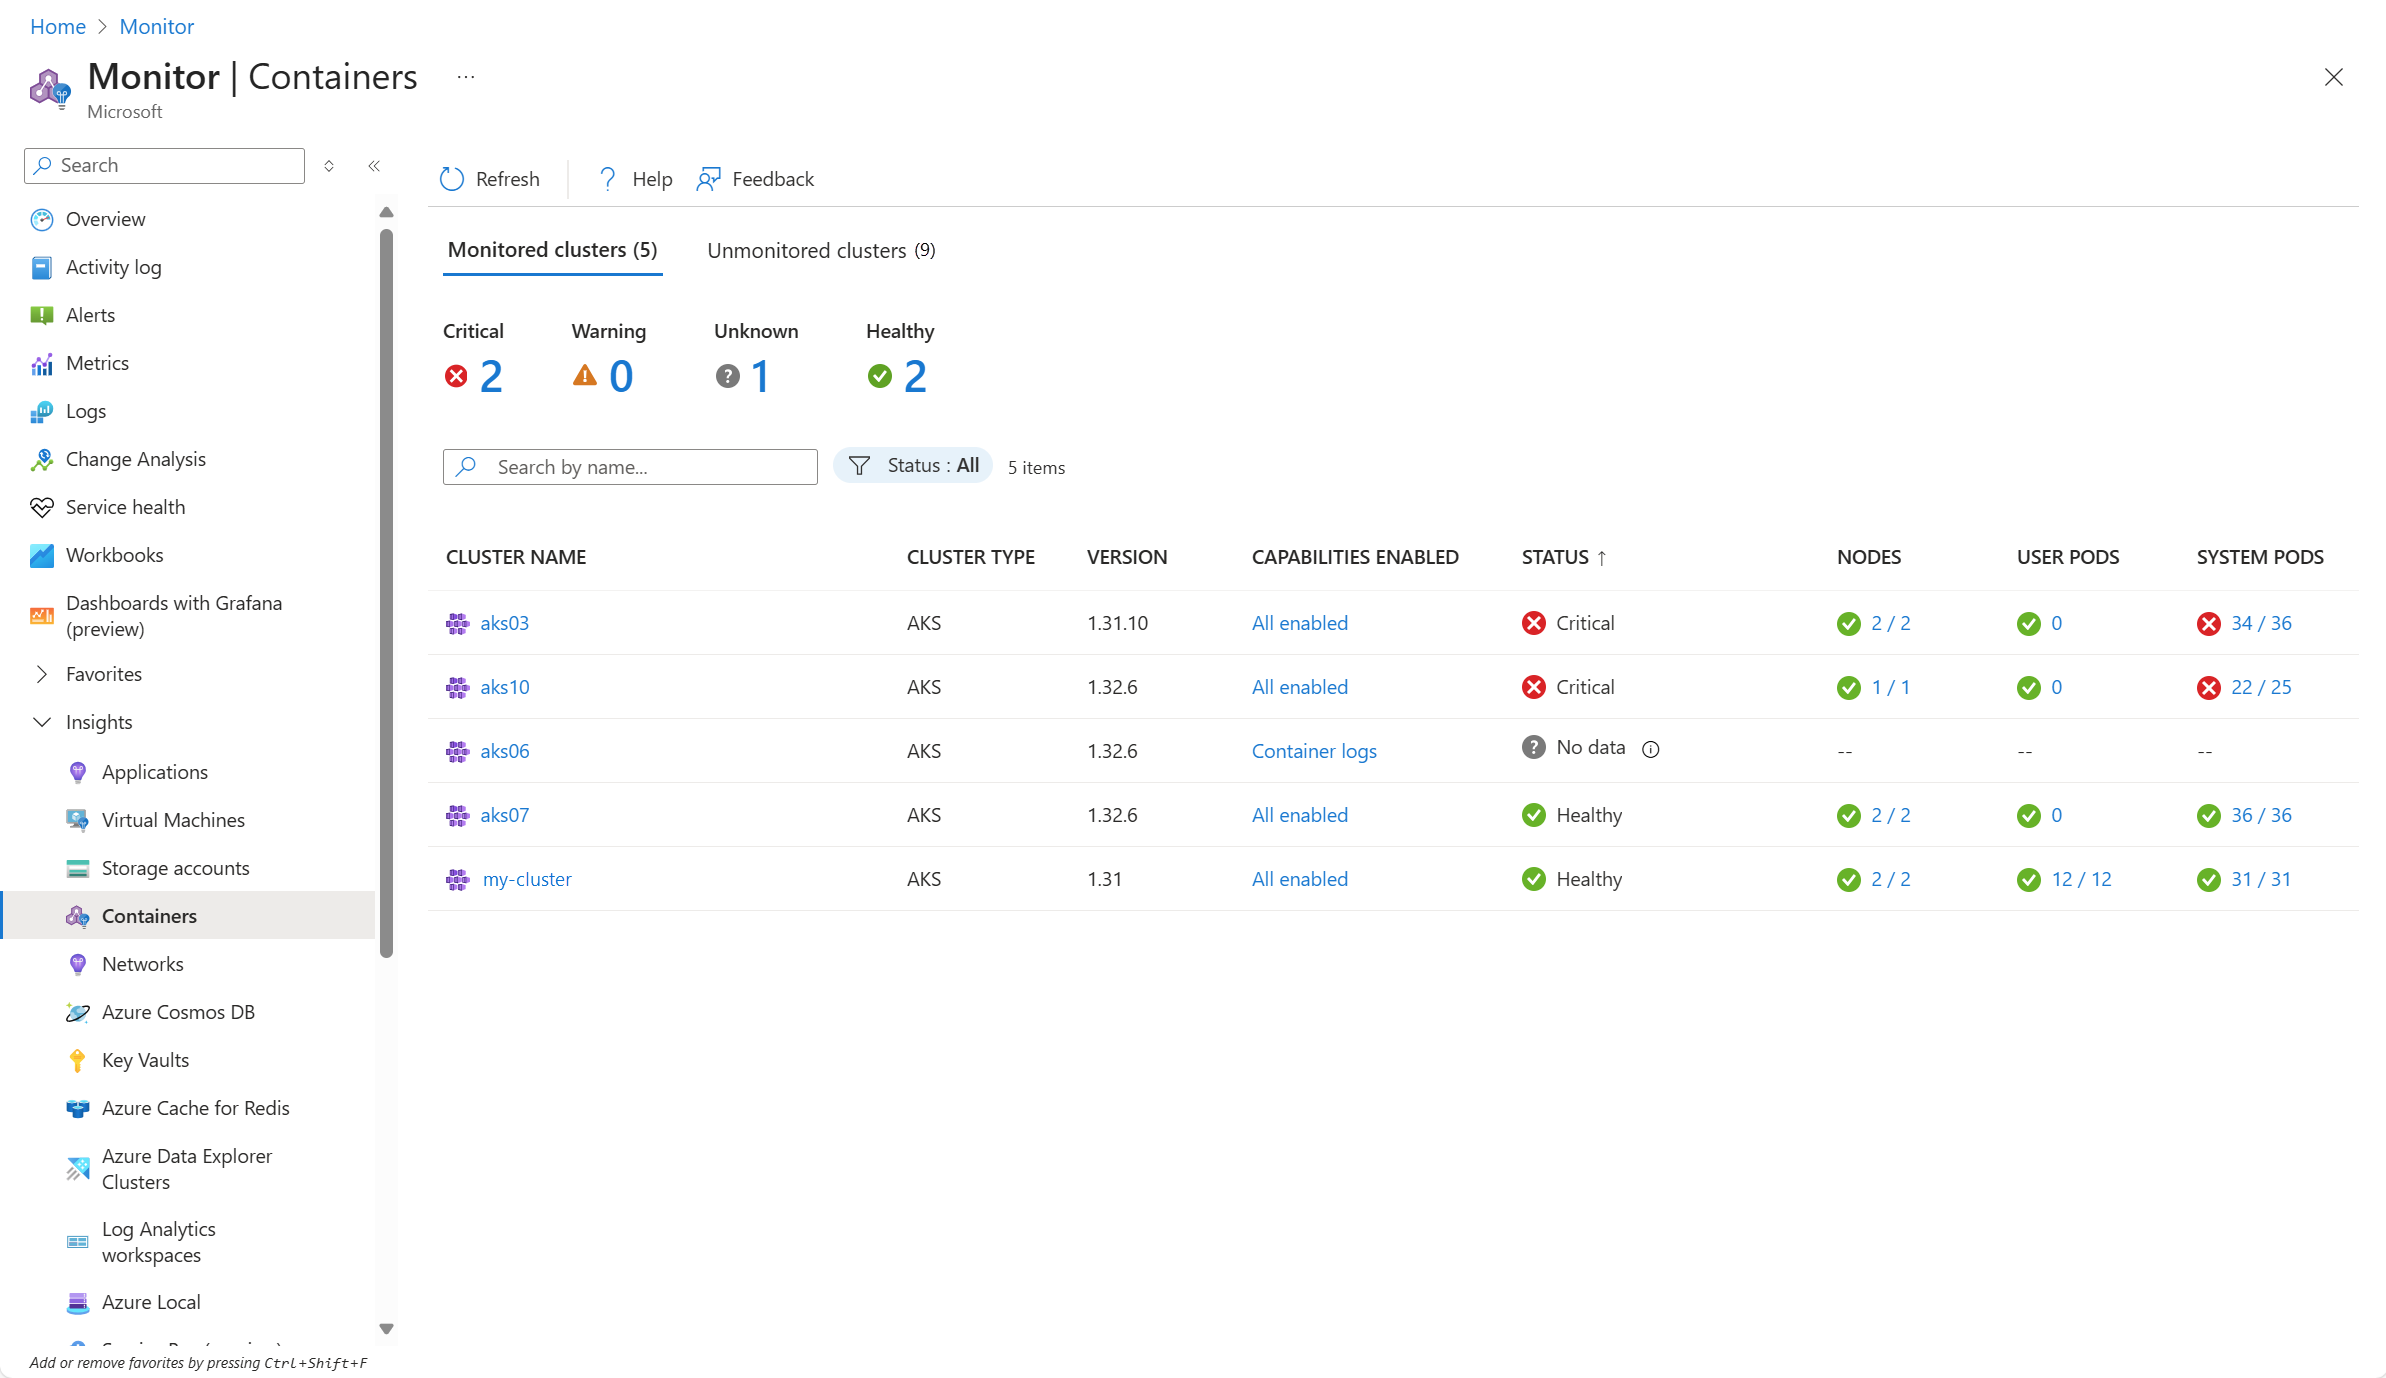
In addition to viewing the monitoring data for a single cluster, Container insights provides a multi-cluster view that aggregates the monitoring data for all of your clusters into a single view. In addition to viewing a high level summary of the health and performance of all of your clusters, you can enable monitoring for clusters that haven't yet been onboarded and add features to clusters that have only been partially configured.
To view the multi-cluster experience, go to the Monitor menu and select Containers click on Container insights in the left navigation pane of the Azure portal. This will open the multi-cluster experience which shows all of your clusters that have been onboarded to Container insights.
Next steps
- See Analyze Kubernetes cluster data with Container insights to learn how to analyze the data collected by Container insights.
