Note
Access to this page requires authorization. You can try signing in or changing directories.
Access to this page requires authorization. You can try changing directories.
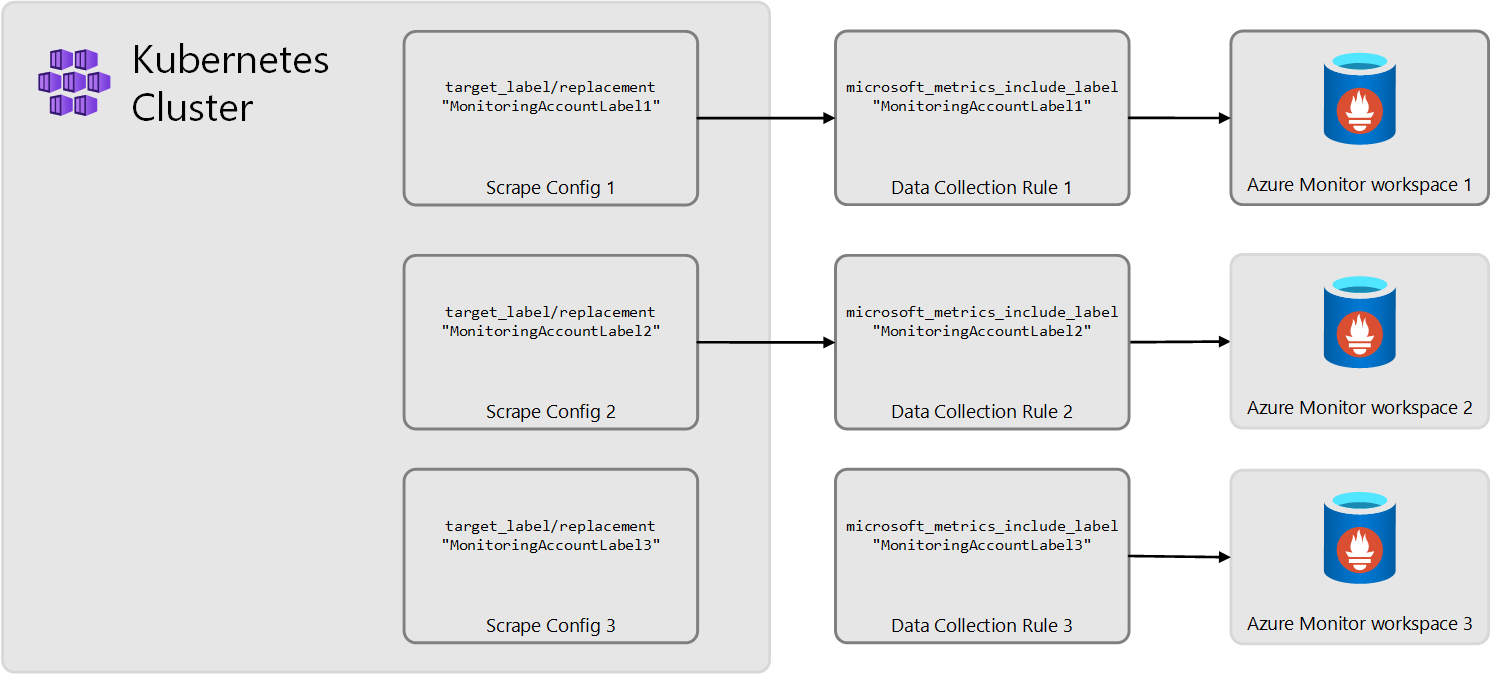
When you enable collection of Prometheus metrics from your Kubernetes cluster, data is sent to an Azure Monitor workspace. There may be scenarios where you want to send different sets of metrics to different Azure Monitor workspaces. For example, you may have different teams responsible for different applications running in the same cluster, and each team requires their own Azure Monitor workspace.
Overview
You can achieve this functionality using a combination of ConfigMap and data collection rules (DCRs) for the cluster. Create scrape configs in ConfigMap that define each set of metrics to be collected, and add a label to each config that uniquely identifies the set. Then create a DCR that accepts data for a particular label and routes that data to the appropriate Azure Monitor workspace. This strategy is illustrated in the following diagram and described in detail in the rest of the article.
Note
This article uses ARM templates to create the required Azure Monitor objects, but you can use any other valid methods such as CLI or PowerShell.
Create scrape configs in ConfigMap
Start by defining the different sets of metrics that you want to collect from the cluster. Use the ConfigMap template at ama-metrics-prometheus-config and add a scrape config job for each set of metrics you want to collect. Add a relabel_configs section to each with the pre-defined label microsoft_metrics_account to each scrape config to give it a unique identifier. This value is used by each DCR to identify the data it's intended to route.
The following example shows a scrape config identified with the value MonitoringAccountLabel2.
relabel_configs:
- target_label: microsoft_metrics_account
  action: replace
  replacement: "MonitoringAccountLabel2"
Create DCRs
Once you have your ConfigMaps defined, you need a DCR for each scrape config. Each DCR will look for the label you defined in the ConfigMap and route the data to the appropriate Azure Monitor workspace. There are multiple methods to edit and create DCRs as described in Create data collection rules (DCRs) in Azure Monitor. You can start by editing the DCR created when you onboarded the cluster and then use that as a template for the others.
To identify the data to be routed, use the labelIncludeFilter property in the prometheusForwarder section of the DCR. The following example shows a DCR that routes data with the label MonitoringAccountLabel1.
  "prometheusForwarder": [
      {
          "streams": [
              "Microsoft-PrometheusMetrics"
          ],
          "labelIncludeFilter": {
              "microsoft_metrics_include_label": "MonitoringAccountLabel1"
          },
          "name": "PrometheusDataSource"
      }
  ]
Associate the DCRs with the cluster
Once the new DCRs are created, they need to be associated with the cluster using any of the methods described in Manage data collection rule associations in Azure Monitor
Example
Consider a scenario where you want to separate the data for two different applications running in the same cluster. The applications are identified with "MonitoringAccountLabel1" and "MonitoringAccountLabel2".
Scrape config
The following yaml defines the two different jobs that each collect metrics from a different application.
The values in source_labels and regex identify the unique metrics that should be included in each job, and the value in replacement is the unique label that identifies the job to the DCRs.
scrape_configs:
- job_name: prometheus_ref_app_1
  kubernetes_sd_configs:
    - role: pod
  relabel_configs:
    - source_labels: [__meta_kubernetes_pod_label_app]
      action: keep
      regex: "prometheus-reference-app-1"
    - target_label: microsoft_metrics_account
      action: replace
      replacement: "MonitoringAccountLabel1"
- job_name: prometheus_ref_app_2
  kubernetes_sd_configs:
    - role: pod
  relabel_configs:
    - source_labels: [__meta_kubernetes_pod_label_app]
      action: keep
      regex: "prometheus-reference-app-2"
    - target_label: microsoft_metrics_account
      action: replace
      replacement: "MonitoringAccountLabel2"
DCRs
The first DCR is an edited version of the DCR created when the cluster was onboarded. The only change is to add the label filter for application 1. Since the Log Analytics workspaces are in the same region, separate data collection endpoints aren't required, and the same endpoint is used in both DCRs.
DCR 1
{
  "properties": {
      "dataCollectionEndpointId": "/subscriptions/my-subscription/resourceGroups/my-resource-group/providers/Microsoft.Insights/dataCollectionEndpoints/my-endpoint",
      "dataSources": {
          "prometheusForwarder": [
              {
                  "streams": [
                      "Microsoft-PrometheusMetrics"
                  ],
                  "labelIncludeFilter": {
                      "microsoft_metrics_include_label": "MonitoringAccountLabel1"
                  },
                  "name": "PrometheusDataSource"
              }
          ]
      },
      "destinations": {
          "monitoringAccounts": [
              {
                  "accountResourceId": "/subscriptions/my-subscription/resourceGroups/my-resource-group/providers/Microsoft.Insights/dataCollectionEndpoints/my-workspace-01",
                  "name": "MonitoringAccount"
              }
          ]
      },
      "dataFlows": [
          {
              "streams": [
                  "Microsoft-PrometheusMetrics"
              ],
              "destinations": [
                  "MonitoringAccount"
              ]
          }
      ]
  }
}
The second DCR is a copy of the first with two changes. the label filter is updated to match application 2, and the destination workspace is changed to a different workspace.
DCR 2
{
  "properties": {
      "dataCollectionEndpointId": "/subscriptions/my-subscription/resourceGroups/my-resource-group/providers/Microsoft.Insights/dataCollectionEndpoints/my-endpoint",
      "dataSources": {
          "prometheusForwarder": [
              {
                  "streams": [
                      "Microsoft-PrometheusMetrics"
                  ],
                  "labelIncludeFilter": {
                      "microsoft_metrics_include_label": "MonitoringAccountLabel2"
                  },
                  "name": "PrometheusDataSource"
              }
          ]
      },
      "destinations": {
          "monitoringAccounts": [
              {
                  "accountResourceId": "/subscriptions/my-subscription/resourceGroups/my-resource-group/providers/Microsoft.Insights/dataCollectionEndpoints/my-workspace-02",
                  "name": "MonitoringAccount"
              }
          ]
      },
      "dataFlows": [
          {
              "streams": [
                  "Microsoft-PrometheusMetrics"
              ],
              "destinations": [
                  "MonitoringAccount"
              ]
          }
      ]
  }
}
