Note
Access to this page requires authorization. You can try signing in or changing directories.
Access to this page requires authorization. You can try changing directories.
This article shows you how to create and delete an Azure Monitor workspace. When you configure Azure Monitor managed service for Prometheus, you can select an existing Azure Monitor workspace or create a new one.
Note
When you create an Azure Monitor workspace, by default a data collection rule and a data collection endpoint in the form <azure-monitor-workspace-name> will automatically be created in a resource group in the form MA_<azure-monitor-workspace-name>_<location>_managed. In case there are any Azure policies with restrictions on resource or resource group names, create an exemption to exempt these resources from evaluation.
Create an Azure Monitor workspace
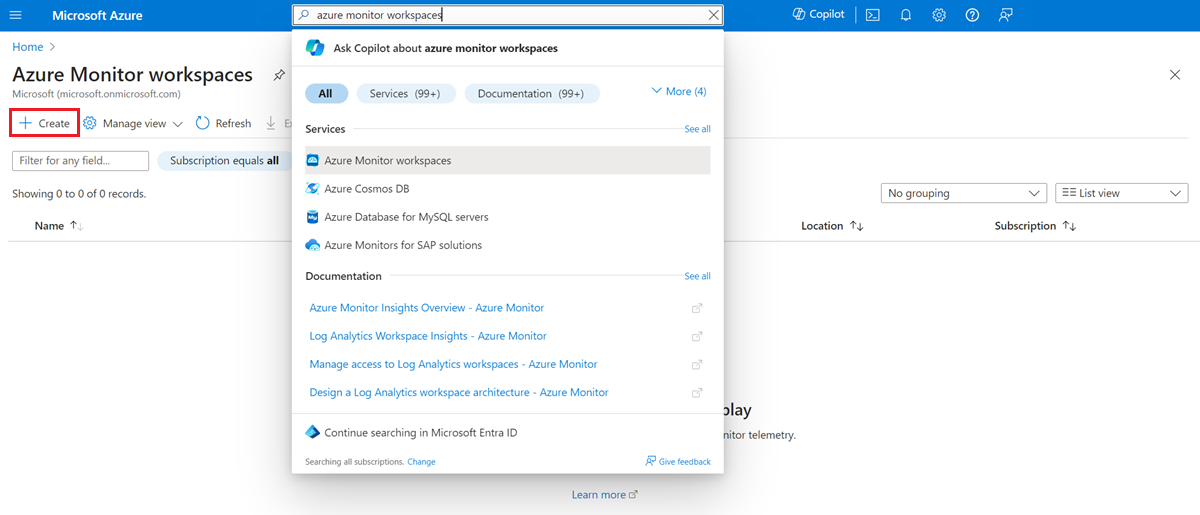
Open the Azure Monitor workspaces menu in the Azure portal.
Select Create.
On the Create an Azure Monitor Workspace page, select a Subscription and Resource group where the workspace is to be created.
Provide a Name and a Region for the workspace.
Select Review + create to create the workspace.

When you create an Azure Monitor workspace, a new resource group is created. The resource group name has the following format: MA_<azure-monitor-workspace-name>_<location>_managed, where the tokenized elements are lowercased. The resource group contains both a data collection endpoint and a data collection rule with the same name as the workspace. The resource group and its resources are automatically deleted when you delete the workspace.
To connect your Azure Monitor managed service for Prometheus to your Azure Monitor workspace, see Collect Prometheus metrics from AKS cluster
Tip
We recommend that you enable recommended alerts for your Azure Monitor Workspace to monitor the ingestion limits and quotas. To enable the recommended alerts, see here.
Access mode
Similar to Log Analytics workspace, Azure Monitor Workspaces offer a resource-context access mode to enable more granular Azure RBAC resource-permissions for users querying data in a workspace. This provides the following benefits:
- Users do not need to know which workspace to query for the metrics they've scoped their query to
- Users do not need direct access to the workspace(s) storing the metrics for their resources
Read more about how to manage the workspace Access Mode here.
Delete an Azure Monitor workspace
When you delete an Azure Monitor workspace, unlike with a Log Analytics workspace, there's no soft delete operation. The data in the workspace is immediately deleted, and there's no recovery option.
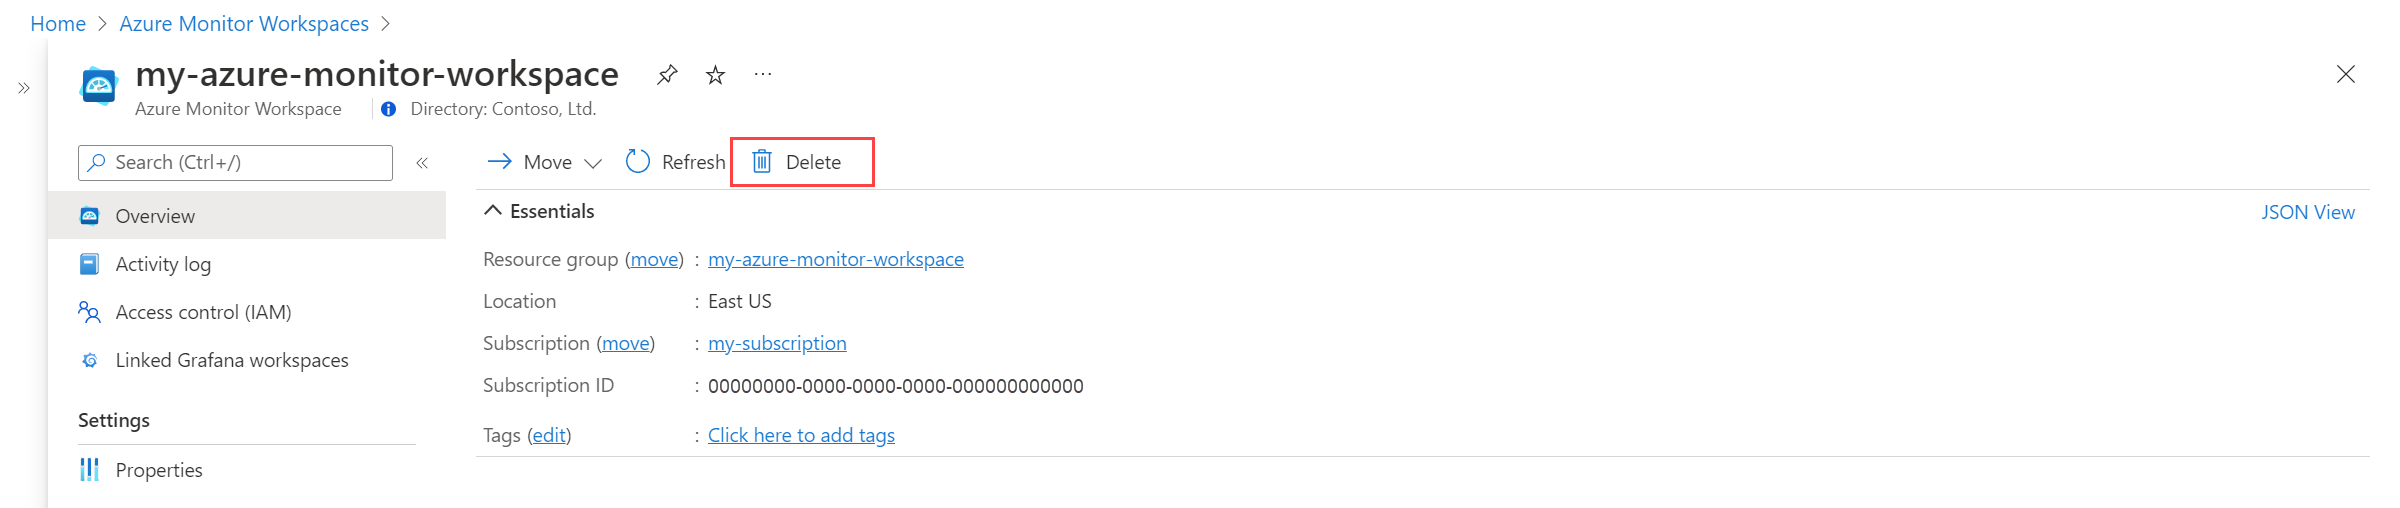
Open the Azure Monitor workspaces menu in the Azure portal.
Select your workspace.
Select Delete.

Link a Grafana workspace
Connect an Azure Monitor workspace to an Azure Managed Grafana workspace to allow Grafana to use the Azure Monitor workspace data in a Grafana dashboard. An Azure Monitor workspace can be connected to multiple Grafana workspaces, and a Grafana workspace can be connected to multiple Azure Monitor workspaces. Azure Managed Grafana and your Azure Monitor workspace can be in different regions.
To link your self-managed Grafana instance to an Azure Monitor workspace, see Connect Grafana to Azure Monitor Prometheus metrics
Note
When you add the Azure Monitor workspace as a data source to Grafana, it's listed in as Prometheus_<azure monitor workspace query endpoint>.
- Open the Azure Monitor workspace menu in the Azure portal.
- Select your workspace.
- Select Linked Grafana workspaces.
- Select a Grafana workspace.
Next steps
- Learn more about the Azure Monitor data platform.
- Azure Monitor workspace overview.