Send Prometheus metrics from virtual machines, scale sets, or Kubernetes clusters to an Azure Monitor workspace
Prometheus isn't limited to monitoring Kubernetes clusters. Use Prometheus to monitor applications and services running on your servers, wherever they're running. For example, you can monitor applications running on virtual machines, virtual machine scale sets, or even on-premises servers. You can also send Prometheus metrics to an Azure Monitor workspace from your self-managed cluster and Prometheus server.
This article explains how to configure remote write to send data from a self-managed Prometheus instance to an Azure Monitor workspace.
Self-managed Prometheus can run in Azure and non-Azure environments. The following are authentication options for remote write to an Azure Monitor workspace, based on the environment where Prometheus is running.
Use user-assigned managed identity authentication for services running self-managed Prometheus in an Azure environment. Azure-managed services include:
- Azure Virtual Machines
- Azure Virtual Machine Scale Sets
- Azure Kubernetes Service (AKS)
To set up remote write for Azure-managed resources, see Remote write using user-assigned managed identity authentication later in this article.
If you have virtual machines or a Kubernetes cluster in non-Azure environments, or you onboarded to Azure Arc, install self-managed Prometheus and configure remote write by using Microsoft Entra application authentication. For more information, see Remote write using Microsoft Entra application authentication later in this article.
Onboarding to Azure Arc-enabled servers allows you to manage and configure non-Azure virtual machines in Azure. For more information, see Azure Arc-enabled servers and Azure Arc-enabled Kubernetes. Azure Arc-enabled servers support only Microsoft Entra authentication.
Note
System-assigned managed identities aren't supported for remote write to Azure Monitor workspaces. Use a user-assigned managed identity or Microsoft Entra application authentication.
- Prometheus versions later than 2.45 are required for managed identity authentication.
- Prometheus versions later than 2.48 are required for Microsoft Entra application authentication.
This article covers sending Prometheus metrics to an Azure Monitor workspace. To create an Azure monitor workspace, see Manage an Azure Monitor workspace.
Administrator permissions for the cluster or resource are required to complete the steps in this article.
Depending on the environment where Prometheus is running, you can configure remote write to use a user-assigned managed identity or Microsoft Entra application authentication to send data to an Azure Monitor workspace.
Use the Azure portal or the Azure CLI to create a user-assigned managed identity or Microsoft Entra application.


You can use Microsoft Entra application authentication in any environment. If your Prometheus service is running in an Azure-managed environment, consider using user-assigned managed identity authentication.
To configure remote write to an Azure Monitor workspace by using a Microsoft Entra application, create a Microsoft Entra application. On the Azure Monitor workspace's data collection rule, assign the Monitoring Metrics Publisher role to the Microsoft Entra application.
Note
Your Microsoft Entra application uses a client secret or password. Client secrets have an expiration date. Make sure to create a new client secret before it expires so you don't lose authenticated access.
To create a Microsoft Entra ID application by using the portal, see Register an application with Microsoft Entra ID and create a service principal.
After you create your Microsoft Entra application, get the client ID and generate a client secret:
In the list of applications, copy the Client ID value for the registered application. This value is used in the Prometheus remote write configuration as the value for
client_id.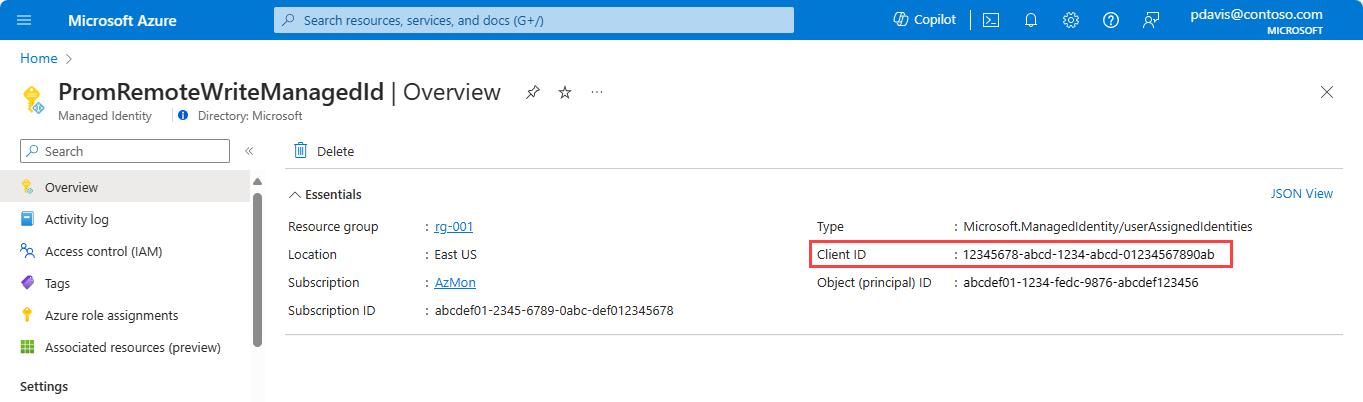
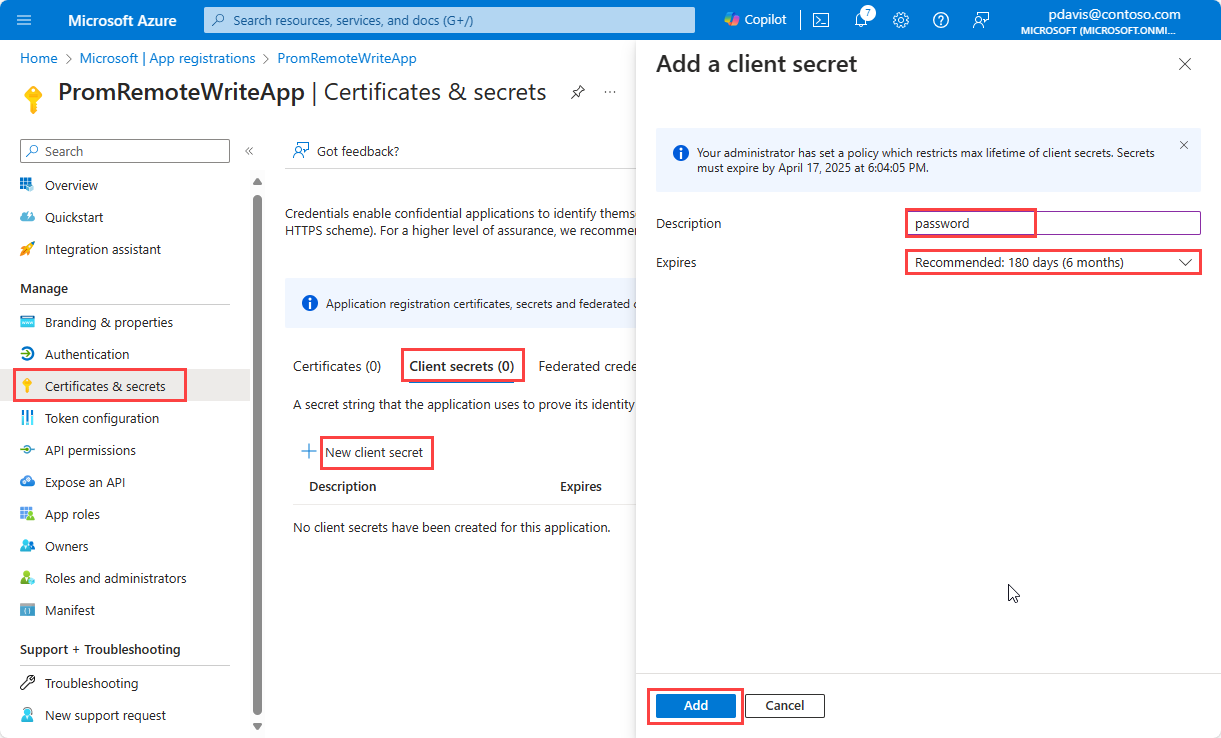
Select Certificates & secrets.
Select Client secrets, and then select New client secret to create a secret.
Enter a description, set the expiration date, and then select Add.
Copy the value of the secret securely. The value is used in the Prometheus remote write configuration as the value for
client_secret. The client secret value is visible only when it's created, and you can't retrieve it later. If you lose it, you must create a new one.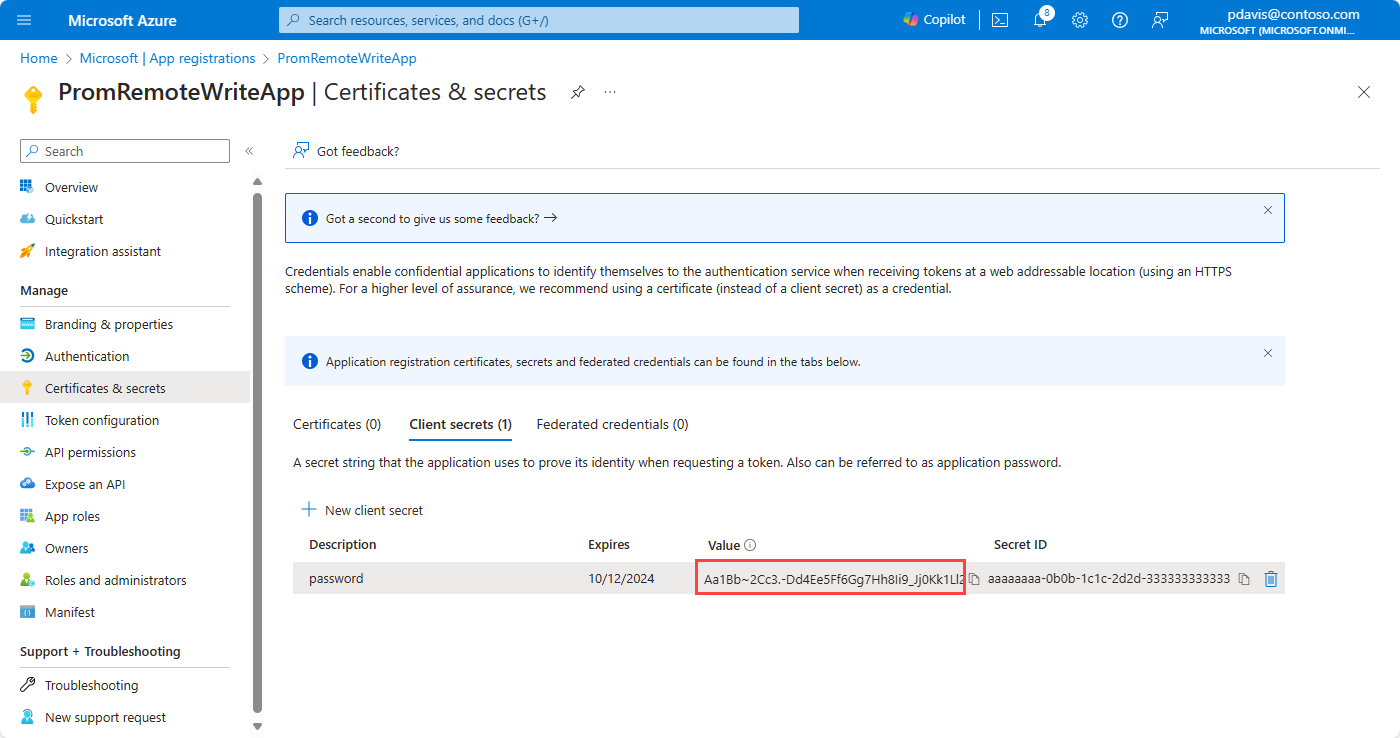


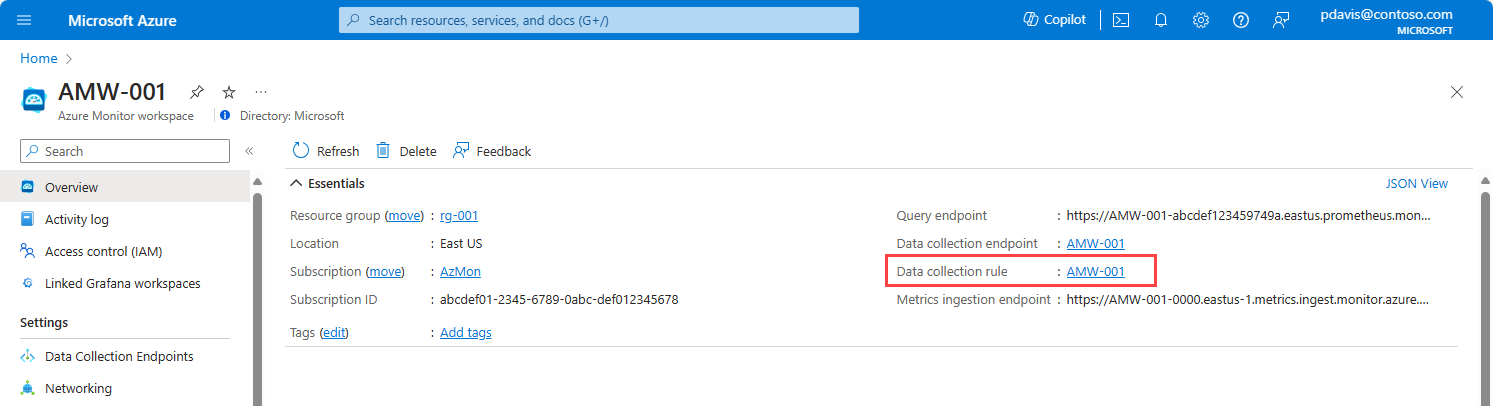
Assign the Monitoring Metrics Publisher role on the workspace's data collection rule to the application:
On the Azure Monitor workspace's overview pane, select the Data collection rule link.
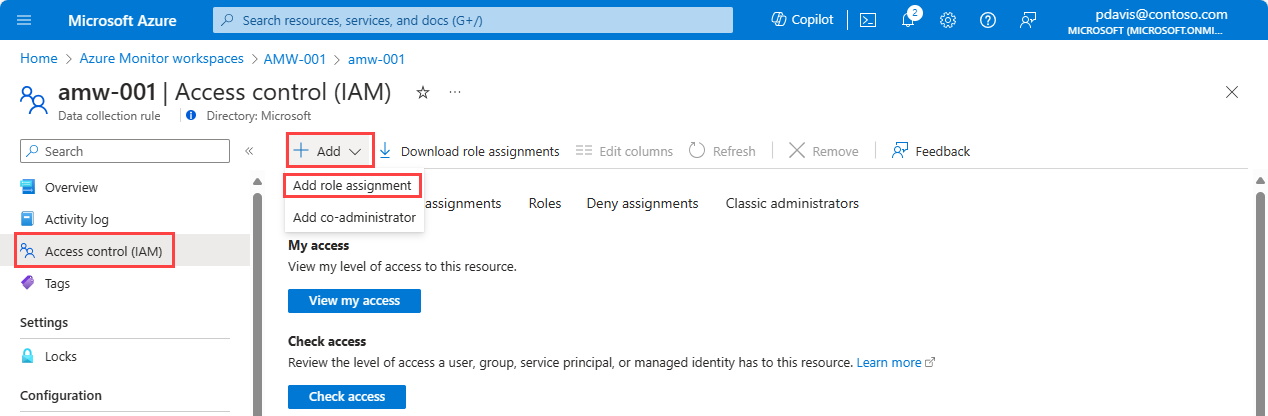
On the page for the data collection rule, select Access control (IAM).
Select Add, and then select Add role assignment.
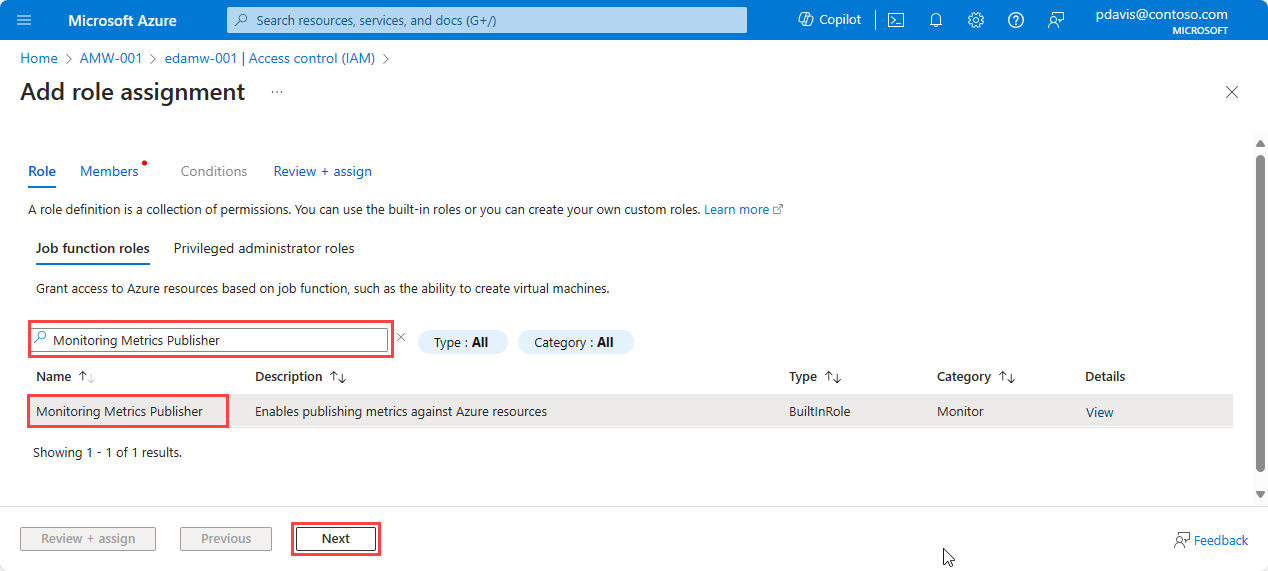
Select the Monitoring Metrics Publisher role, and then select Next.
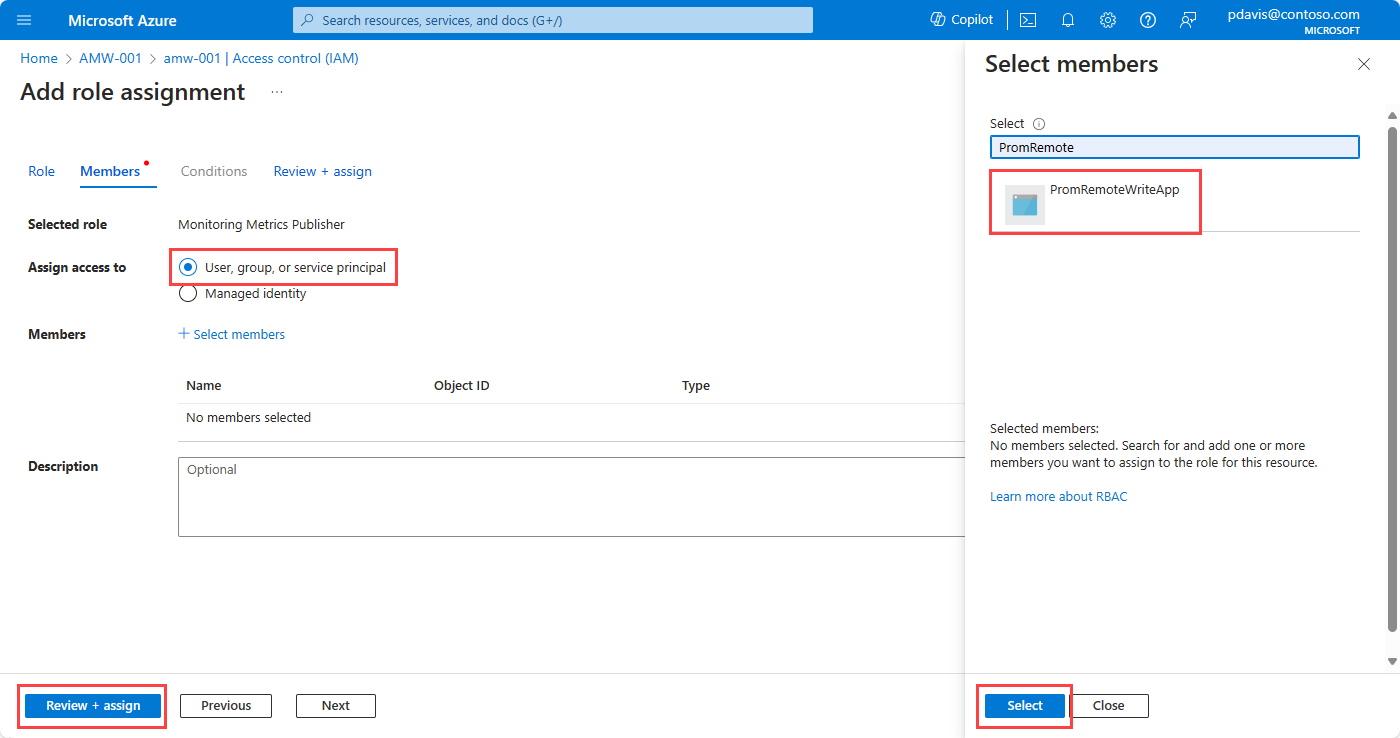
Select User, group, or service principal, and then choose Select members. Select the application that you created, and then choose Select.
To complete the role assignment, select Review + assign.

Remote write is configured in the Prometheus configuration file prometheus.yml or in Prometheus Operator.
For more information on configuring remote write, see this Prometheus.io article: Configuration. For information on tuning the remote write configuration, see Remote write tuning.
- Configure remote write for Prometheus running on virtual machines
- Configure remote write on Kubernetes for Prometheus Operator
To send data to your Azure Monitor workspace, add the following section to the configuration file (prometheus.yml) of your self-managed Prometheus instance:
remote_write:
  - url: "<metrics ingestion endpoint for your Azure Monitor workspace>"
# Microsoft Entra ID configuration.
# The Azure cloud. Options are 'AzurePublic', 'AzureChina', or 'AzureGovernment'.
    azuread:
      cloud: 'AzurePublic'
      managed_identity:
        client_id: "<client-id of the managed identity>"
      oauth:
        client_id: "<client-id from the Entra app>"
        client_secret: "<client secret from the Entra app>"
        tenant_id: "<Azure subscription tenant Id>"
The url parameter specifies the metrics ingestion endpoint of the Azure Monitor workspace. You can find it on the overview pane for your Azure Monitor workspace in the Azure portal.

Use either managed_identity or oauth for Microsoft Entra application authentication, depending on your implementation. Remove the object that you're not using.
Find your client ID for the managed identity by using the following Azure CLI command:
az identity list --resource-group <resource group name>
For more information, see az identity list.
To find your client for managed identity authentication in the portal, go to Managed Identities in the Azure portal and select the relevant identity name. Copy the value of Client ID from the managed identity's Overview pane.

To find the client ID for the Microsoft Entra ID application, use the following Azure CLI command (or see the first step in the earlier Remote write using Microsoft Entra application authentication section):
$ az ad app list --display-name < application name>
For more information, see az ad app list.
Note
After you edit the configuration file, restart Prometheus to apply the changes.
Use the following methods to verify that Prometheus data is being sent to your Azure Monitor workspace.
To check if the metrics are flowing to the Azure Monitor workspace, from your Azure Monitor workspace in the Azure portal, select Metrics. Use metrics explorer with Prometheus Query Language (PromQL) to query the metrics that you're expecting from the self-managed Prometheus environment. For more information, see Azure Monitor metrics explorer with PromQL.
Prometheus explorer provides a convenient way to interact with Prometheus metrics within your Azure environment, so that monitoring and troubleshooting are more efficient. To use Prometheus explorer, go to your Azure Monitor workspace in the Azure portal and select Prometheus Explorer. You can then query the metrics that you're expecting from the self-managed Prometheus environment.
For more information, see Query Prometheus metrics using Azure workbooks.
Use PromQL queries in Grafana to verify that the results return the expected data. To configure Grafana, see the article about getting Grafana set up with managed Prometheus.
If remote data isn't appearing in your Azure Monitor workspace, see Troubleshoot remote write for common problems and solutions.