Note
Access to this page requires authorization. You can try signing in or changing directories.
Access to this page requires authorization. You can try changing directories.
The Log Analytics tool in the Azure portal lets you run and edit log queries against data in the Azure Monitor Logs store. It offers two modes that make log data simpler to explore and analyze for both basic and advanced users:
Simple mode provides the most commonly used Azure Monitor Logs functionality in an intuitive, spreadsheet-like experience. Just point and click to filter, sort, and aggregate data to get to the insights you need most of the time.
KQL mode gives advanced users the full power of Kusto Query Language (KQL) to derive deeper insights from their logs using the Log Analytics query editor.
Whether you work with the results of your queries interactively or use them with other Azure Monitor features, such as log search alerts or workbooks. Log Analytics is the tool that you use to write and test them.
This article describes the Log Analytics user interface and its features. If you want to jump right into a tutorial, see Log Analytics tutorial.
Open Log Analytics
To open Log Analytics in the Azure portal, select Logs either in Azure Monitor, in a Log Analytics workspace, or from a specific resource. The tool is always the same, but where you start determines the data that's available.
When you open Logs from Azure Monitor or a Log Analytics workspaces, you have access to all of the records in a workspace. When you select Logs from another type of resource, your data is limited to log data for that resource. For more information, see Log query scope and time range in Azure Monitor Log Analytics.
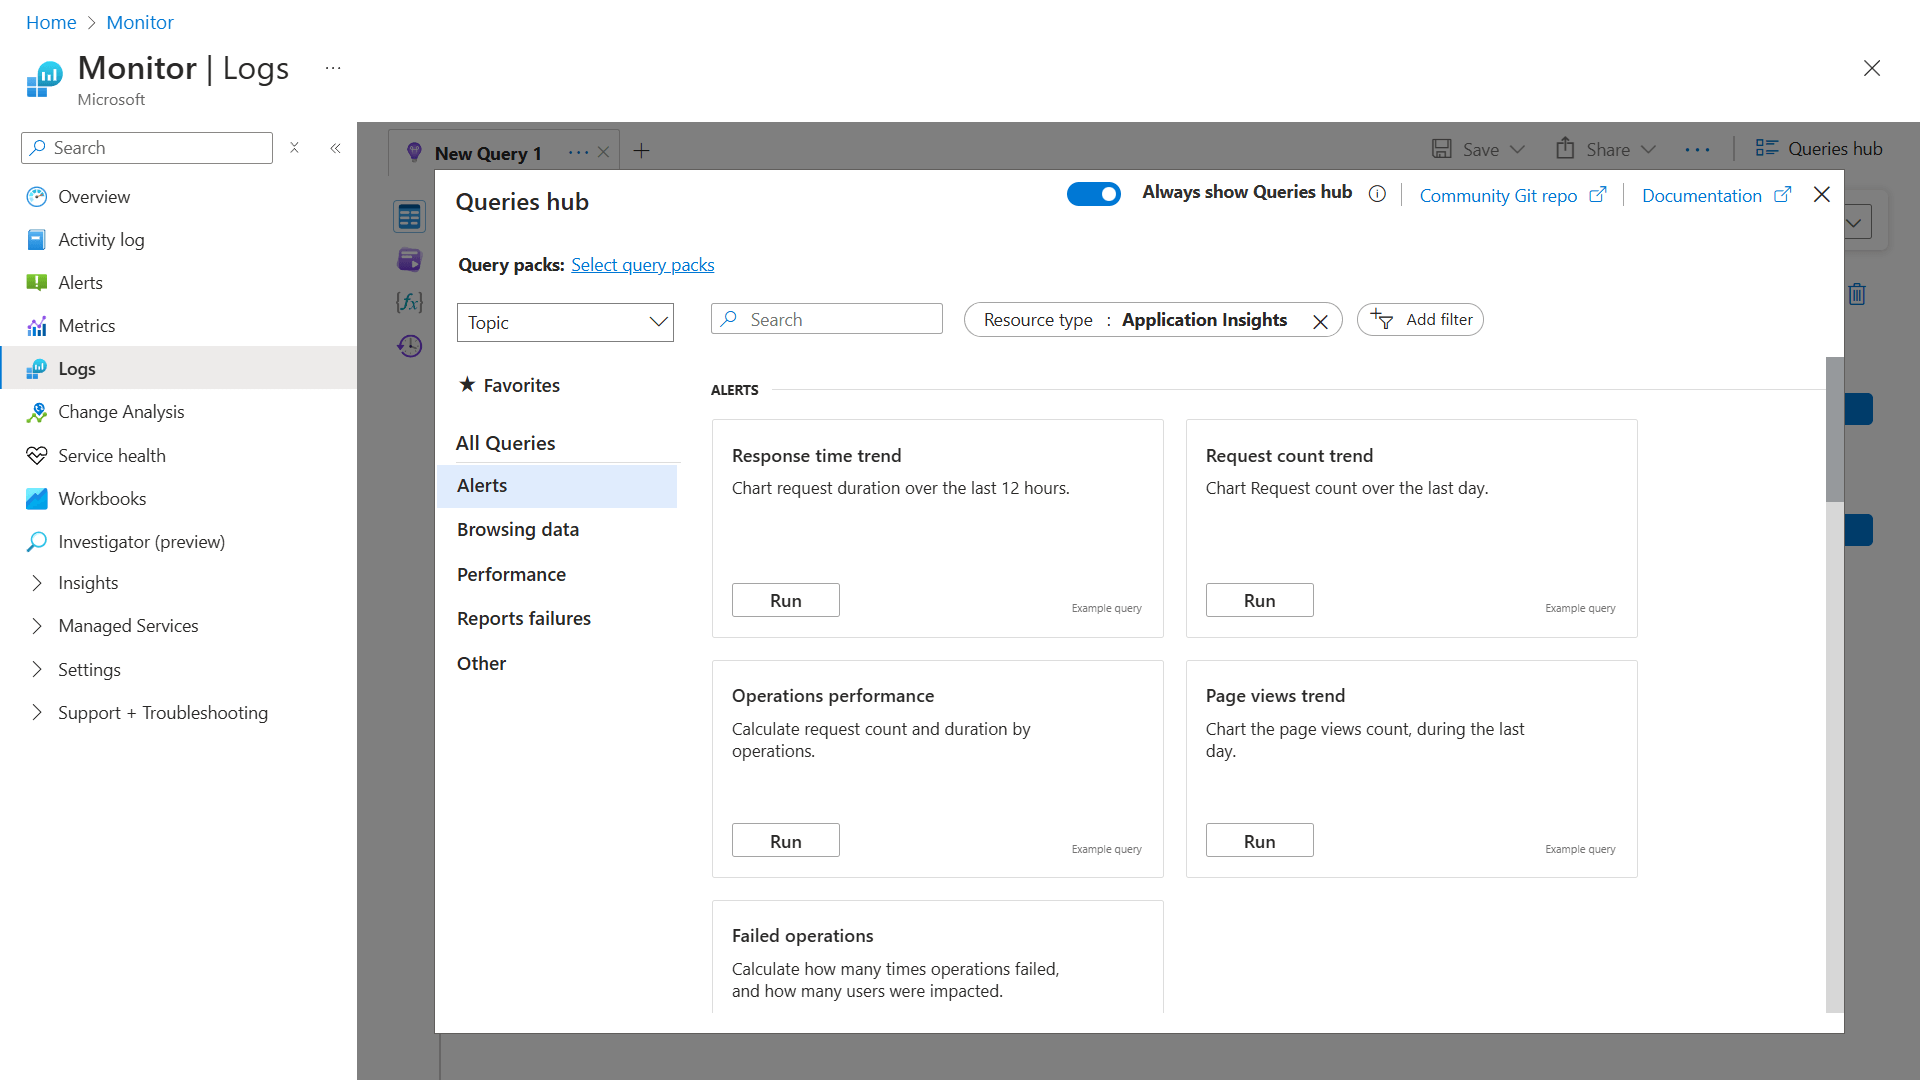
When you start Log Analytics, a dialog appears that contains example queries. The queries are categorized by solution. Browse or search for queries that match your requirements. You might find one that does exactly what you need. You can also load one to the editor and modify it as required. Browsing through example queries is a good way to learn how to write your own queries.
If you want to start with an empty script and write it yourself, close the example queries. If you want to access the example queries again, select Queries hub at the top of the screen or through the left sidebar.
Log Analytics interface
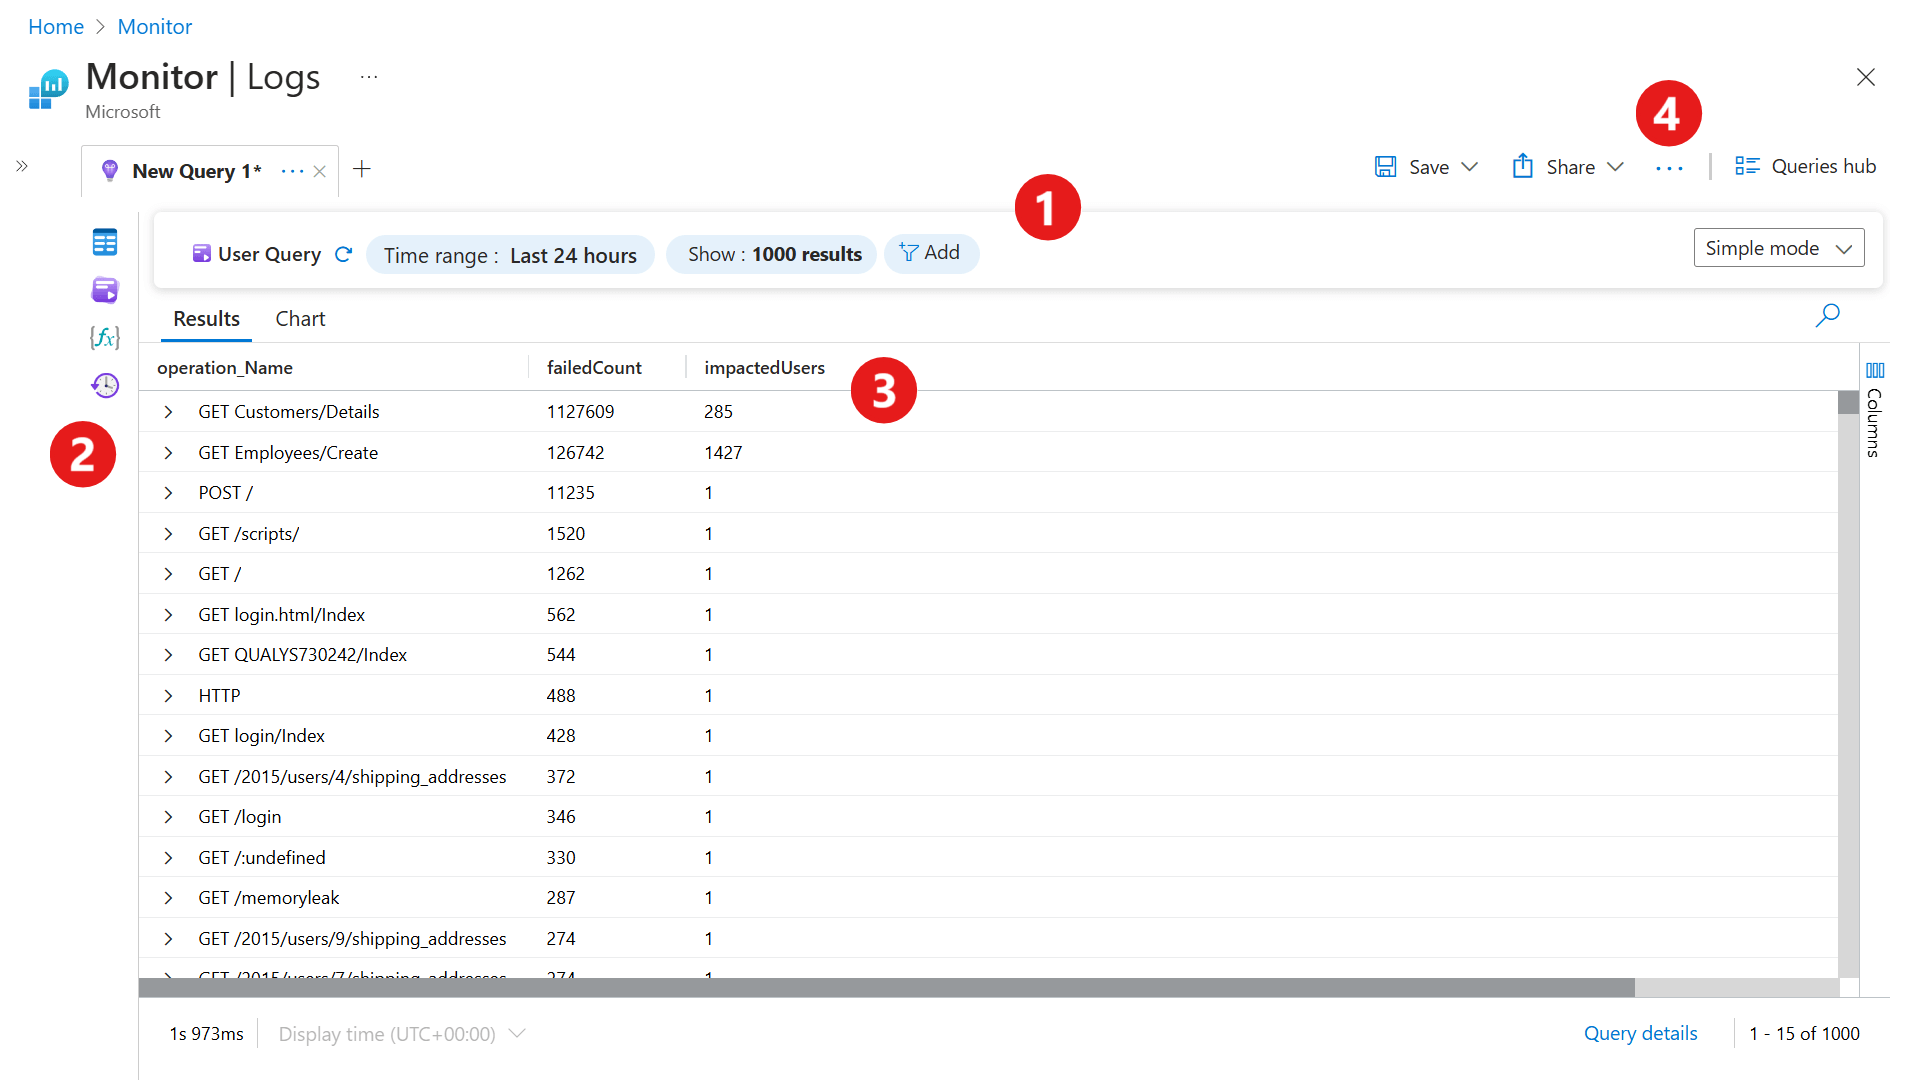
The following image identifies four Log Analytics components in simple mode:
Top action bar
In simple mode, the top bar has controls for working with data and switching to KQL mode.
| Option | Description |
|---|---|
| Time range | Select the time range for the data available to the query. In KQL mode, if you set a different time range in your query, the time range you set in the time picker is overridden. |
| Show | Configure the number of entries Log Analytics retrieves in simple mode. The default limit is 1000. For more information on query limits, see Configure query results limit. |
| Add | Add filters, and apply simple mode operators, as described in Explore and analyze data in simple mode. |
| Simple/KQL mode | Switch between Simple and KQL mode. |
Note
In simple mode, the top action bar doesn't include a Run button. The results update automatically as the user refines the query.
Left sidebar
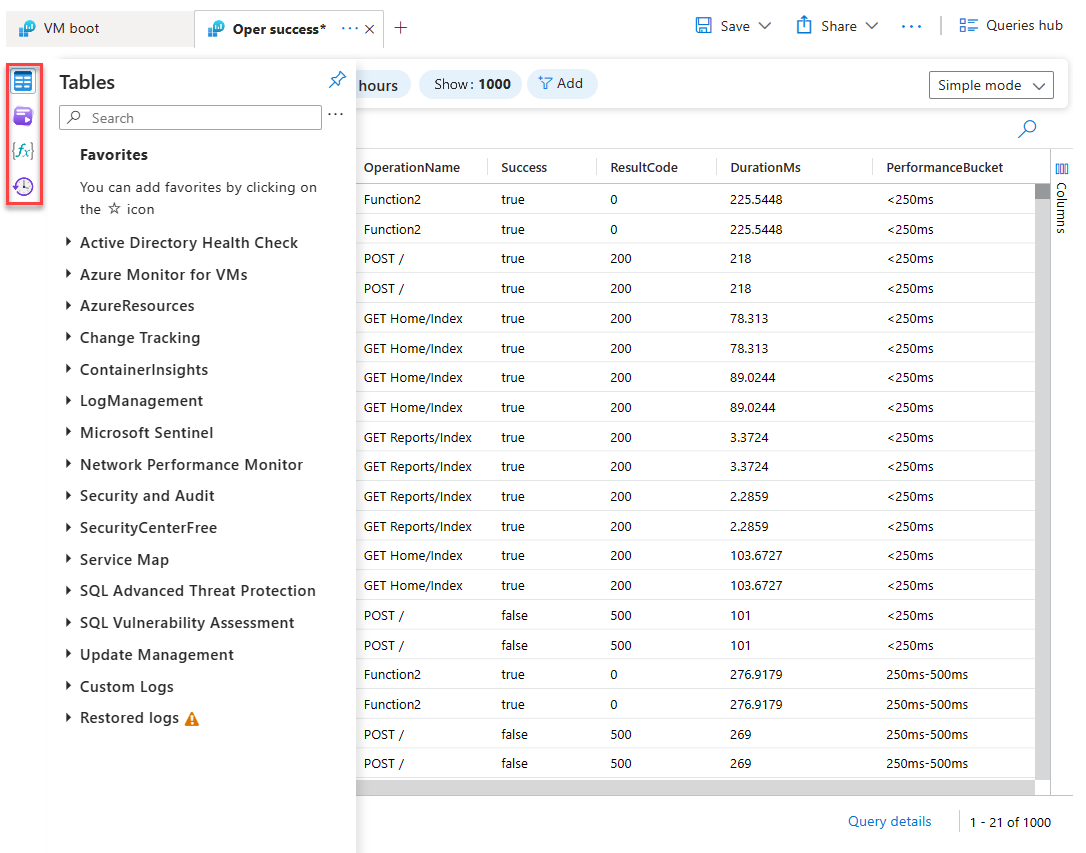
The collapsible left pane gives you access to tables, example and saved queries, functions, and query history.
Pin the left pane to keep it open while you work, or maximize your query window by selecting an icon from the left pane only when you need it.
| Option | Description |
|---|---|
| Tables | Lists the tables that are part of the selected scope. Hover over a table name to view the table's description and a link to its documentation. Expand a table to view its columns. Select a table to run a preview on it. |
| Queries | Lists example and saved queries. This is the same list that's in the Queries hub. Open the context menu [...] next to the search bar and select Group by to change the grouping of the queries. Hover over a query to view the query's description. Select a query to run it. |
| Functions | Lists functions, which allow you to reuse predefined query logic in your log queries. |
| Query history | Lists your query history. Select a query to rerun it. |
Note
The Tables view doesn't show empty tables by default.
To change that for the current session, open the context menu
...next to the search bar, then select Show tables with no data.To show or hide empty tables permanently, open the context menu
...above the top action bar, select Log Analytics settings, toggle Show tables with no data, and Save your changes.
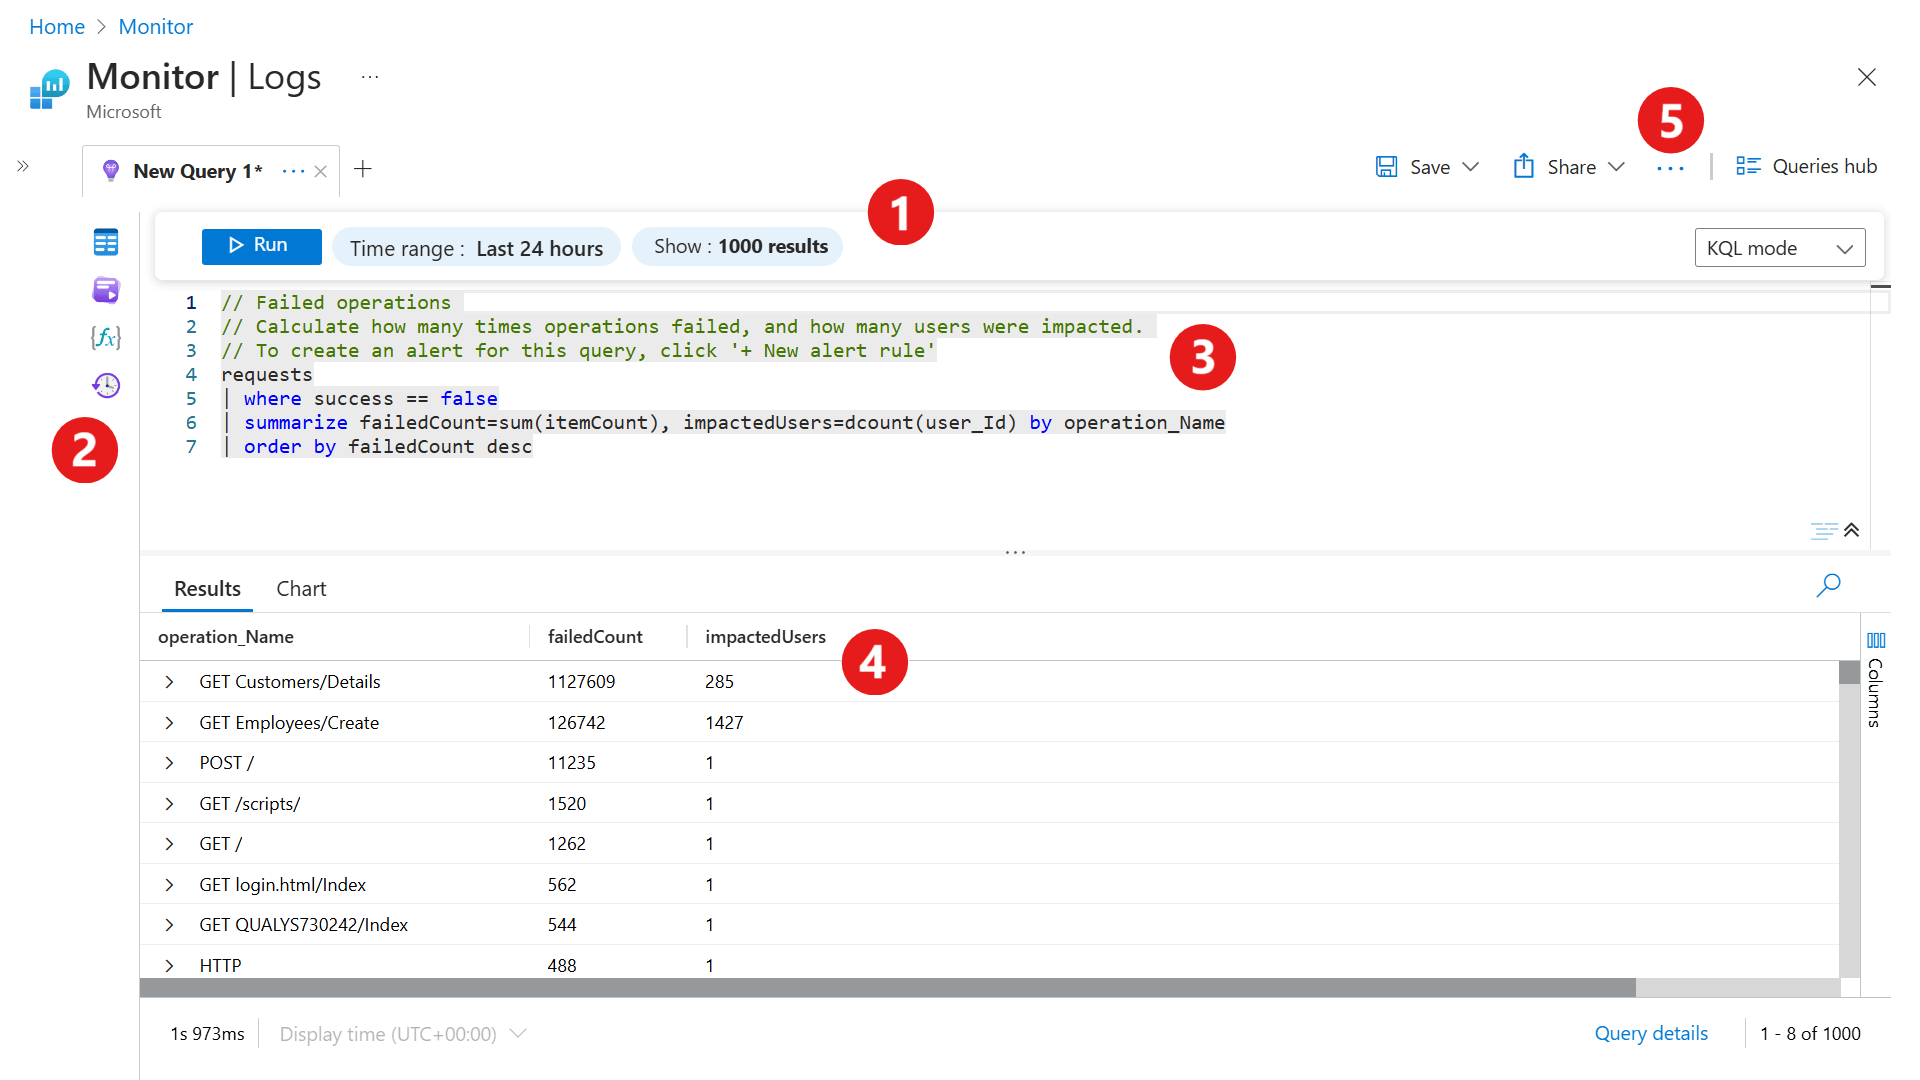
Query window
Note
The query window is only available in KQL mode.
The query window is where you edit your query. IntelliSense is used for KQL commands and color coding enhances readability. Select + at the top of the window to open another tab.
A single window can include multiple queries. A query can't include any blank lines, so you can separate multiple queries in a window with one or more blank lines. The current query is the one with the cursor positioned anywhere in it.
To run the current query, select the Run button or select Shift+Enter.
Results window
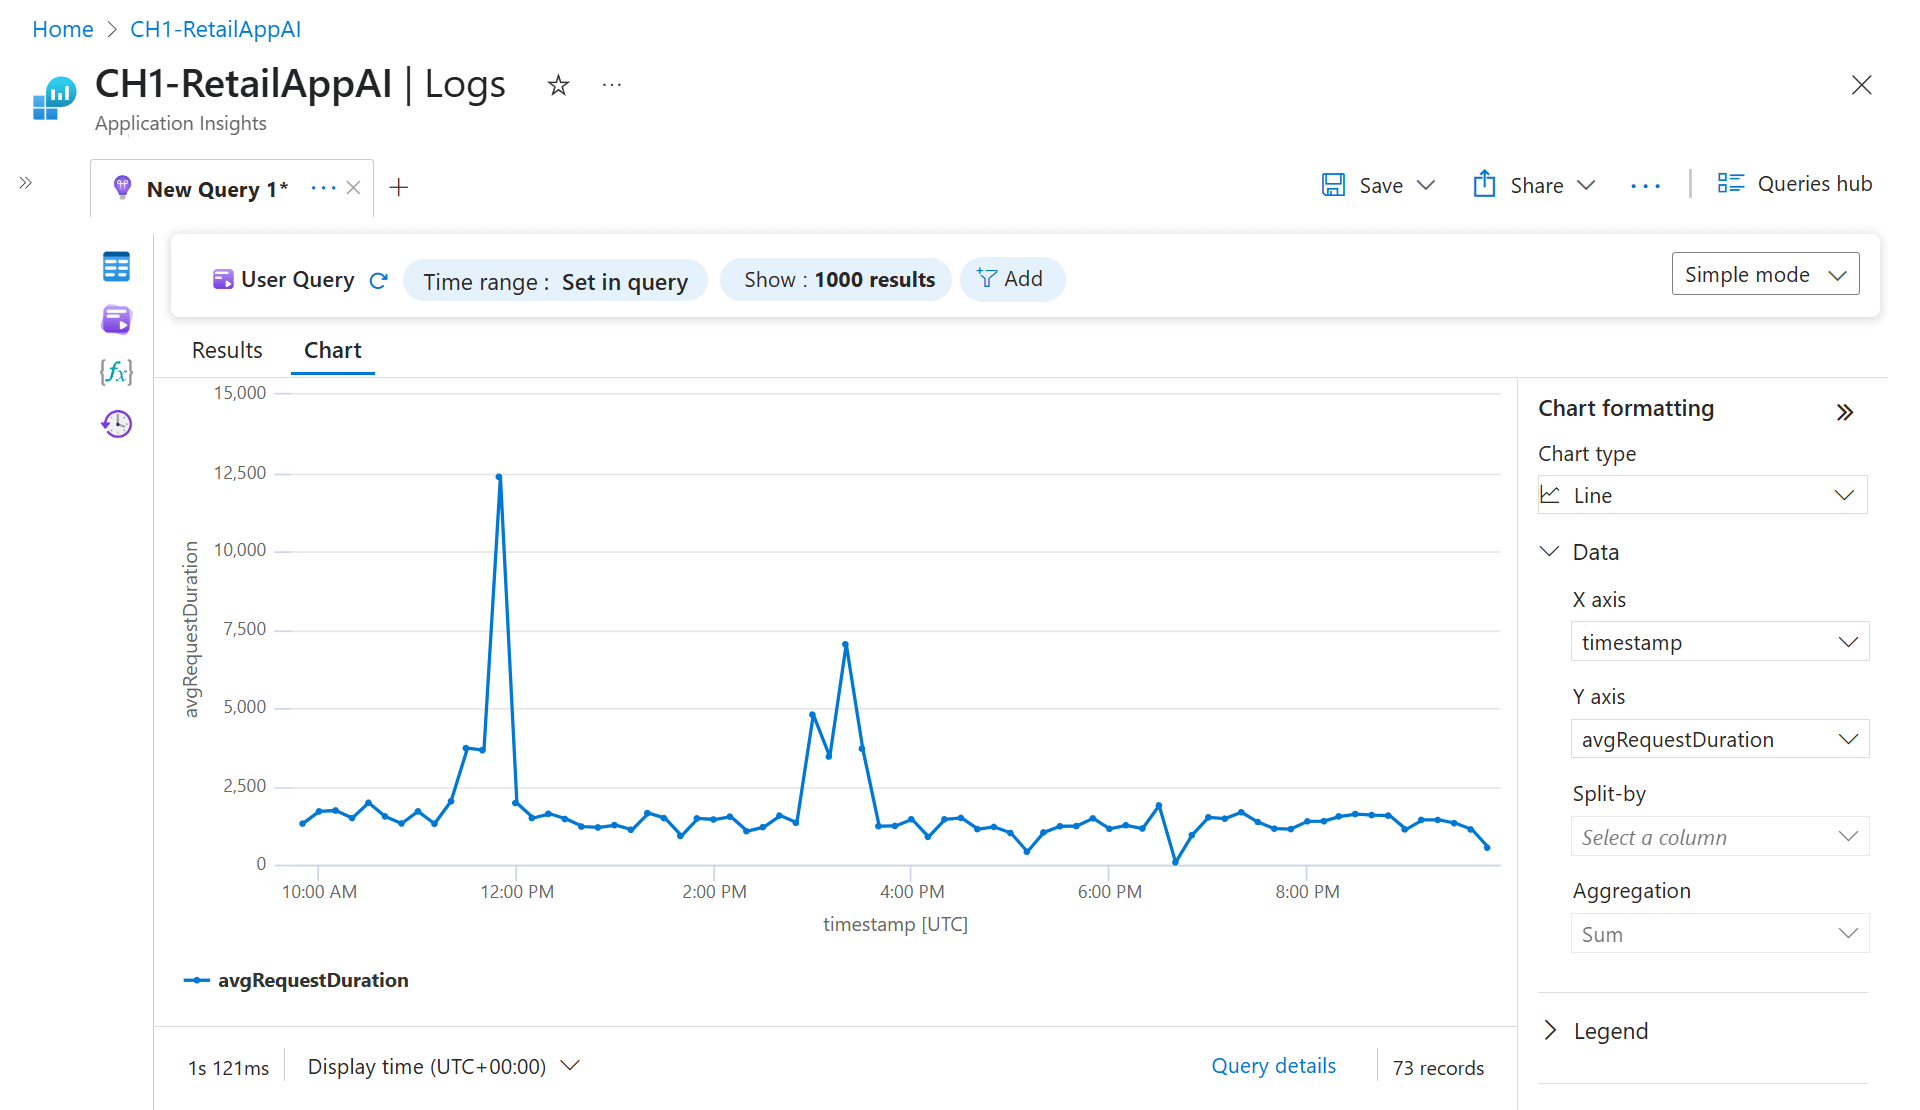
The results of a query appear in the results window. By default, the results are displayed as a table. To display the results as a chart, select Chart in the results window. You can also add a render command to your query.
Results view
The results view displays query results in a table organized by columns and rows.
- Click to the left of a row to expand its values.
- Select the Columns dropdown to change the list of columns.
- Sort the results by selecting a column name.
- Filter the results by selecting the funnel next to a column name.
- Clear the filters and reset the sorting by running the query again.
- Select Group columns to display the grouping bar above the query results.
- Group the results by any column by dragging it to the bar.
- Create nested groups in the results by adding more columns.
Chart view
The chart view displays the results as one of multiple available chart types. You can specify the chart type in a render command in your query (KQL mode). You can also select it from the collapsible Chart formatting section to the right.
| Option | Description |
|---|---|
| Chart type | Type of chart to display. |
| X axis | Column in the results to use for the x-axis. |
| Y axis | Column in the results to use for the y-axis. Typically, this is a numeric column. |
| Split-by | Column in the results that defines the series in the chart. A series is created for each value in the column. |
| Aggregation | Type of aggregation to perform on the numeric values in the y-axis. |
More tools
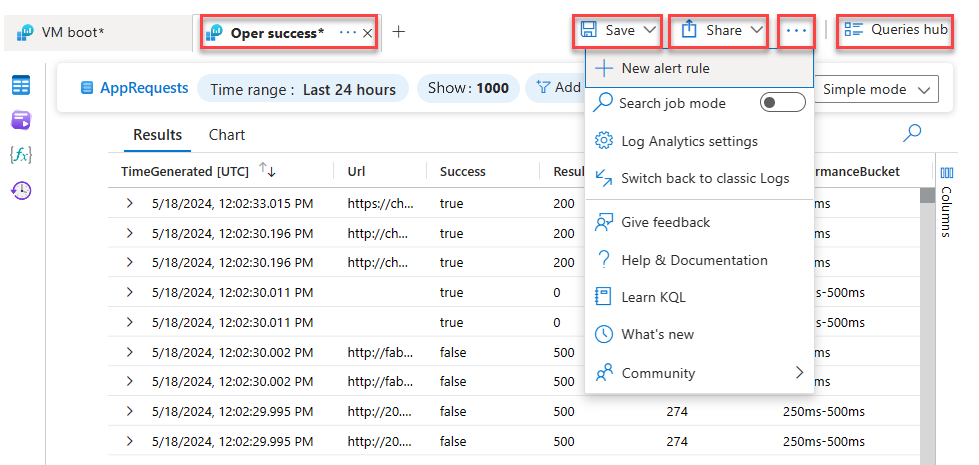
This section describes more tools available above the query area of the screen, as shown in this screenshot, from left to right.
Note
Tabs represent the query history of your current session. In simple mode, you can only use one query per tab.
| Option | Description |
|---|---|
| Tab context menu | Change query scope or rename, duplicate, or close tab. |
| Save | Save a query to a query pack or as a function, or pin your query to a workbook, an Azure dashboard, or Grafana dashboard. |
| Share | Copy a link to your query, the query text, or query results, or export data to Excel, CSV, or Power BI. |
| New alert rule | Create a new alert rule. |
| Search job mode | Run a search job. |
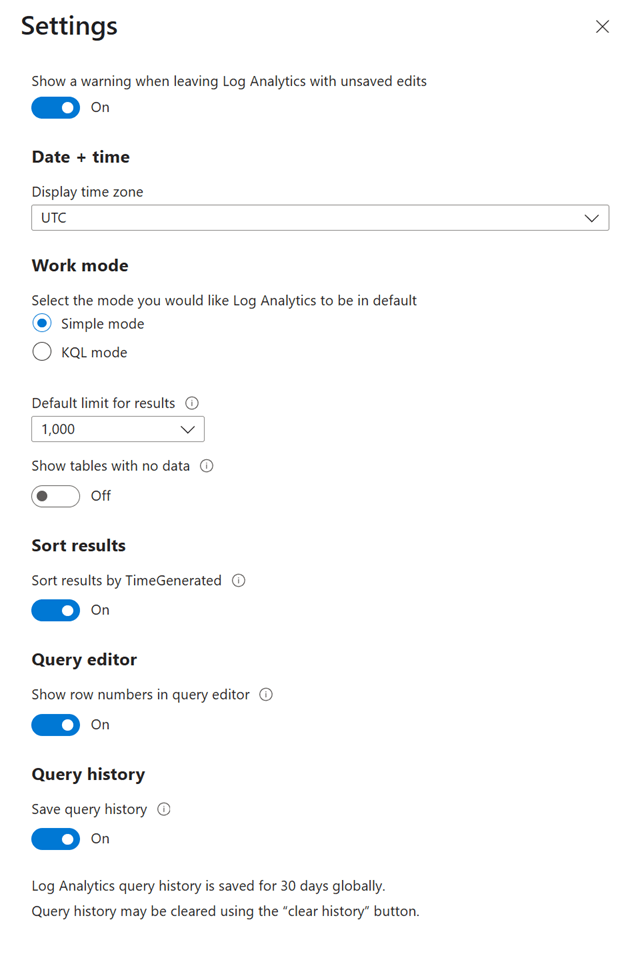
| Log Analytics settings | Define default Log Analytics settings, including time zone, whether Log Analytics opens in Simple or KQL mode, and whether to display tables with no data. See screenshot below. |
| Queries hub | Open the example queries dialog that appears when you first open Log Analytics. |
Relationship to Azure Data Explorer
If you've worked with the Azure Data Explorer web UI, Log Analytics should look familiar. It's built on top of Azure Data Explorer and uses the same Kusto Query Language.
Log Analytics adds features specific to Azure Monitor, such as filtering by time range and the ability to create an alert rule from a query. Both tools include an explorer that lets you scan through the structure of available tables. The Azure Data Explorer web UI primarily works with tables in Azure Data Explorer databases. Log Analytics works with tables in a Log Analytics workspace.
Next steps
- Walk through a tutorial on using Log Analytics in the Azure portal.
- Walk through a tutorial on writing queries.
