Note
Access to this page requires authorization. You can try signing in or changing directories.
Access to this page requires authorization. You can try changing directories.
This article describes the different ways that Azure Monitor charges for usage and how to evaluate charges on your Azure bill.
Tip
For strategies to reduce your Azure Monitor costs, see Cost optimization and Azure Monitor.
Pricing model
Azure Monitor uses a consumption-based pricing (pay-as-you-go) billing model where you only pay for what you use. Features of Azure Monitor that are enabled by default don't incur any charge. This includes collection and alerting on the Activity log and collection and analysis of platform metrics.
Several other features don't have a direct cost, but you instead pay for the ingestion and retention of data that they collect. The following table describes the different types of usage that are charged in Azure Monitor. Detailed current pricing for each is provided in Azure Monitor pricing.
| Type | Description |
|---|---|
| Logs | Ingestion, retention, and export of data in Log Analytics workspaces and legacy Application insights resources. Log data ingestion is the largest component of Azure Monitor charges for most customers. There's no charge for querying this data except for Basic and Auxiliary logs or data in long-term retention. Charges for Logs can vary significantly on the configuration that you choose. See Azure Monitor Logs pricing details for details on how charges for Logs data are calculated and the different pricing tiers available. |
| Platform Logs | Processing of diagnostic and auditing information is charged for certain services when sent to destinations other than a Log Analytics workspace. There's no direct charge when this data is sent to a Log Analytics workspace, but there's a charge for the workspace data ingestion and collection. |
| Metrics | There's no charge for standard metrics collected from Azure resources. There's a cost for collecting custom metrics and for retrieving metrics from the REST API. |
| Prometheus Metrics | Pricing for Azure Monitor managed service for Prometheus is based on data samples ingested and query samples processed. Data is retained for 18 months at no extra charge. |
| Alerts | Alerts are charged based on the type and number of signals used by the alert rule, its frequency, and the type of notification configurted through an action group. For log search alerts configured for at scale monitoring, the cost also depends on the number of time series created by the dimensions resulting from your query. |
| Web tests | There's a cost for standard web tests in Application Insights. Multi-step web tests are deprecated. |
See a full list of Azure Monitor billing meter names.
Data transfer charges
Sending data to Azure Monitor can incur data bandwidth charges. As described in the Azure Bandwidth pricing page, data transfer between Azure services located in two regions charged as outbound data transfer at the normal rate. Inbound data transfer is free. Data transfer charges for Azure Monitor though are typically small compared to the costs for data ingestion and retention. You should focus more on your ingested data volume to control your costs.
Note
Data sent to a different region using Diagnostic Settings doesn't incur data transfer charges.
View Azure Monitor usage and charges
There are two primary tools to view, analyze, and optimize your Azure Monitor costs. Each is described in detail in the following sections.
| Tool | Description |
|---|---|
| Azure Cost Management + Billing | Gives you powerful capabilities use to understand your billed costs. There are multiple options to analyze your charges for different Azure Monitor features and their projected cost over time. |
| Usage and Estimated Costs | Provides estimates of log data ingestion costs based on your daily usage patterns to help you optimize to use the most cost-effective logs pricing tier. |
Azure Cost Management + Billing
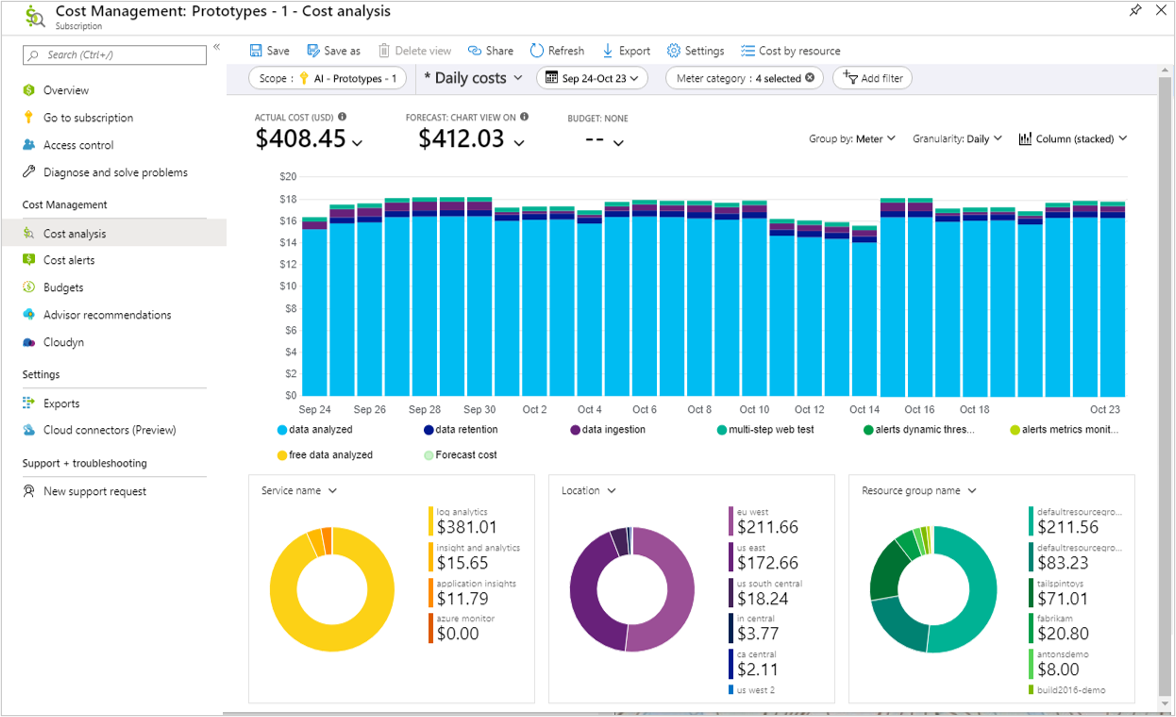
To get started analyzing your Azure Monitor charges, open Cost Management + Billing in the Azure portal. This tool includes several built-in dashboards for deep cost analysis like cost by resource and invoice details. Access policies are described here. Select Cost Management and then Cost analysis. Select your subscription or another scope.
Next, create a Daily Costs view, and change the Group by to show costs by Meter so that you can see each the costs from each feature. The meter names for each Azure Monitor feature are listed here.
Note
You might need additional access to use Cost Management data. See Assign access to Cost Management data.
To limit the view to Azure Monitor charges, create a filter for the following Service names.
- Azure Monitor
- Log Analytics
- Insight and Analytics
- Application Insights
Usage incurred on a Log Analytics workspace can be billed on any of the first three services (Azure Monitor, Log Analytics, or Insight and Analytics) depending on the feature. See Azure Monitor billing meter names for a list of the Azure Monitor billing meters for all Azure Monitor features.
Other services such as Microsoft Defender for Cloud and Microsoft Sentinel also bill their usage against Log Analytics workspace resources. See Common cost analysis uses for details on using this view. If you're using Microsoft Sentinel's simplified pricing tiers, log data ingestion is billed entirely on Sentinel meters.
If using an Azure Monitor Logs dedicated cluster, data ingestion usage may be billed against the cluster resource or each workspace that is joined to the cluster learn more.
Note
Alternatively, you can go to the Overview page of a Log Analytics workspace or Application Insights resource and click View Cost in the upper right corner of the Essentials section. This launches the Cost Analysis from Azure Cost Management + Billing already scoped to the workspace or application.
Automated mails and alerts
Rather than manually analyzing your costs in the Azure portal, you can automate delivery of information using the following methods.
- Daily cost analysis emails. After you configure your Cost Analysis view, select Subscribe at the top of the screen to receive regular email updates from Cost Analysis.
- Budget alerts. To be notified if there are significant increases in your spending, create a budget alerts for a single workspace or group of workspaces.
Export usage details
To gain deeper understanding of your usage and costs, create exports using Cost Analysis. See Tutorial: Create and manage exported data to learn how to automatically create a daily export you can use for regular analysis.
These exports are in CSV format and contain a list of daily usage (billed quantity and cost) by resource, billing meter, and several other fields such as AdditionalInfo. You can use Microsoft Excel to do rich analyses of your usage not possible in the Cost Analytics experiences in the portal.
For example, usage from Log Analytics can be found by first filtering on the Meter Category column to show:
- Log Analytics (for Pay-as-you-go data ingestion and interactive Data Retention),
- Insight and Analytics (used by some of the legacy pricing tiers), and
- Azure Monitor (used by most other Log Analytics features such as Commitment Tiers, Basic Logs ingesting, Long-Term Retention, Search Queries, Search Jobs, and so on)
Add a filter on the Instance ID column for contains workspace or contains cluster. The usage is shown in the Consumed Quantity column. The unit for each entry is shown in the Unit of Measure column.
Note
See Azure Monitor billing meter names for a reference of the billing meter names used by Azure Monitor in Azure Cost Management + Billing.
View data allocation benefits
There are several approaches to view the benefits a workspace receives from offers that are part of other products. These offers are:
- Defender for Servers data allowance and
- Microsoft Sentinel benefit for Microsoft 365 E5, A5, F5, and G5 customers.
Note
To receive the Defender for Servers data allowance on your Log Analytics workspace, the Security solution must have been created on the workspace.
View benefits in a usage export
Since a usage export has both the number of units of usage and their cost, you can use this export to see the benefits you're receiving. In the usage export, to see the benefits, filter the Instance ID column to your workspace. To select all of your workspaces in the spreadsheet, filter the Instance ID column to contains /workspaces/. Then filter on the Meter to either of the following 2 meters:
Standard Data Included per Node: this meter is under the service "Insight and Analytics" and tracks the benefits received when a workspace in either in Log Analytics Per Node tier data allowance and/or has Defender for Servers enabled. Each of these allowances provides a 500 MB/server/day data allowance.
Free Benefit - M365 Defender Data Ingestion: this meter, under the service "Azure Monitor", tracks the benefit from the Microsoft Sentinel benefit for Microsoft 365 E5, A5, F5, and G5 customers.
View benefits in Usage and estimated costs
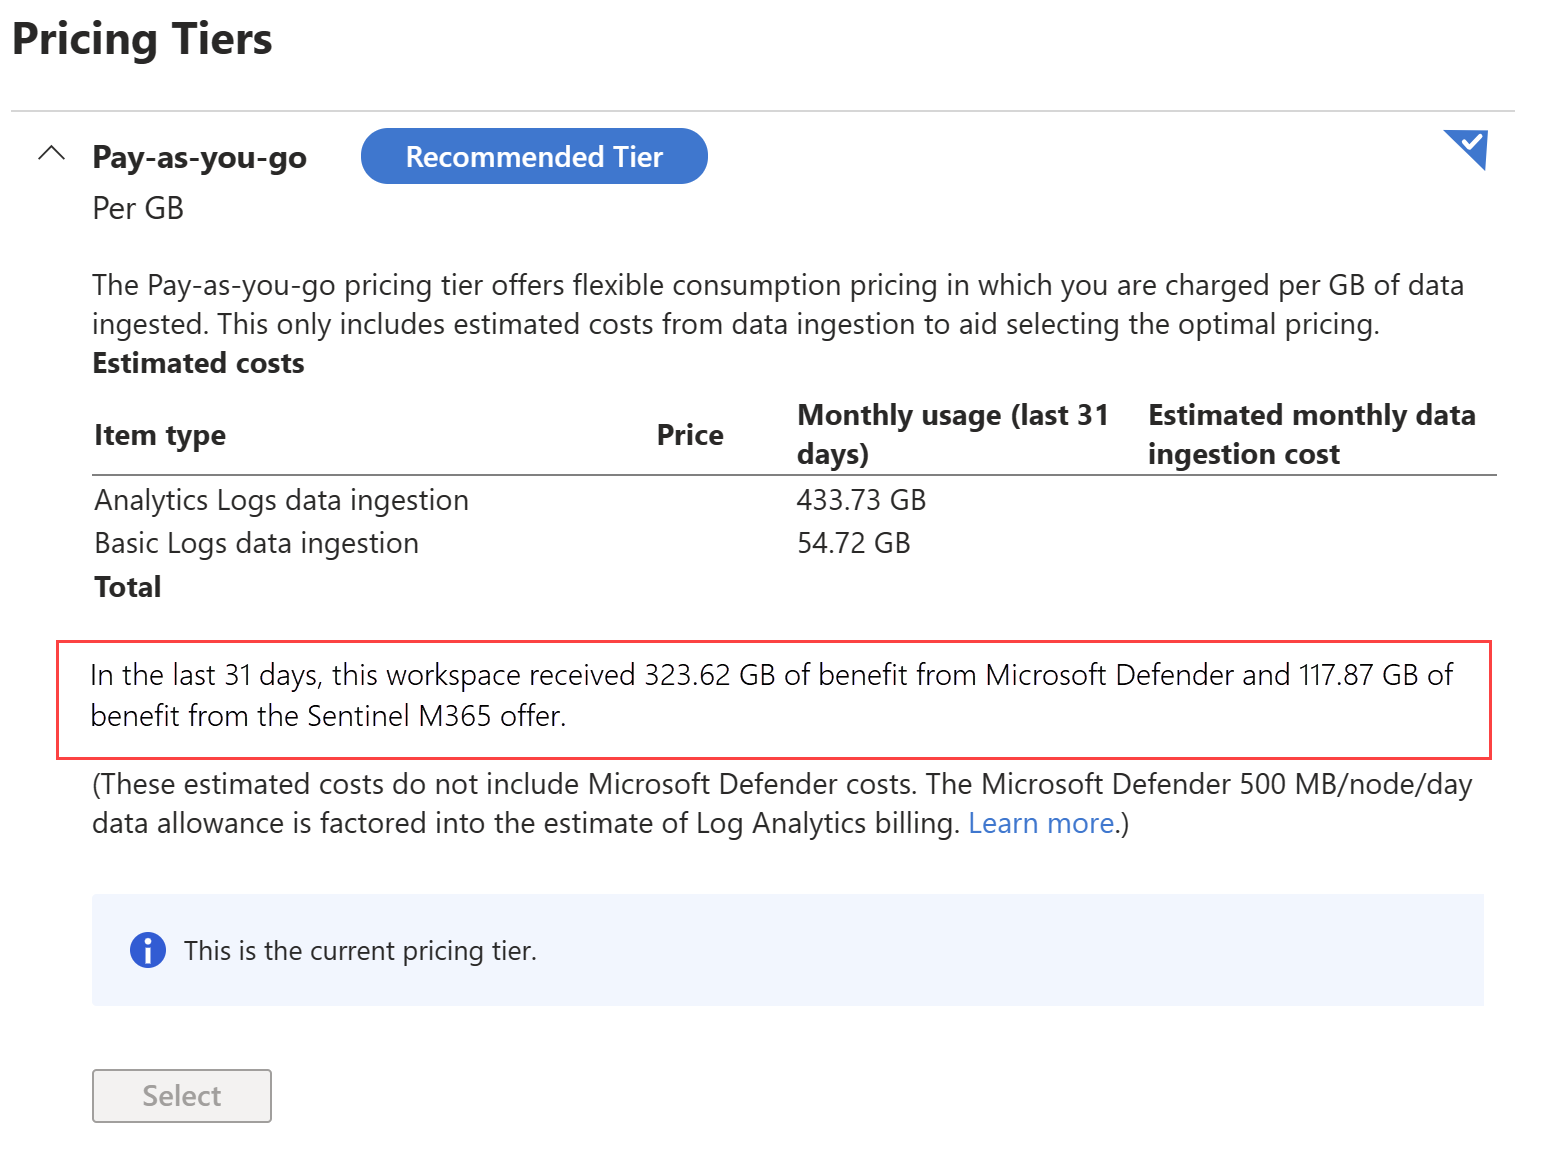
You can also see these data benefits in the Log Analytics Usage and estimated costs page. If the workspace is receiving these benefits, there's a sentence below the cost estimate table that gives the data volume of the benefits used over the last 31 days.
Query benefits from the Operation table
The Operation table contains daily events which given the amount of benefit used from the Defender for Servers data allowance and the Microsoft Sentinel benefit for Microsoft 365 E5, A5, F5, and G5 customers. The Detail column for these events is in the format Benefit amount used 1.234 GB, and the type of benefit is in the OperationKey column. Here's a query that charts the benefits used in the last 31-days:
Operation
| where TimeGenerated >= ago(31d)
| where Detail startswith "Benefit amount used"
| parse Detail with "Benefit amount used: " BenefitUsedGB " GB"
| extend BenefitUsedGB = toreal(BenefitUsedGB)
| parse OperationKey with "Benefit type used: " BenefitType
| project BillingDay=TimeGenerated, BenefitType, BenefitUsedGB
| sort by BillingDay asc, BenefitType asc
| render columnchart
Note that for workspaces in the legacy Per Node pricing tier, the Defender benefit listed in the Operation table only includes the benefit from the set of security tables eligible for the Defender benefit. In this pricing tier, the total benefit applied will include data allowances from the Per Node tier and Defender which are combined and applied to all tables.
This functionality of reporting the benefits used in the Operation table started January 27, 2024.)
Tip
If you increase the data retention of the Operation table, you'll be able to view these benefit trends over longer periods.
Usage and estimated costs
You can get more usage details about Log Analytics workspaces and Application Insights resources from the Usage and Estimated Costs option for each.
Log Analytics workspace
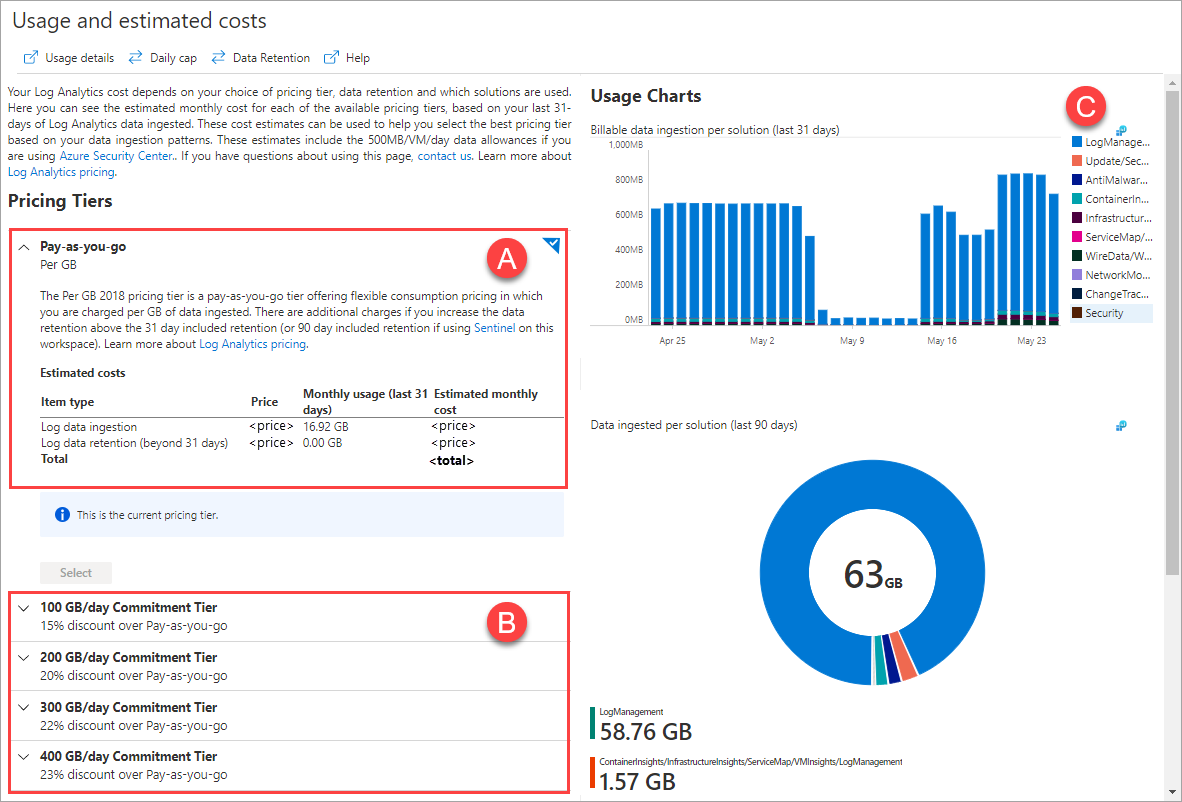
To learn about your usage trends and optimize your costs using the most cost-effective commitment tier for your Log Analytics workspace, select Usage and Estimated Costs from the Log Analytics workspace menu in the Azure portal.
This view includes the following sections:
A. Estimated monthly charges based on usage from the past 31 days using the current pricing tier.
B. Estimated monthly charges using different commitment tiers.
C. Billable data ingestion by solution from the past 31 days.
To explore the data in more detail, select the icon in the upper-right corner of either chart to work with the query in Log Analytics.
Application insights
Workspace-based resources
To learn about usage on your workspace-based resources, see Data volume trends for workspace-based resources.
Classic resources
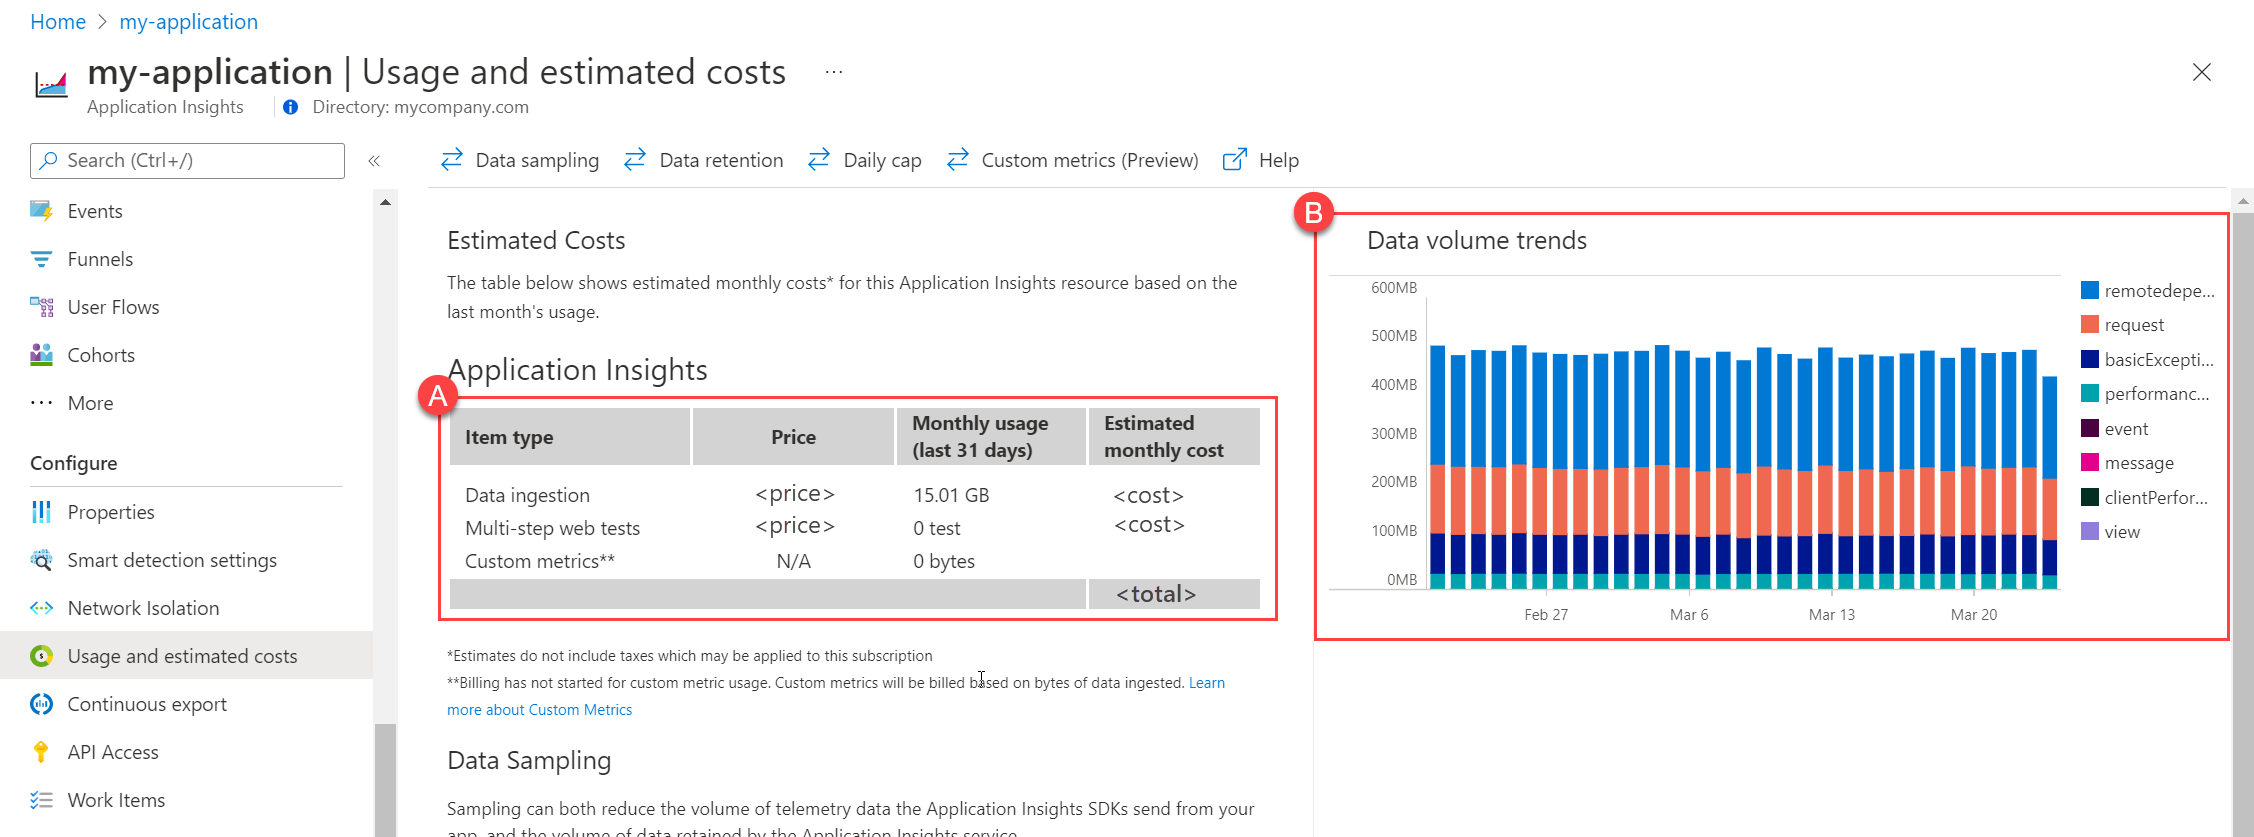
To learn about usage on retired classic Application Insights resources, select Usage and Estimated Costs from the Applications menu in the Azure portal.
This view includes the following:
A. Estimated monthly charges based on usage from the past month.
B. Billable data ingestion by table from the past month.
To investigate your Application Insights usage more deeply, open the Metrics page, add the metric named Data point volume, and then select the Apply splitting option to split the data by "Telemetry item type".
Azure Migrate data benefits
Workspaces linked to classic Azure Migrate receive free data benefits for the data tables related to Azure Migrate (ServiceMapProcess_CL, ServiceMapComputer_CL, VMBoundPort, VMConnection, VMComputer, VMProcess, InsightsMetrics). This version of Azure Migrate was retired in February 2024.
Starting from 1 July 2024, the data benefit for Azure Migrate in Log Analytics will no longer be available. We suggest moving to the Azure Migrate agentless dependency analysis. If you continue with agent-based dependency analysis, standard Azure Monitor charges apply for the data ingestion that enables dependency visualization.
Next steps
- See Azure Monitor Logs pricing details for details on how charges are calculated for data in a Log Analytics workspace and different configuration options to reduce your charges.
- See Analyze usage in Log Analytics workspace for details on analyzing the data in your workspace to determine to source of any higher than expected usage and opportunities to reduce your amount of data collected.
- See Set daily cap on Log Analytics workspace to control your costs by setting a daily limit on the amount of data that might be ingested in a workspace.
- See Azure Monitor best practices - Cost management for best practices on configuring and managing Azure Monitor to minimize your charges.


