Note
Access to this page requires authorization. You can try signing in or changing directories.
Access to this page requires authorization. You can try changing directories.
Azure Monitor for Azure Cosmos DB provides a metrics view to monitor your account and create dashboards. The Azure Cosmos DB metrics are collected by default. This feature doesn't require you to enable or configure anything explicitly.
Metric definition
Normalized RU Consumption is a metric between 0% to 100% that's used to help measure the utilization of provisioned throughput on a database or container. The metric is emitted at 1-minute intervals and is defined as the maximum Request Units per second (RU/s) utilization across all partition key ranges in the time interval. Each partition key range maps to one physical partition and is assigned to hold data for a range of possible hash values. In general, the higher the normalized RU percentage, the more you've utilized your provisioned throughput. The metric can also be used to view the utilization of individual partition key ranges on a database or container.
For example, suppose you have a container where you set autoscale max throughput of 20,000 RU/s (scales between 2000 - 20,000 RU/s) and you have two partition key ranges (physical partitions) P1 and P2. Because Azure Cosmos DB distributes the provisioned throughput equally across all the partition key ranges, P1 and P2 can each scale between 1000 - 10,000 RU/s. Suppose in a 1-minute interval, in a given second, P1 consumed 6,000 RUs and P2 consumed 8,000 RUs. The normalized RU consumption of P1 is 60% and 80% for P2. The overall normalized RU consumption of the entire container is MAX(60%, 80%) = 80%.
If you're interested in seeing the request unit consumption at a per-second interval, along with operation type, you can use the opt-in diagnostic logs and query the PartitionKeyRUConsumption table. To get a high-level overview of the operations and status code that your application is performing on the Azure Cosmos DB resource, you can use the built-in Azure Monitor Total Requests (API for NoSQL), Mongo Requests, Gremlin Requests, or Cassandra Requests metric. Later, you can filter on these requests by the 429 status code and split them by Operation Type.
What to expect and do when normalized RU/s is higher
When the normalized RU consumption reaches 100% for a given partition key range, and if a client still makes requests in that time window of 1 second to that specific partition key range, it receives a rate-limited error (429).
This doesn't necessarily mean there's a problem with your resource. By default, the Azure Cosmos DB client SDKs and data import tools, such as Azure Data Factory and bulk executor library, automatically retry requests on 429s. They retry typically up to nine times. As a result, while you might see 429s in the metrics, these errors might not even have been returned to your application.
In general, for a production workload, if you see between 1-5% of requests with 429s, and your end-to-end latency is acceptable, this is a healthy sign that the RU/s are being fully utilized. In this case, the normalized RU consumption metric reaching 100% only means that in a given second, at least one partition key range used all its provisioned throughput. This is acceptable because the overall rate of 429s is still low. No further action is required.
To determine what percent of your requests to your database or container resulted in 429s, from your Azure Cosmos DB account, navigate to Insights > Requests > Total Requests by Status Code. Filter to a specific database and container. For API for Gremlin, use the Gremlin Requests metric.

If the normalized RU consumption metric is consistently 100% across multiple partition key ranges and the rate of 429s is greater than 5%, it's recommended to increase the throughput. You can find out which operations are heavy and what their peak usage is by using the Azure monitor metrics and Azure monitor diagnostic logs. To learn about best practices, see Best practices for scaling provisioned throughput (RU/s).
It isn't always the case that you see a 429 rate-limiting error just because the normalized RU reached 100%. That's because the normalized RU is a single value that represents the maximum usage over all partition key ranges. One partition key range might be busy but the other partition key ranges can serve requests without issues. For example, a single operation such as a stored procedure that consumes all the RU/s on a partition key range leads to a short spike in the normalized RU consumption metric. In such cases, there aren't any immediate rate-limiting errors if the overall request rate is low or requests are made to other partitions on different partition key ranges.
To learn more, see Diagnose and troubleshoot 429 exceptions.
How to monitor for hot partitions
The normalized RU consumption metric can be used to monitor if your workload has a hot partition. A hot partition arises when one or a few logical partition keys consume a disproportionate amount of the total RU/s due to higher request volume. This can be caused by a partition key design that doesn't evenly distribute requests. It results in many requests being directed to a small subset of logical partitions (which implies partition key ranges) that become hot. Because all data for a logical partition resides on one partition key range and total RU/s is evenly distributed among all the partition key ranges, a hot partition can lead to 429s and inefficient use of throughput.
How to identify a hot partition
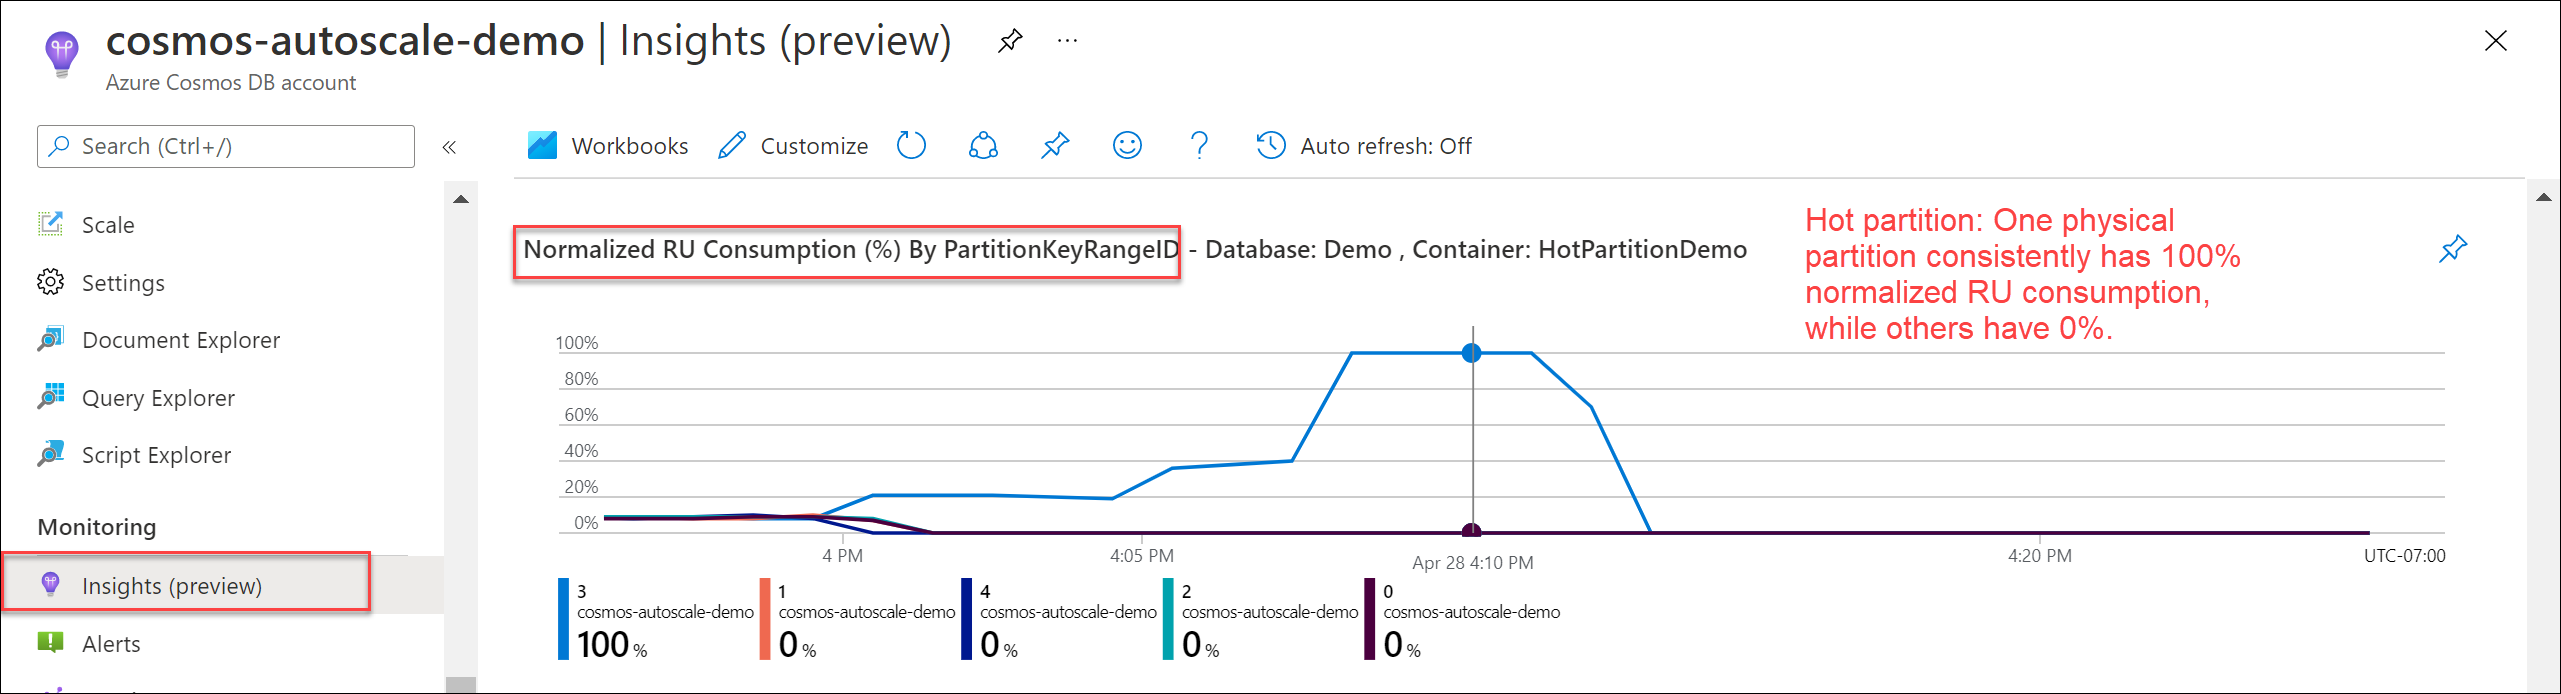
To verify if there's a hot partition, navigate to Insights > Throughput > Normalized RU Consumption (%) By PartitionKeyRangeID. Filter to a specific database and container.
Each PartitionKeyRangeId maps to one physical partition. If there's one PartitionKeyRangeId that has higher normalized RU consumption than others (for example, one is consistently at 100%, but others are at 30% or less), this can be a sign of a hot partition.
To identify the logical partitions that consume the most RU/s, see How to identify the hot partition.
Normalized RU consumption and autoscale
The normalized RU consumption metric shows as 100% if at least one partition key range uses all its allocated RU/s in any given second in the time interval. One common question that arises is, why is normalized RU consumption at 100%, but Azure Cosmos DB didn't scale the RU/s to the maximum throughput with autoscale?
Note
The following information describes the current implementation of autoscale and might be subject to change in the future.
When you use autoscale, Azure Cosmos DB only scales the RU/s to the maximum throughput when the normalized RU consumption is 100% for a sustained, continuous period of time in a 5-second interval. This is done to ensure the scaling logic is cost friendly to the user, as it ensures that single, momentary spikes don't lead to unnecessary scaling and higher cost. When there are momentary spikes, the system typically scales up to a value higher than the previously scaled to RU/s, but lower than the max RU/s.
For example, suppose you have a container with autoscale max throughput of 20,000 RU/s (scales between 2000 - 20,000 RU/s) and two partition key ranges. Each partition key range can scale between 1000 - 10,000 RU/s. Because autoscale provisions all required resources upfront, you can use up to 20,000 RU/s at any time.
Now let’s say you have an intermittent spike of traffic:
For one second, Partition 1 spikes to 10,000 RU/s, then drops to 1,000 RU/s for the next four seconds.
Simultaneously, Partition 2 spikes to 8,000 RU/s, then drops to 1,000 RU/s for the next four seconds.
This is how metrics behave:
Normalized RU Consumption (which shows the maximum usage over the interval across all partitions) shows 100% utilization, because Partition 1 hit its maximum for one second.
However, provisioned throughput and autoscaled RU metrics don't scale up to maximum RU/s just because of a 1-second spike. It scales based on 5-second interval to be cost effective. So for the previous example, partition 1 and partition 2 RU consumption don't reach 10,000 RU/s based on the 5-second interval.
As a result, even though autoscale didn't scale to the maximum, you were still able to use the total RU/s available for that spiky second. To verify your RU/s consumption, you can use the opt-in Diagnostic Logs feature to query for the overall RU/s consumption at a per-second level across all partition key ranges.
CDBPartitionKeyRUConsumption
| where TimeGenerated >= (todatetime('2022-01-28T20:35:00Z')) and TimeGenerated <= todatetime('2022-01-28T20:40:00Z')
| where DatabaseName == "MyDatabase" and CollectionName == "MyContainer"
| summarize sum(RequestCharge) by bin(TimeGenerated, 1sec), PartitionKeyRangeId
| render timechart
In general, for a production workload using autoscale, if you see between 1-5% of requests with 429s, and your end-to-end latency is acceptable, this is a healthy sign that the RU/s are being fully utilized. Even if the normalized RU consumption occasionally reaches 100% and autoscale doesn't scale up to the maximum RU/s, this is ok because the overall rate of 429s is low. No action is required.
Tip
If you use autoscale and find that normalized RU consumption is consistently 100% and you're consistently scaled to the maximum RU/s, this is a sign that using manual throughput might be more cost-effective. To determine whether autoscale or manual throughput is best for your workload, see How to choose between standard (manual) and autoscale provisioned throughput. Azure Cosmos DB also sends cost recommendations based on your workload patterns to recommend either manual or autoscale throughput.
View the normalized request unit consumption metric
Sign in to the Azure portal.
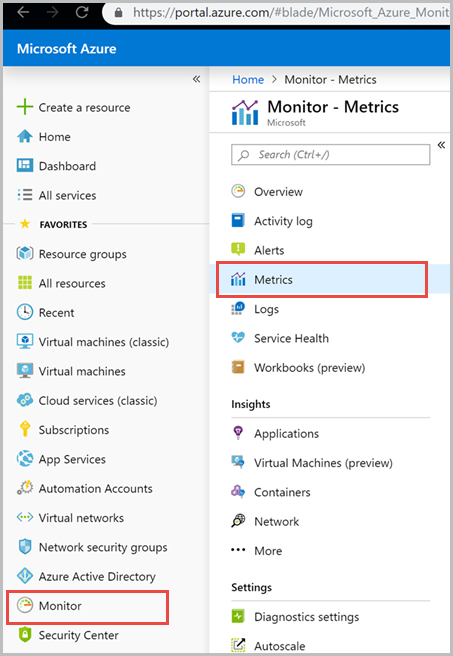
Select Monitor from the left-hand navigation bar, and select Metrics.
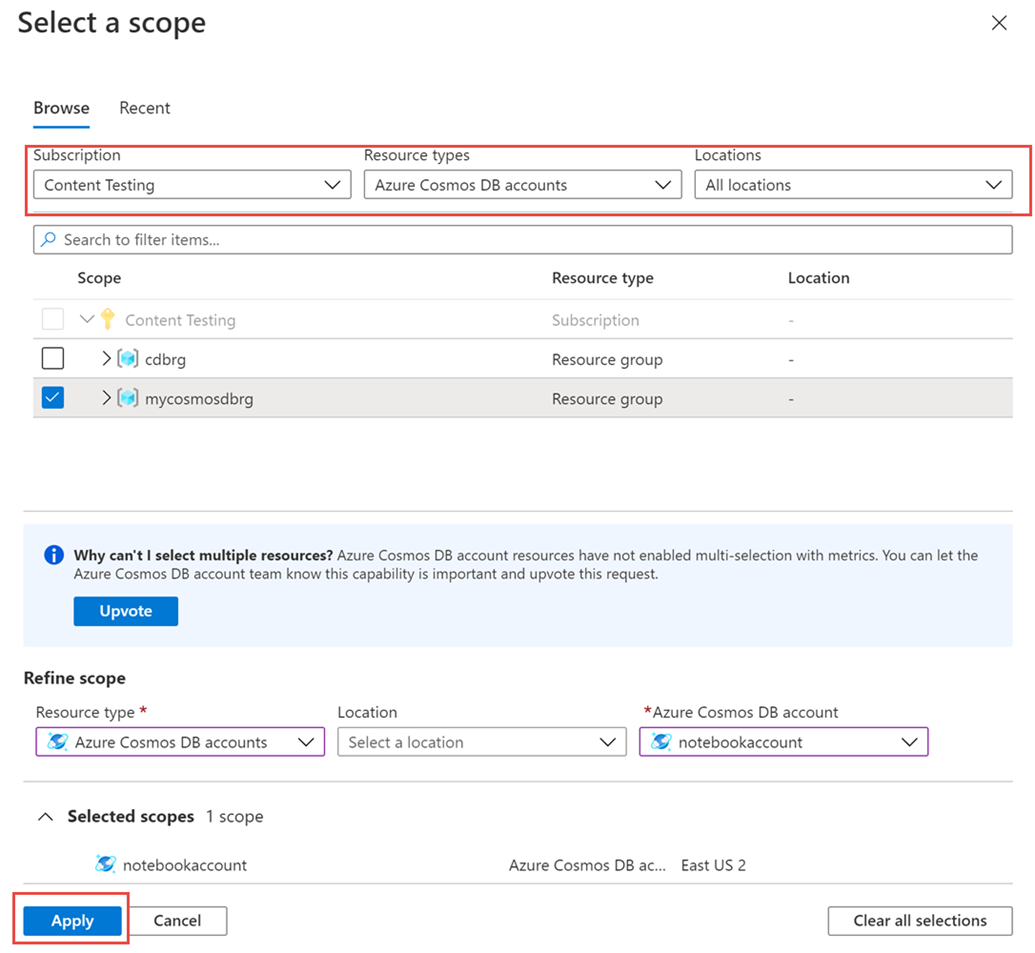
From the Metrics pane > Select a resource > choose the required subscription, and resource group. For the Resource type, select Azure Cosmos DB accounts, choose one of your existing Azure Cosmos DB accounts, and select Apply.
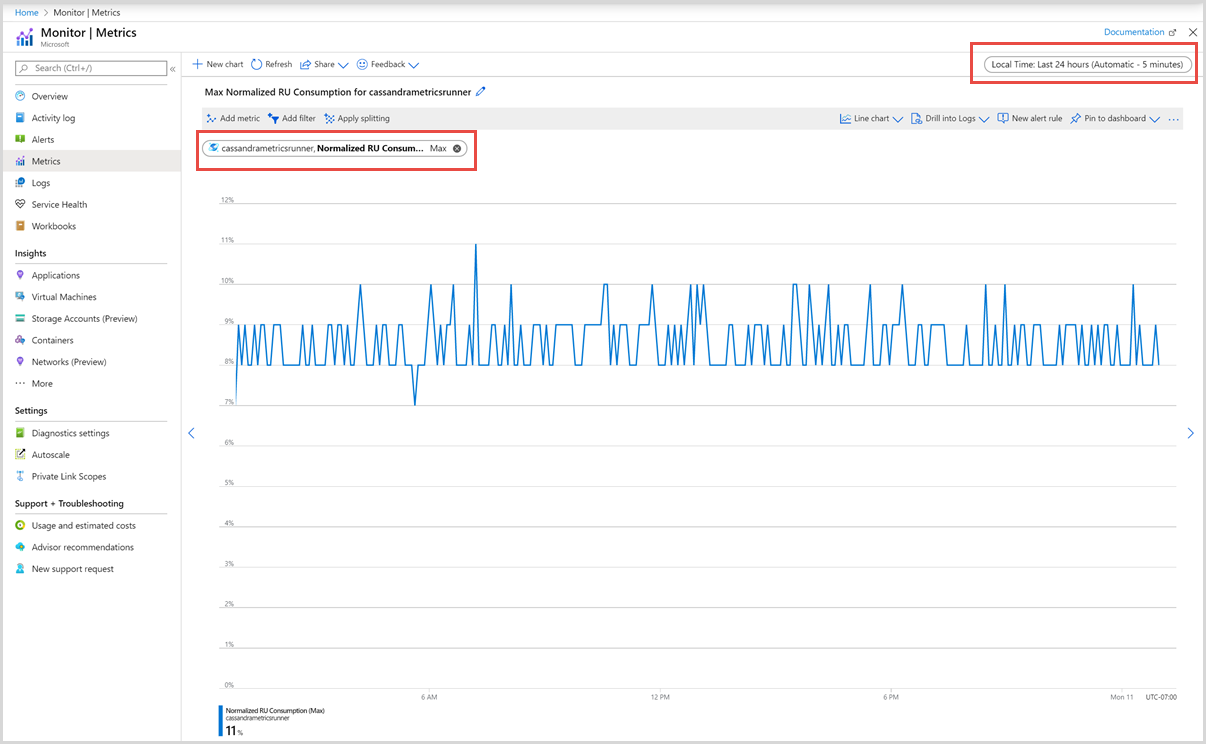
Next you can select a metric from the list of available metrics. You can select metrics specific to request units, storage, latency, availability, Cassandra, and others. To learn in detail about all the available metrics in this list, see the Metrics by category article. In this example, let’s select Normalized RU Consumption metric and Max as the aggregation value.
In addition to these details, you can also select the Time range and Time granularity of the metrics. At max, you can view metrics for the past 30 days. After you apply the filter, a chart is displayed based on your filter.


Filters for normalized RU consumption metric
You can also filter metrics and the chart displayed by a specific CollectionName, DatabaseName, PartitionKeyRangeID, and Region. To filter the metrics, select Add filter and choose the required property such as CollectionName and corresponding value you're interested in. The graph then displays the normalized RU consumption metric for the container for the selected period.
You can group metrics by using the Apply splitting option. For shared throughput databases, the normalized RU metric shows data at the database granularity only, it doesn't show any data per collection. So for shared throughput database, you won't see any data when you apply splitting by collection name.
The normalized request unit consumption metric for each container is displayed as shown in the following image:
