Note
Access to this page requires authorization. You can try signing in or changing directories.
Access to this page requires authorization. You can try changing directories.
Applies to: ✅ Azure Data Explorer
You can embed Python code in Kusto Query Language queries using the python() plugin. The plugin runtime is hosted in a sandbox, an isolated and secure Python environment. The python() plugin capability extends Kusto Query Language native functionalities with the huge archive of OSS Python packages. This extension enables you to run advanced algorithms, such as machine learning, artificial intelligence, statistical, and time series as part of the query.
Kusto Query Language tools aren't convenient for developing and debugging Python algorithms. Therefore, develop the algorithm on your favorite Python-integrated development environment such as Jupyter, PyCharm, Visual Studio, or Visual Studio Code. When the algorithm is complete, copy and paste into KQL. To improve and streamline this workflow, Kusto Explorer or Web UI clients can integrate with Visual Studio Code for authoring and debugging KQL inline Python code.
Note
This workflow can only be used to debug relatively small input tables (up to few MB). Therefore, you may need to limit the input for debugging. If you need to process a large table, limit it for debugging using | take, | sample, or where rand() < 0.x.
Prerequisites
- An Azure subscription. Create a Azure account.
- An Azure Data Explorer cluster and database. Create a cluster and database.
- Install Python Anaconda Distribution. In Advanced Options, select Add Anaconda to my PATH environment variable.
- Install Visual Studio Code.
- Install Python extension for Visual Studio Code.
- Enable the Python plugin. For more information, see Manage language extensions in your Azure Data Explorer cluster.
Enable Python debugging in Visual Studio Code
In your client application, prefix a query containing inline Python with
set query_python_debug;Run the query.
- Kusto Explorer: Visual Studio Code is automatically launched with the debug_python.py script.
- Kusto Web UI:
- Download and save debug_python.py, df.txt, and kargs.txt. In window, select Allow. Save files in selected directory.
- Right-click debug_python.py and open with Visual Studio Code. The debug_python.py script contains the inline Python code, from the KQL query, prefixed by the template code to initialize the input dataframe from df.txt and the dictionary of parameters from kargs.txt.
In Visual Studio Code, launch the Visual Studio Code debugger: Run > Start Debugging (F5), select Python configuration. The debugger launches and automatically sets a breakpoint to debug the inline code.
How does inline Python debugging in Visual Studio Code work?
- The query is parsed and executed in the server until the required
| evaluate python()clause is reached. - The Python sandbox is invoked but instead of running the code, it serializes the input table, the dictionary of parameters, and the code, and sends them back to the client.
- These three objects are saved in three files: df.txt, kargs.txt, and debug_python.py in the selected directory (Web UI) or in the client %TEMP% directory (Kusto Explorer).
- Visual Studio Code is launched, preloaded with the debug_python.py file that contains a prefix code to initialize df and kargs from their respective files, followed by the Python script embedded in the KQL query.
Query example
Run the following KQL query in your client application:
range x from 1 to 4 step 1
| evaluate python(typeof(*, x4:int),
'exp = kargs["exp"]\n'
'result = df\n'
'result["x4"] = df["x"].pow(exp)\n'
, bag_pack('exp', 4))
See the resulting table:
x x4 1 1 2 16 3 81 4 256 Run the same KQL query in your client application using
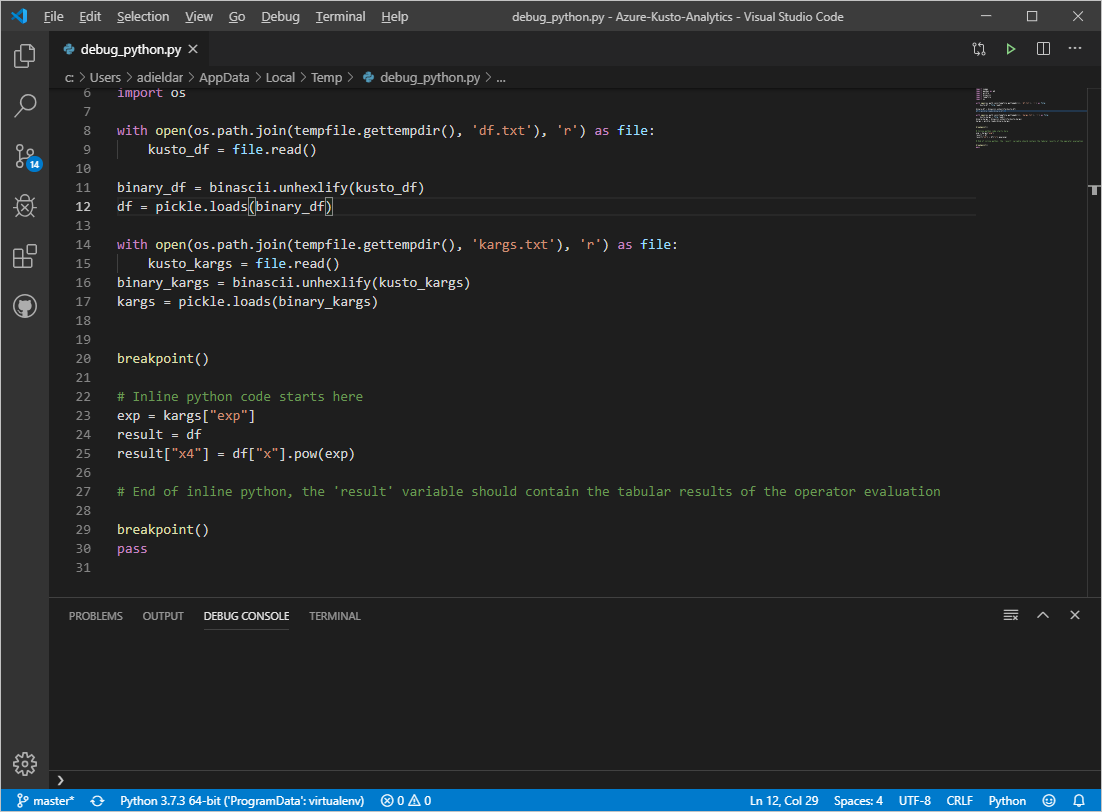
set query_python_debug;:set query_python_debug; range x from 1 to 4 step 1 | evaluate python(typeof(*, x4:int), 'exp = kargs["exp"]\n' 'result = df\n' 'result["x4"] = df["x"].pow(exp)\n' , bag_pack('exp', 4))Visual Studio Code is launched:
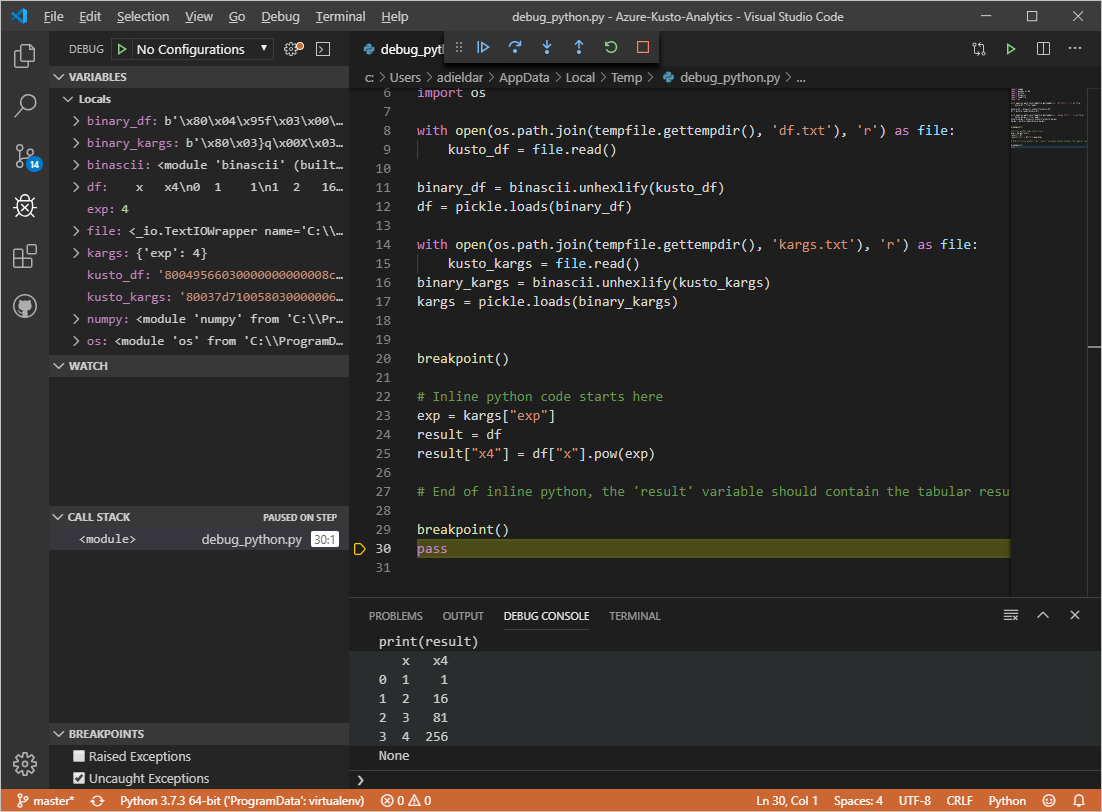
Visual Studio Code debugs and prints 'result' dataframe in the debug console:
Note
There may be differences between the Python sandbox image and your local installation. Check the sandbox image for specific packages by querying the plugin.
Note
In case there are errors when launching Visual Studio Code debugging session try setting the default terminal profile to command prompt:
- Press CTRL + SHIFT + P to open the Command Palette.
- Search for "Terminal: Select Default Profile" and select "Command Prompt"