Note
Access to this page requires authorization. You can try signing in or changing directories.
Access to this page requires authorization. You can try changing directories.
Switch services using the Version drop-down list. Learn more about navigation.
Applies to: ✅ Azure Data Explorer
The function series_mv_ee_anomalies_fl() is a user-defined function (UDF) that detects multivariate anomalies in series by applying elliptic envelope model from scikit-learn. This model assumes that the source of the multivariate data is multi-dimensional normal distribution. The function accepts a set of series as numerical dynamic arrays, the names of the features columns and the expected percentage of anomalies out of the whole series. The function builds a multi-dimensional elliptical envelope for each series and marks the points that fall outside this normal envelope as anomalies.
Prerequisites
- The Python plugin must be enabled on the cluster. This is required for the inline Python used in the function.
Syntax
T | invoke series_mv_ee_anomalies_fl(features_cols, anomaly_col [, score_col [, anomalies_pct ]])
Learn more about syntax conventions.
Parameters
| Name | Type | Required | Description |
|---|---|---|---|
| features_cols | dynamic |
✔️ | An array containing the names of the columns that are used for the multivariate anomaly detection model. |
| anomaly_col | string |
✔️ | The name of the column to store the detected anomalies. |
| score_col | string |
The name of the column to store the scores of the anomalies. | |
| anomalies_pct | real |
A real number in the range [0-50] specifying the expected percentage of anomalies in the data. Default value: 4%. |
Function definition
You can define the function by either embedding its code as a query-defined function, or creating it as a stored function in your database, as follows:
Define the function using the following let statement. No permissions are required.
Important
A let statement can't run on its own. It must be followed by a tabular expression statement. To run a working example of series_mv_ee_anomalies_fl(), see Example.
// Define function
let series_mv_ee_anomalies_fl=(tbl:(*), features_cols:dynamic, anomaly_col:string, score_col:string='', anomalies_pct:real=4.0)
{
    let kwargs = bag_pack('features_cols', features_cols, 'anomaly_col', anomaly_col, 'score_col', score_col, 'anomalies_pct', anomalies_pct);
    let code = ```if 1:
        from sklearn.covariance import EllipticEnvelope
        features_cols = kargs['features_cols']
        anomaly_col = kargs['anomaly_col']
        score_col = kargs['score_col']
        anomalies_pct = kargs['anomalies_pct']
        dff = df[features_cols]
        ellipsoid = EllipticEnvelope(contamination=anomalies_pct/100.0)
        for i in range(len(dff)):
            dffi = dff.iloc[[i], :]
            dffe = dffi.explode(features_cols)
            ellipsoid.fit(dffe)
            df.loc[i, anomaly_col] = (ellipsoid.predict(dffe) < 0).astype(int).tolist()
            if score_col != '':
                df.loc[i, score_col] = ellipsoid.decision_function(dffe).tolist()
        result = df
    ```;
    tbl
    | evaluate hint.distribution=per_node python(typeof(*), code, kwargs)
};
// Write your query to use the function here.
Example
The following example uses the invoke operator to run the function.
To use a query-defined function, invoke it after the embedded function definition.
// Define function
let series_mv_ee_anomalies_fl=(tbl:(*), features_cols:dynamic, anomaly_col:string, score_col:string='', anomalies_pct:real=4.0)
{
let kwargs = bag_pack('features_cols', features_cols, 'anomaly_col', anomaly_col, 'score_col', score_col, 'anomalies_pct', anomalies_pct);
let code = ```if 1:
from sklearn.covariance import EllipticEnvelope
features_cols = kargs['features_cols']
anomaly_col = kargs['anomaly_col']
score_col = kargs['score_col']
anomalies_pct = kargs['anomalies_pct']
dff = df[features_cols]
ellipsoid = EllipticEnvelope(contamination=anomalies_pct/100.0)
for i in range(len(dff)):
dffi = dff.iloc[[i], :]
dffe = dffi.explode(features_cols)
ellipsoid.fit(dffe)
df.loc[i, anomaly_col] = (ellipsoid.predict(dffe) < 0).astype(int).tolist()
if score_col != '':
df.loc[i, score_col] = ellipsoid.decision_function(dffe).tolist()
result = df
```;
tbl
| evaluate hint.distribution=per_node python(typeof(*), code, kwargs)
};
// Usage
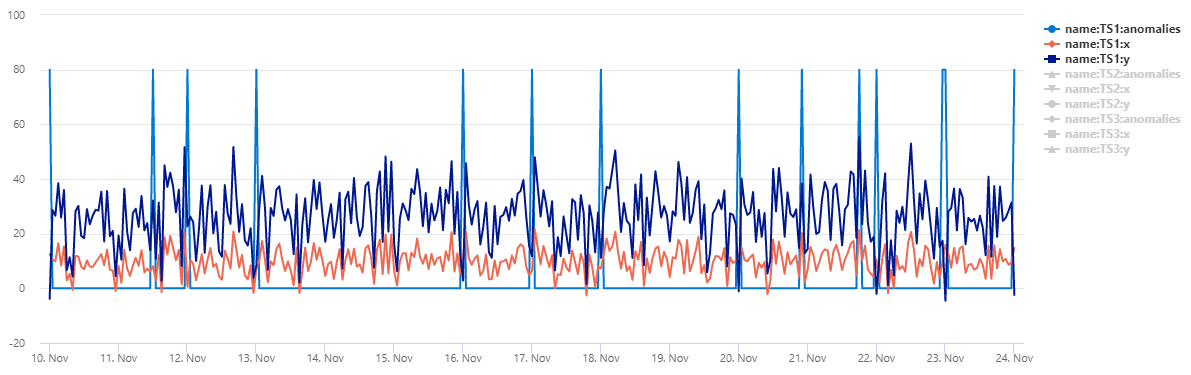
normal_2d_with_anomalies
| extend anomalies=dynamic(null), scores=dynamic(null)
| invoke series_mv_ee_anomalies_fl(pack_array('x', 'y'), 'anomalies', 'scores')
| extend anomalies=series_multiply(80, anomalies)
| render timechart
Output
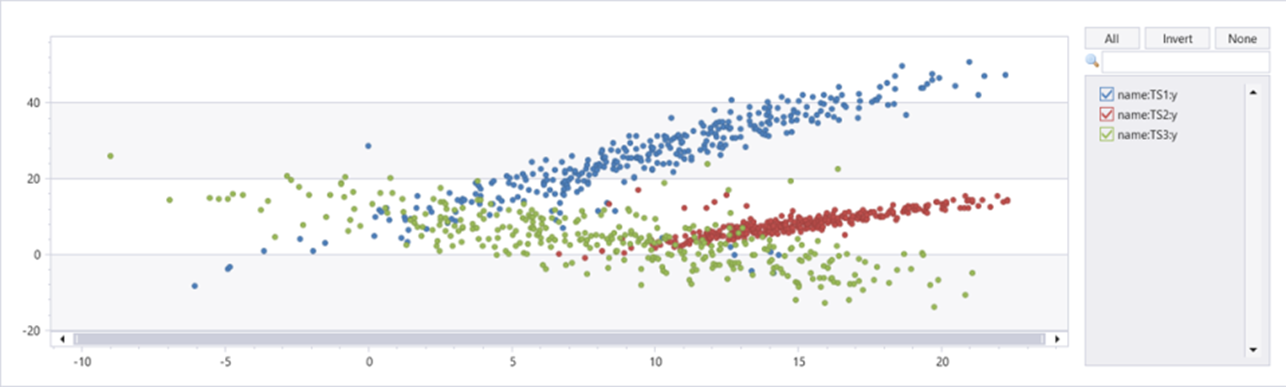
The table normal_2d_with_anomalies contains a set of 3 time series. Each time series has two-dimensional normal distribution with daily anomalies added at midnight, 8am, and 4pm respectively. You can create this sample dataset using an example query.
To view the data as a scatter chart, replace the usage code with the following:
normal_2d_with_anomalies
| extend anomalies=dynamic(null)
| invoke series_mv_ee_anomalies_fl(pack_array('x', 'y'), 'anomalies')
| where name == 'TS1'
| project x, y, anomalies
| mv-expand x to typeof(real), y to typeof(real), anomalies to typeof(string)
| render scatterchart with(series=anomalies)
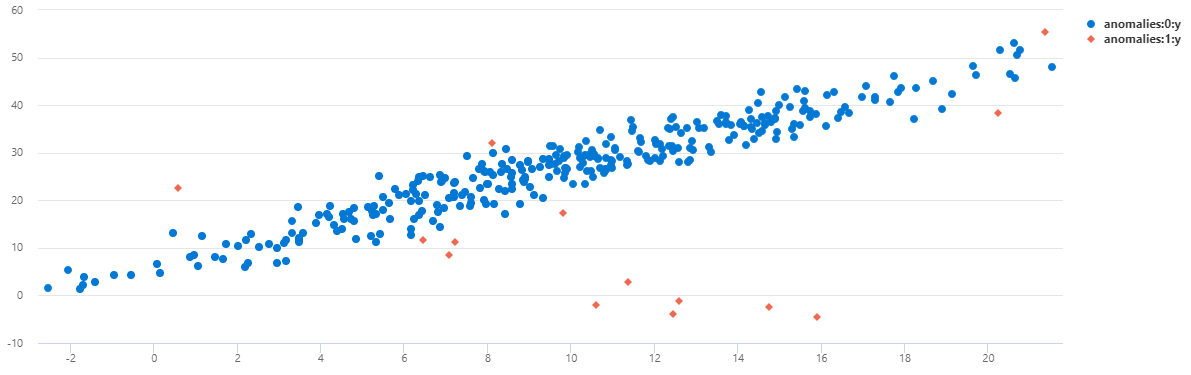
You can see that on TS1 most of the midnight anomalies were detected using this multivariate model.
Create a sample dataset
.set normal_2d_with_anomalies <|
//
let window=14d;
let dt=1h;
let n=toint(window/dt);
let rand_normal_fl=(avg:real=0.0, stdv:real=1.0)
{
    let x =rand()+rand()+rand()+rand()+rand()+rand()+rand()+rand()+rand()+rand()+rand()+rand();
    (x - 6)*stdv + avg
};
union
(range s from 0 to n step 1
| project t=startofday(now())-s*dt
| extend x=rand_normal_fl(10, 5)
| extend y=iff(hourofday(t) == 0, 2*(10-x)+7+rand_normal_fl(0, 3), 2*x+7+rand_normal_fl(0, 3))  //  anomalies every midnight
| extend name='TS1'),
(range s from 0 to n step 1
| project t=startofday(now())-s*dt
| extend x=rand_normal_fl(15, 3)
| extend y=iff(hourofday(t) == 8, (15-x)+10+rand_normal_fl(0, 2), x-7+rand_normal_fl(0, 1)) //  anomalies every 8am
| extend name='TS2'),
(range s from 0 to n step 1
| project t=startofday(now())-s*dt
| extend x=rand_normal_fl(8, 6)
| extend y=iff(hourofday(t) == 16, x+5+rand_normal_fl(0, 4), (12-x)+rand_normal_fl(0, 4)) //  anomalies every 4pm
| extend name='TS3')
| summarize t=make_list(t), x=make_list(x), y=make_list(y) by name