Note
Access to this page requires authorization. You can try signing in or changing directories.
Access to this page requires authorization. You can try changing directories.
Switch services using the Version drop-down list. Learn more about navigation.
Applies to: ✅ Azure Data Explorer ✅ Azure Monitor ✅ Microsoft Sentinel
Graph semantics enables modeling and querying data as interconnected networks. This approach excels at representing complex data with many-to-many relationships, hierarchical structures, and networked systems—including social networks, recommendation engines, connected assets, and knowledge graphs.
This article explores the following common scenarios for using KQL graph semantics:
- Social network analysis
- Log data insights
- Resource graph exploration
- Multi-domain security analysis
- Time series and graph analytics
- Digital twins and graph historization
Social network analysis
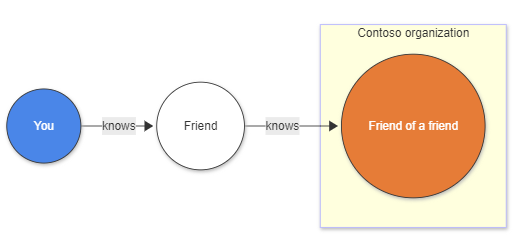
Social network analysis represents a fundamental graph use case where nodes are users and edges represent relationships or interactions. Consider a data model with a Users table containing user attributes (name, organization) and a Knows table documenting relationships between users:
Traditional approach challenges
Without graph semantics, finding "friends-of-friends" requires multiple complex joins:
let Users = datatable (UserId: string, name: string, org: string)[]; // nodes
let Knows = datatable (FirstUser: string, SecondUser: string)[]; // edges
Users
| where org == "Contoso"
| join kind=inner (Knows) on $left.UserId == $right.FirstUser
| join kind=innerunique(Users) on $left.SecondUser == $right.UserId
| join kind=inner (Knows) on $left.SecondUser == $right.FirstUser
| join kind=innerunique(Users) on $left.SecondUser1 == $right.UserId
| where UserId != UserId1
| project name, name1, name2
Graph semantics solution
KQL graph semantics simplifies this significantly. The make-graph operator creates a directed graph, while the graph-match operator expresses the pattern concisely:
let Users = datatable (UserId:string , name:string , org:string)[]; // nodes
let Knows = datatable (FirstUser:string , SecondUser:string)[]; // edges
Knows
| make-graph FirstUser --> SecondUser with Users on UserId
| graph-match (user)-->(middle_man)-->(friendOfAFriend)
    where user.org == "Contoso" and user.UserId != friendOfAFriend.UserId
    project contoso_person = user.name, middle_man = middle_man.name, kusto_friend_of_friend = friendOfAFriend.name
Log data insights
Log data analysis often requires extracting insights from flat tables containing time-series information. Converting this data to a graph structure requires identifying relevant entities and relationships. Consider a table called rawLogs containing web server request information:
let rawLogs = datatable (rawLog: string) [
    "31.56.96.51 - - [2019-01-22 03:54:16 +0330] \"GET /product/27 HTTP/1.1\" 200 5379 \"https://www.contoso.com/m/filter/b113\" \"some client\" \"-\"",
    "31.56.96.51 - - [2019-01-22 03:55:17 +0330] \"GET /product/42 HTTP/1.1\" 200 5667 \"https://www.contoso.com/m/filter/b113\" \"some client\" \"-\"",
    "54.36.149.41 - - [2019-01-22 03:56:14 +0330] \"GET /product/27 HTTP/1.1\" 200 30577 \"-\" \"some client\" \"-\""
];
Creating a graph from log data
Model the graph by treating source IP addresses as nodes and web requests to resources as edges. Use the parse operator to extract required columns:
let parsedLogs = rawLogs
    | parse rawLog with ipAddress: string " - - [" timestamp: datetime "] \"" httpVerb: string " " resource: string " " *
    | project-away rawLog;
let edges = parsedLogs;
let nodes =
    union
        (parsedLogs
        | distinct ipAddress
        | project nodeId = ipAddress, label = "IP address"),
        (parsedLogs | distinct resource | project nodeId = resource, label = "resource");
let graph = edges
    | make-graph ipAddress --> resource with nodes on nodeId;
This creates a directed graph where nodes are IP addresses or resources, and edges represent requests with timestamp and HTTP verb properties:

Query patterns for recommendations
Use graph-match to create simple recommendations based on resources requested by other IP addresses:
graph
| graph-match (startIp)-[request]->(resource)<--(otherIP)-[otherRequest]->(otherResource)
    where startIp.label == "IP address" and //start with an IP address
    resource.nodeId != otherResource.nodeId and //recommending a different resource
    startIp.nodeId != otherIP.nodeId and //only other IP addresses are interesting
    (request.timestamp - otherRequest.timestamp < 5m) //filter on recommendations based on the last 5 minutes
    project Recommendation=otherResource.nodeId
Output:
| Recommendation |
|---|
| /product/42 |
This demonstrates how graph semantics can extract meaningful insights from raw log data.
Resource graph exploration
Resource graphs enable efficient exploration and querying of resources at scale, supporting governance, management, and security requirements. These graphs continuously update as resources change, providing dynamic tracking of your resource inventory.

Enterprise resource management challenges
Consider an enterprise with complex cloud infrastructure containing:
- Virtual machines, databases, storage accounts, and networking components
- User identities with varying permissions across multiple environments
- Complex resource hierarchies spanning different organizational units
The key challenge lies in efficiently managing and querying this extensive resource inventory for security compliance and access control.
Graph-based solutions
KQL graph semantics enables security administrators to model complex resource hierarchies and permission structures as graphs. This approach supports powerful queries that can:
- Trace access paths from users through groups to resources
- Identify overprivileged accounts and potential security vulnerabilities
- Detect configuration issues in resource permissions
- Validate compliance with organizational policies
For enterprise-scale resource graphs, materialized views can represent the current state of nodes and edges, enabling both real-time analysis and historical queries of how resources and permissions have evolved over time.
For detailed examples and sample code, see the Resource Graph samples on GitHub.
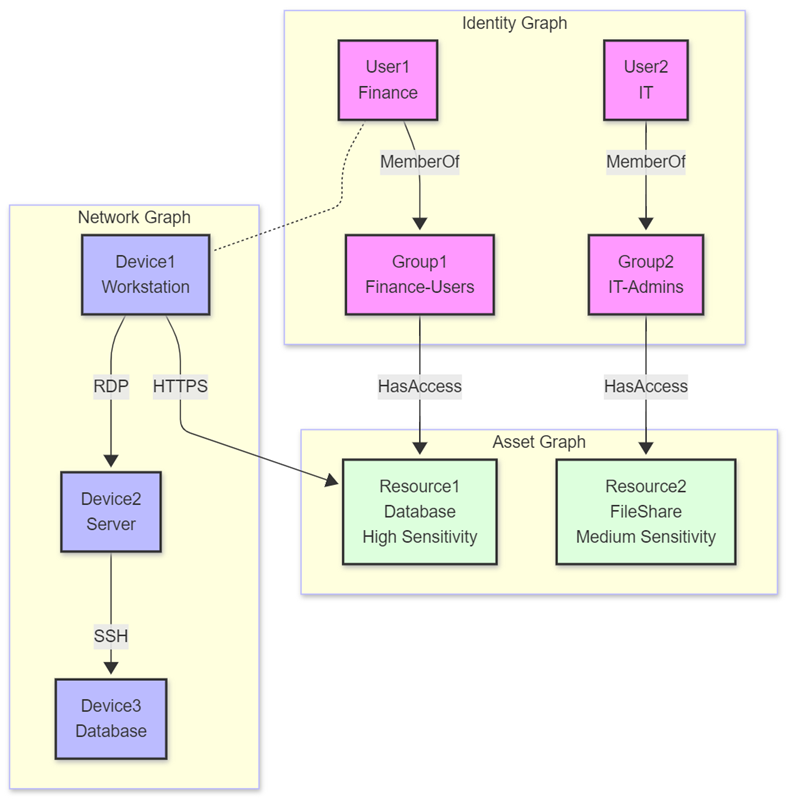
Multi-domain security analysis
Security operations often require analyzing relationships across multiple domains simultaneously. The "Graph of Graph" approach enables modeling and analyzing interconnected data structures by combining separate graph domains: identity, network, and asset graphs.
Multi-domain analysis methodology
This methodology maintains separation between domain-specific graphs while enabling sophisticated cross-domain analysis through query composition. Consider a scenario where an organization needs to detect sophisticated attacks using:
- Identity graph - Modeling users, groups, and permissions to understand access rights
- Network graph - Representing devices and connections to detect unusual network patterns
- Asset graph - Cataloging resources and sensitivity levels to assess potential impact
Advanced security insights
By traversing relationships across these domains, security analysts can identify attack paths invisible when examining each domain separately. This approach excels at:
- Detecting lateral movement across network segments
- Identifying privilege escalation attempts via group membership changes
- Discovering data exfiltration from high-sensitivity resources
- Correlating authentication patterns with resource access
For detailed examples and implementation guidance, see the Graph of Graph samples on GitHub.
Time series and graph analytics
Combining graph analysis with time-series analytics creates a powerful framework for detecting temporal anomalies while understanding their impact across interconnected systems. This integration delivers significant value for security analytics, IoT monitoring, and operational intelligence.
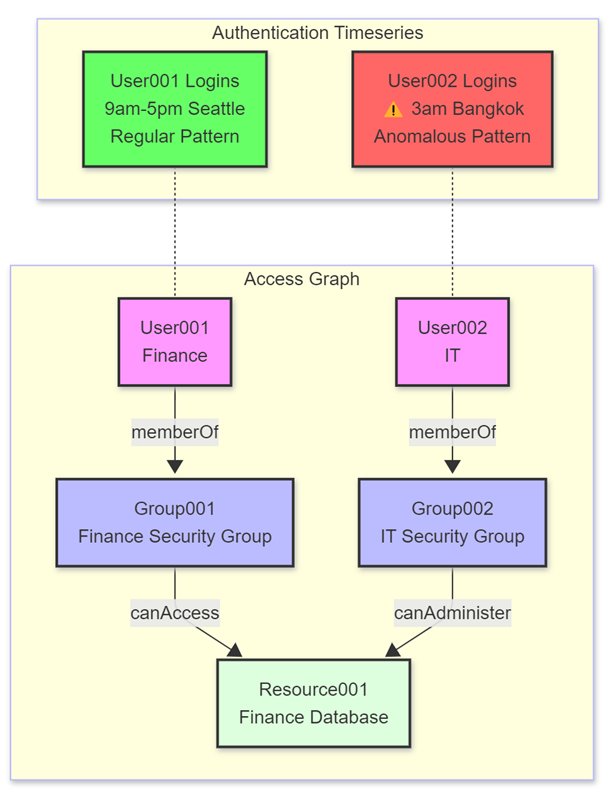
Temporal anomaly detection with context
Time-series data often contains temporal patterns indicating normal or anomalous behavior. When combined with graph structures, these patterns gain meaningful context through relationship and access path analysis.
Security applications
In security contexts, this integration identifies potentially malicious activities through:
- Authentication anomaly detection - Flagging logins deviating from usual patterns (time, location, frequency)
- Access path analysis - Determining what sensitive resources anomalous users can reach through permission chains
- Impact assessment - Evaluating the potential blast radius of unusual activity
Broader applications
Beyond security, this approach applies to:
- IoT systems - Correlating device anomalies with connected infrastructure
- Business operations - Linking transaction anomalies with organizational structures
- IT infrastructure - Connecting performance anomalies with service dependencies
By combining time-series and graph analytics, KQL enables analysts to understand both the nature of anomalies and their contextual impact across interconnected systems.
For implementation examples and detailed code samples, see the Time Series and Graph samples on GitHub.
Digital twins and graph historization
Digital twins provide virtual representations of physical objects or systems, enabling precise modeling and simulation of real-world entities. Graph semantics in KQL excels in digital twin scenarios because relationships between entities—facilities, equipment, sensors, and people—naturally form graph structures.

Digital twin capabilities with KQL
Graph semantics enables comprehensive digital twin modeling through:
- Hierarchical modeling - Representing complex facility and equipment hierarchies
- Multi-entity relationships - Connecting physical assets, virtual representations, and human operators
- Real-time state tracking - Monitoring occupancy, equipment status, and environmental conditions
- Cross-domain analysis - Correlating physical space utilization with operational metrics
Graph historization for temporal analysis
A critical aspect of digital twin management is capturing and analyzing temporal changes. By historizing graph changes, organizations can:
- Track evolution over time - Monitor how physical spaces and systems change
- Conduct historical analysis - Identify patterns and trends in utilization and performance
- Compare historical states - Detect anomalies or measure improvements across time periods
- Develop predictive models - Use historical utilization patterns for future planning and optimization
Implementation benefits
This approach enables organizations to:
- Monitor space utilization patterns and optimize facility management
- Track equipment performance and predict maintenance needs
- Analyze environmental conditions and their impact on operations
- Correlate human behavior patterns with physical infrastructure usage
For detailed implementation examples and code samples, see the Digital Twins samples on GitHub.