Note
Access to this page requires authorization. You can try signing in or changing directories.
Access to this page requires authorization. You can try changing directories.
Switch services using the Version drop-down list. Learn more about navigation.
Applies to: ✅ Azure Data Explorer
Graphistry adds server-side GPU layout and filtering on top of KQL graph semantics for iterative exploration of large or dense connected data: heavy parallel layout/clustering runs on a managed GPU, only light render data streams to the browser for consistent responsiveness across devices, enabling rapid refine-explore cycles on focused KQL results while preserving governance (deploy in your subscription, limit exported attributes, keep stable identifiers, filter early, iterate as needed, and share live views without producing static exports).
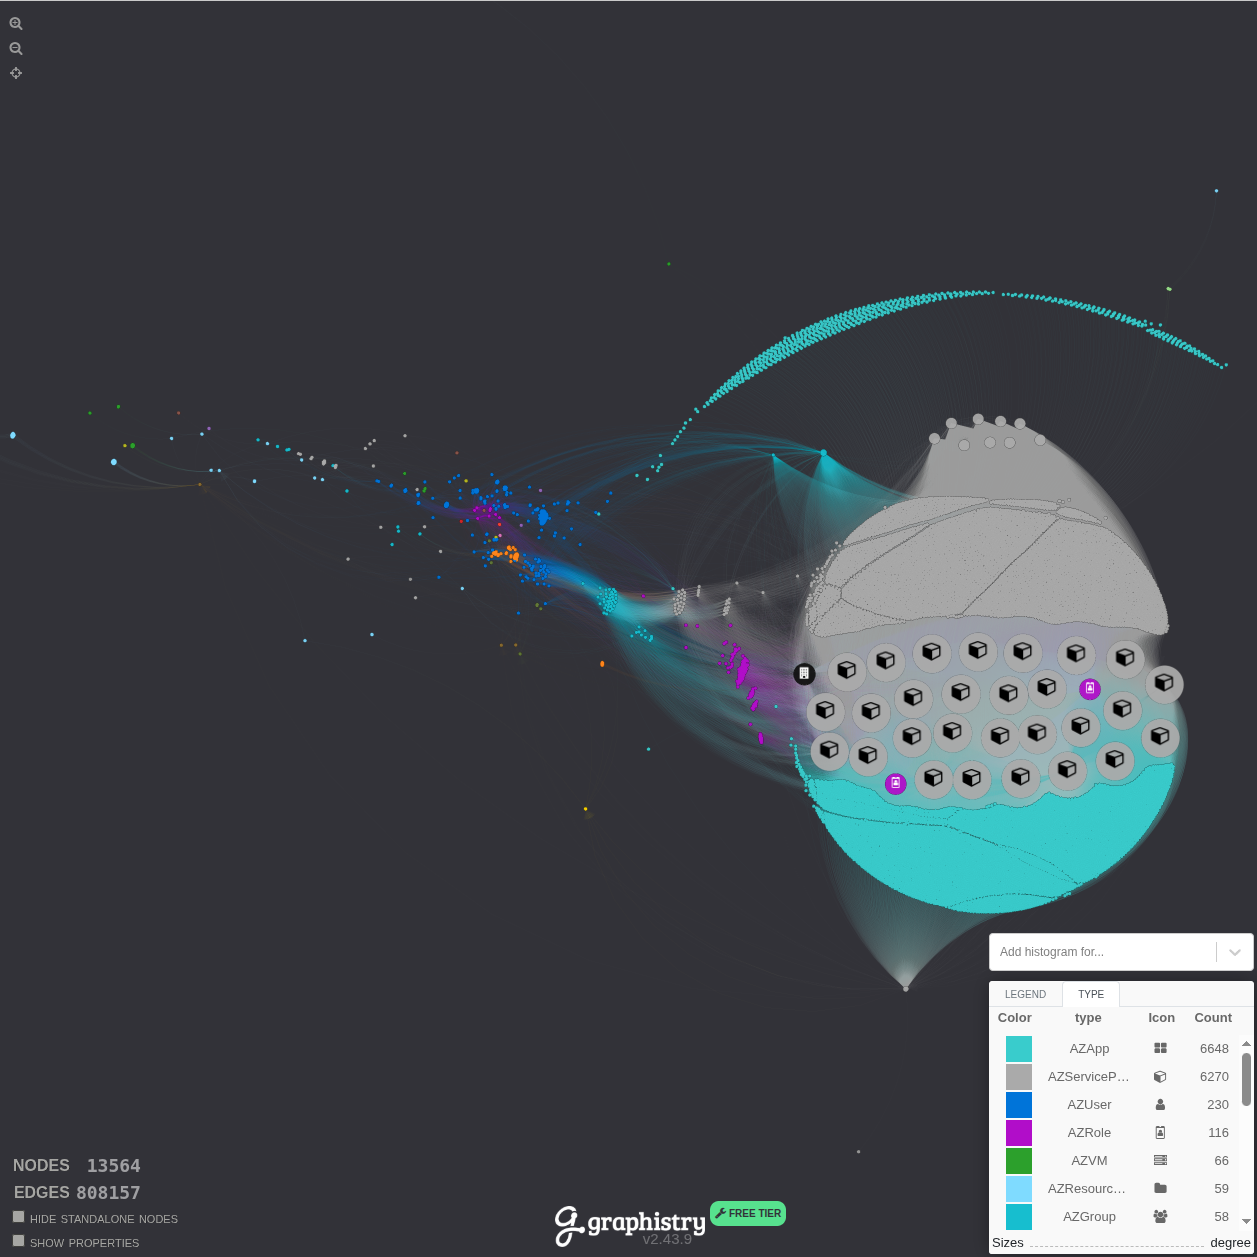
The following example shows Graphistry visualizing the BloodHound Entra ID graph from the graph sample data. The first image shows the zoomed-out view allowing you to see the entirety of the graph structure:
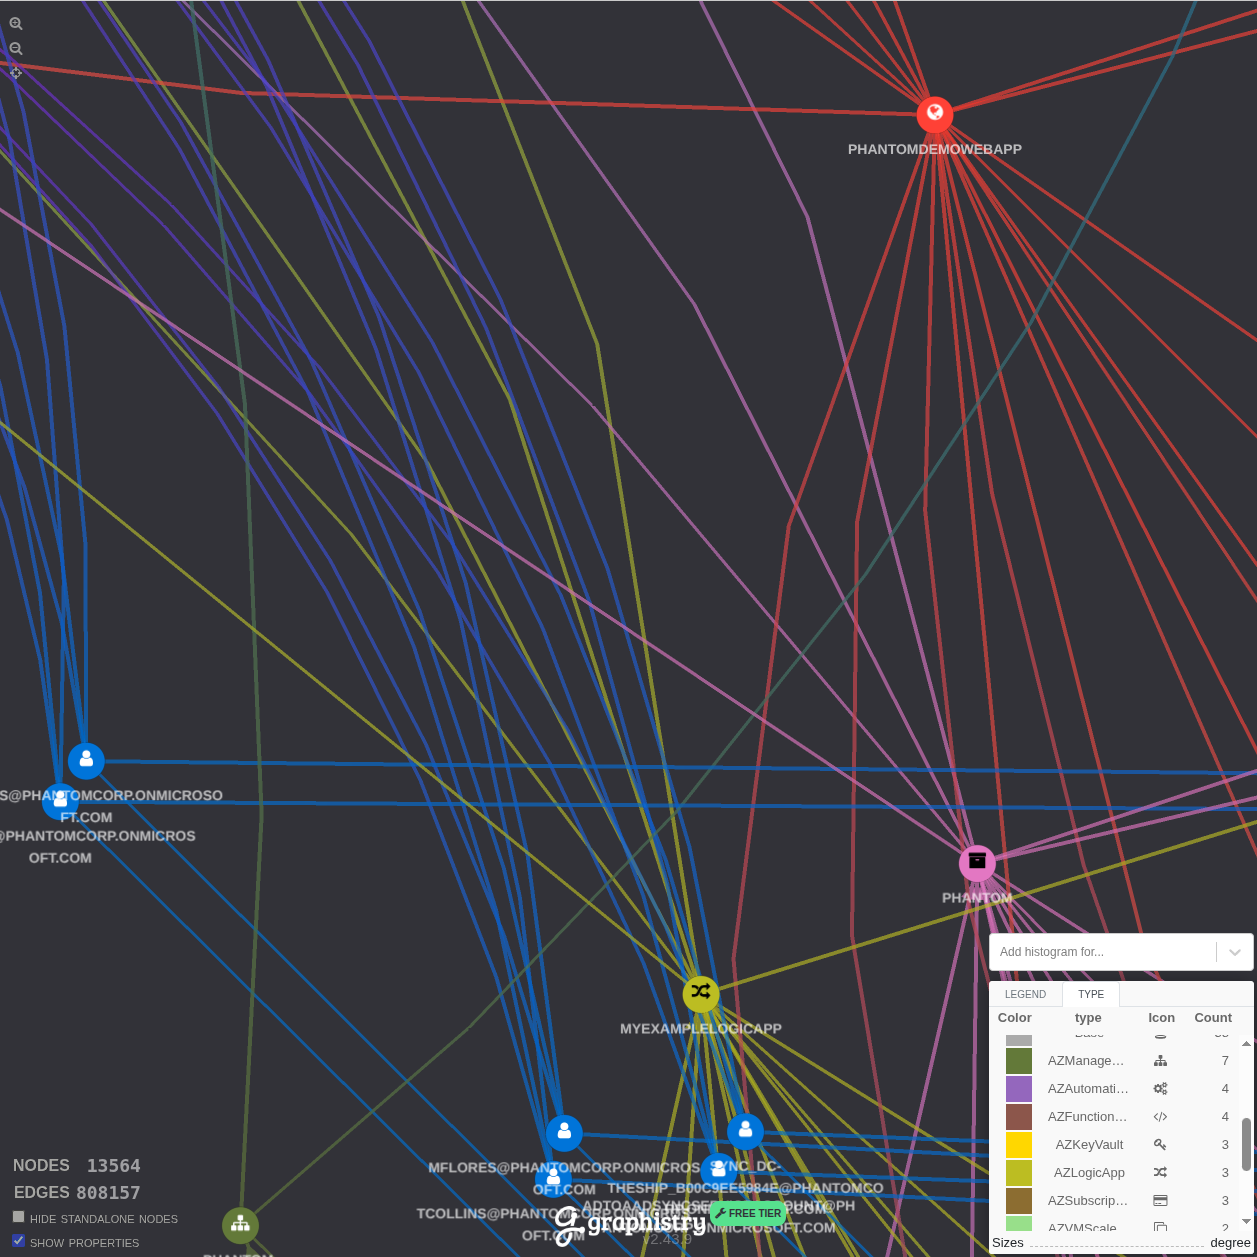
The second image demonstrates what happens when you zoom in to examine specific relationship patterns and node details:
Deploy Graphistry Core in your Azure subscription (Azure Marketplace) so GPU processing stays in-boundary. See the integration blog and the concise demo notebook for a hands-on sample.