Note
Access to this page requires authorization. You can try signing in or changing directories.
Access to this page requires authorization. You can try changing directories.
Switch services using the Version drop-down list. Learn more about navigation.
Applies to: ✅ Azure Data Explorer
Calculates the session count based on the ID column over a timeline. The plugin is invoked with the evaluate operator.
Syntax
TabularExpression | evaluate session_count(IdColumn, TimelineColumn, Start, End, Bin, LookBackWindow [, dim1, dim2, ...])
Learn more about syntax conventions.
Parameters
| Name | Type | Required | Description |
|---|---|---|---|
| TabularExpression | string |
✔️ | The tabular expression that serves as input. |
| IdColumn | string |
✔️ | The name of the column with ID values that represents user activity. |
| TimelineColumn | string |
✔️ | The name of the column that represents the timeline. |
| Start | scalar | ✔️ | The start of the analysis period. |
| End | scalar | ✔️ | The end of the analysis period. |
| Bin | scalar | ✔️ | The session's analysis step period. |
| LookBackWindow | scalar | ✔️ | The session lookback period. If the ID from IdColumn appears in a time window within LookBackWindow, the session is considered to be an existing one. If the ID doesn't appear, then the session is considered to be new. |
| dim1, dim2, ... | string |
A list of the dimensions columns that slice the session count calculation. |
Returns
Returns a table that has the session count values for each timeline period and for each existing dimensions combination.
Output table schema is:
| TimelineColumn | dim1 | .. | dim_n | count_sessions |
|---|---|---|---|---|
| type: as of TimelineColumn | .. | .. | .. | long |
Examples
For this example, the data is deterministic, and we use a table with two columns:
Timeline: a running number from 1 to 10,000Id: ID of the user from 1 to 50
Id appears at the specific Timeline slot if it's a divider of Timeline (Timeline % Id == 0).
An event with Id==1 will appear at any Timeline slot, an event with Id==2 at every second Timeline slot, and so on.
Here are 20 lines of the data:
let _data = range Timeline from 1 to 10000 step 1
    | extend __key = 1
    | join kind=inner (range Id from 1 to 50 step 1 | extend __key=1) on __key
    | where Timeline % Id == 0
    | project Timeline, Id;
// Look on few lines of the data
_data
| order by Timeline asc, Id asc
| take 20
Output
| Timeline | Id |
|---|---|
| 1 | 1 |
| 2 | 1 |
| 2 | 2 |
| 3 | 1 |
| 3 | 3 |
| 4 | 1 |
| 4 | 2 |
| 4 | 4 |
| 5 | 1 |
| 5 | 5 |
| 6 | 1 |
| 6 | 2 |
| 6 | 3 |
| 6 | 6 |
| 7 | 1 |
| 7 | 7 |
| 8 | 1 |
| 8 | 2 |
| 8 | 4 |
| 8 | 8 |
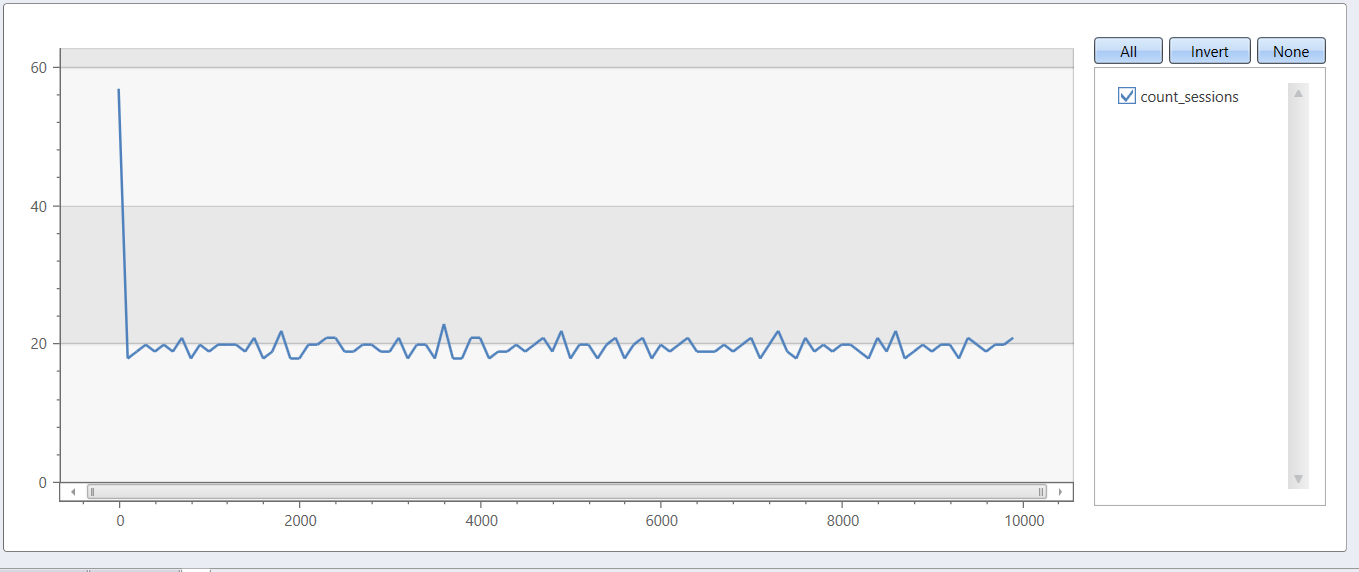
Let's define a session in next terms: session considered to be active as long as user (Id) appears at least once at a timeframe of 100 time slots, while session look-back window is 41 time slots.
The next query shows the count of active sessions according to the above definition.
let _data = range Timeline from 1 to 9999 step 1
    | extend __key = 1
    | join kind=inner (range Id from 1 to 50 step 1 | extend __key=1) on __key
    | where Timeline % Id == 0
    | project Timeline, Id;
// End of data definition
_data
| evaluate session_count(Id, Timeline, 1, 10000, 100, 41)
| render linechart