Note
Access to this page requires authorization. You can try signing in or changing directories.
Access to this page requires authorization. You can try changing directories.
APPLIES TO:  Azure Data Factory
  Azure Synapse Analytics
Use the Data Flow activity to transform and move data via mapping data flows. If you're new to data flows, see Mapping Data Flow overview
Create a Data Flow activity with UI
To use a Data Flow activity in a pipeline, complete the following steps:
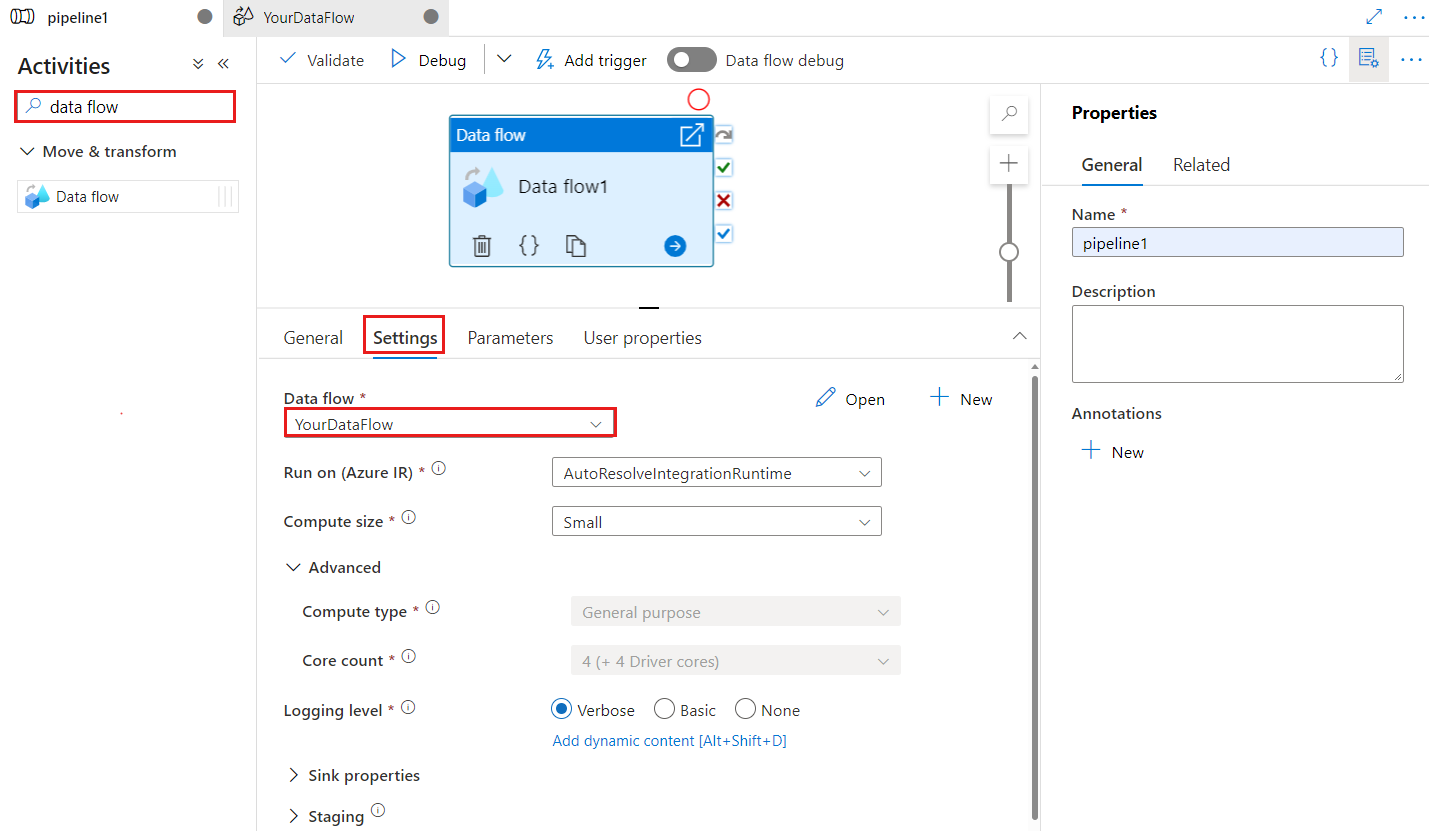
Search for Data Flow in the pipeline Activities pane, and drag a Data Flow activity to the pipeline canvas.
Select the new Data Flow activity on the canvas if it isn't already selected, and its Settings tab, to edit its details.
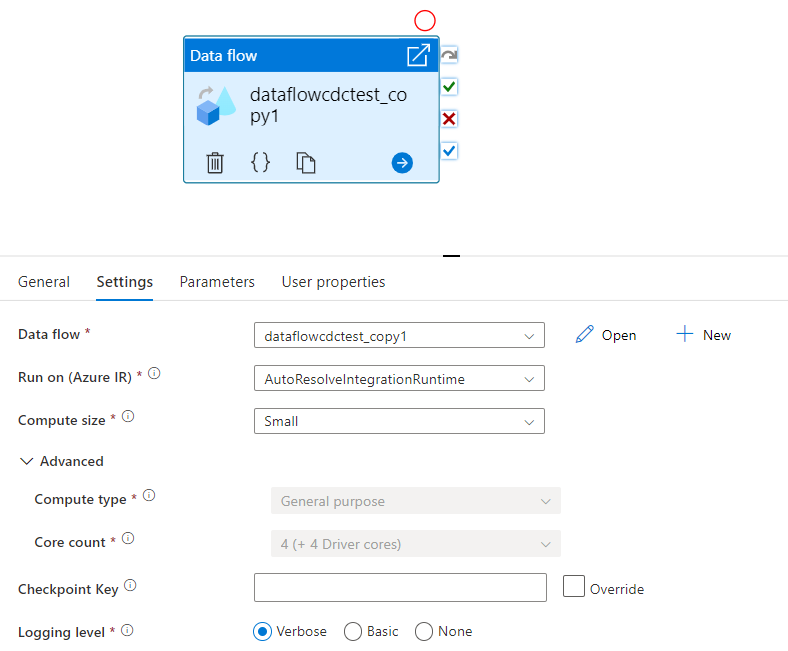
Checkpoint key is used to set the checkpoint when data flow is used for changed data capture. You can overwrite it. Data flow activities use a guid value as checkpoint key instead of "pipeline name + activity name" so that it can always keep tracking customer's change data capture state even there's any renaming actions. All existing data flow activity uses the old pattern key for backward compatibility. Checkpoint key option after publishing a new data flow activity with change data capture enabled data flow resource is shown as below.
Select an existing data flow or create a new one using the New button. Select other options as required to complete your configuration.
Syntax
{
    "name": "MyDataFlowActivity",
    "type": "ExecuteDataFlow",
    "typeProperties": {
      "dataflow": {
         "referenceName": "MyDataFlow",
         "type": "DataFlowReference"
      },
      "compute": {
         "coreCount": 8,
         "computeType": "General"
      },
      "traceLevel": "Fine",
      "runConcurrently": true,
      "continueOnError": true,
      "staging": {
          "linkedService": {
              "referenceName": "MyStagingLinkedService",
              "type": "LinkedServiceReference"
          },
          "folderPath": "my-container/my-folder"
      },
      "integrationRuntime": {
          "referenceName": "MyDataFlowIntegrationRuntime",
          "type": "IntegrationRuntimeReference"
      }
}
Type properties
| Property | Description | Allowed values | Required |
|---|---|---|---|
| dataflow | The reference to the Data Flow being executed | DataFlowReference | Yes |
| integrationRuntime | The compute environment the data flow runs on. If not specified, the autoresolve Azure integration runtime is used. | IntegrationRuntimeReference | No |
| compute.coreCount | The number of cores used in the spark cluster. Can only be specified if the autoresolve Azure Integration runtime is used | 8, 16, 32, 48, 80, 144, 272 | No |
| compute.computeType | The type of compute used in the spark cluster. Can only be specified if the autoresolve Azure Integration runtime is used | "General" | No |
| staging.linkedService | If you're using an Azure Synapse Analytics source or sink, specify the storage account used for PolyBase staging. If your Azure Storage is configured with VNet service endpoint, you must use managed identity authentication with "allow trusted Microsoft service" enabled on storage account, refer to Impact of using VNet Service Endpoints with Azure storage. Also learn the needed configurations for Azure Blob and Azure Data Lake Storage Gen2 respectively. |
LinkedServiceReference | Only if the data flow reads or writes to an Azure Synapse Analytics |
| staging.folderPath | If you're using an Azure Synapse Analytics source or sink, the folder path in blob storage account used for PolyBase staging | String | Only if the data flow reads or writes to Azure Synapse Analytics |
| traceLevel | Set logging level of your data flow activity execution | Fine, Coarse, None | No |

Dynamically size data flow compute at runtime
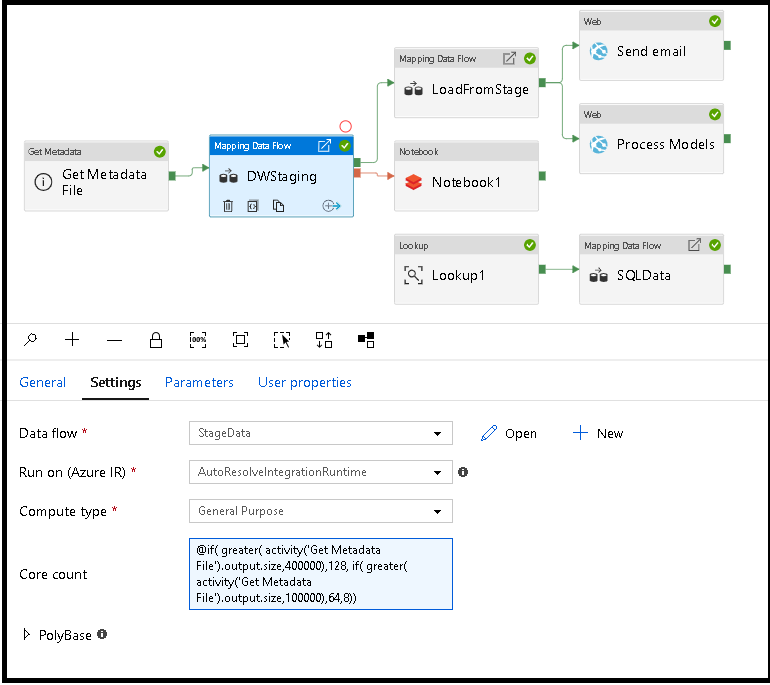
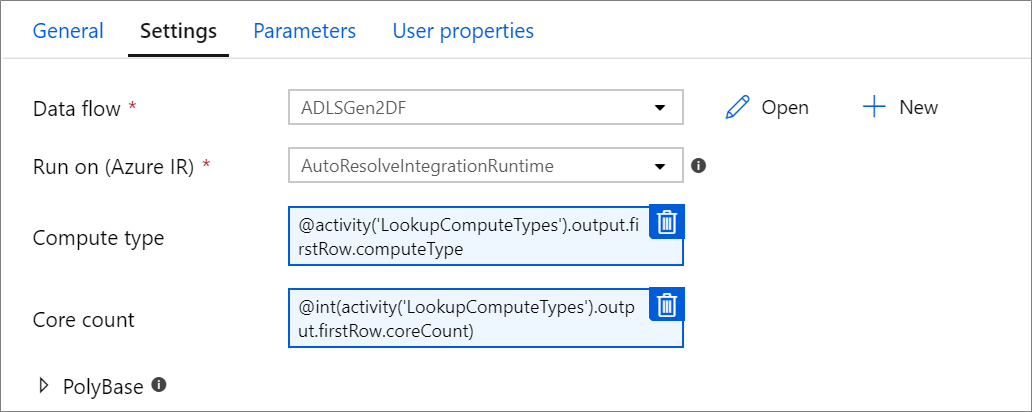
The Core Count and Compute Type properties can be set dynamically to adjust to the size of your incoming source data at runtime. Use pipeline activities like Lookup or Get Metadata in order to find the size of the source dataset data. Then, use Add Dynamic Content in the Data Flow activity properties. You can choose small, medium, or large compute sizes. Optionally, pick "Custom" and configure the compute types and number of cores manually.
Data Flow integration runtime
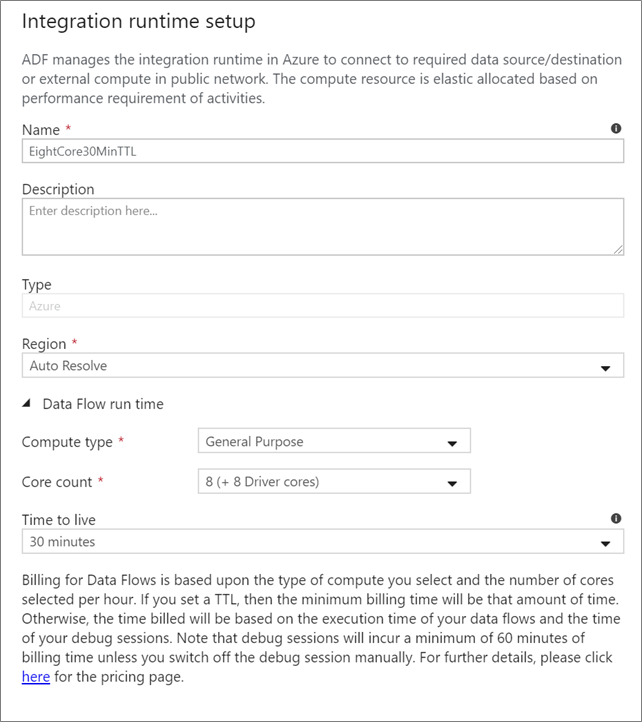
Choose which Integration Runtime to use for your Data Flow activity execution. By default, the service uses the autoresolve Azure Integration runtime with four worker cores. This IR has a general purpose compute type and runs in the same region as your service instance. For operationalized pipelines, it's highly recommended that you create your own Azure Integration Runtimes that define specific regions, compute type, core counts, and TTL for your data flow activity execution.
A minimum compute type of General Purpose with an 8+8 (16 total v-cores) configuration and a 10-minute Time to live (TTL) is the minimum recommendation for most production workloads. By setting a small TTL, the Azure IR can maintain a warm cluster that won't incur the several minutes of start time for a cold cluster. For more information, see Azure integration runtime.
Important
The Integration Runtime selection in the Data Flow activity only applies to triggered executions of your pipeline. Debugging your pipeline with data flows runs on the cluster specified in the debug session.
PolyBase
If you're using an Azure Synapse Analytics as a sink or source, you must choose a staging location for your PolyBase batch load. PolyBase allows for batch loading in bulk instead of loading the data row-by-row. PolyBase drastically reduces the load time into Azure Synapse Analytics.
Checkpoint key
When using the change capture option for data flow sources, ADF maintains and manages the checkpoint for you automatically. The default checkpoint key is a hash of the data flow name and the pipeline name. If you're using a dynamic pattern for your source tables or folders, you may wish to override this hash and set your own checkpoint key value here.
Logging level
If you don't require every pipeline execution of your data flow activities to fully log all verbose telemetry logs, you can optionally set your logging level to "Basic" or "None". When executing your data flows in "Verbose" mode (default), you're requesting the service to fully log activity at each individual partition level during your data transformation. This can be an expensive operation, so only enabling verbose when troubleshooting can improve your overall data flow and pipeline performance. "Basic" mode only logs transformation durations while "None" only provides a summary of durations.

Sink properties
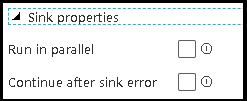
The grouping feature in data flows allows you to both set the order of execution of your sinks as well as to group sinks together using the same group number. To help manage groups, you can ask the service to run sinks, in the same group, in parallel. You can also set the sink group to continue even after one of the sinks encounters an error.
The default behavior of data flow sinks is to execute each sink sequentially, in a serial manner, and to fail the data flow when an error is encountered in the sink. Additionally, all sinks are defaulted to the same group unless you go into the data flow properties and set different priorities for the sinks.
First row only
This option is only available for data flows that have cache sinks enabled for "Output to activity". The output from the data flow that is injected directly into your pipeline is limited to 2MB. Setting "first row only" helps you to limit the data output from data flow when injecting the data flow activity output directly to your pipeline.
Parameterizing Data Flows
Parameterized datasets
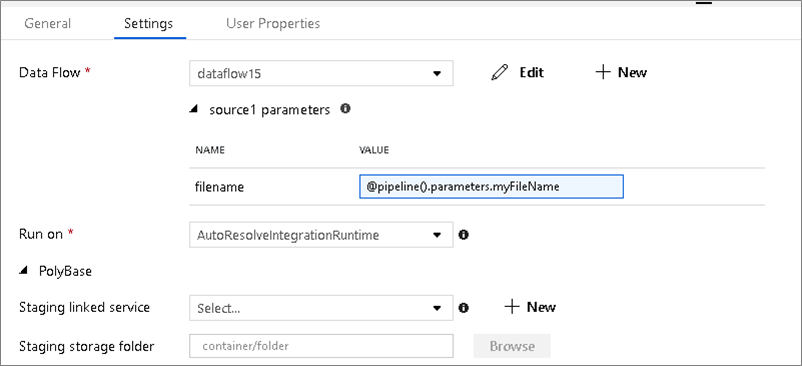
If your data flow uses parameterized datasets, set the parameter values in the Settings tab.
Parameterized data flows
If your data flow is parameterized, set the dynamic values of the data flow parameters in the Parameters tab. You can use either the pipeline expression language or the data flow expression language to assign dynamic or literal parameter values. For more information, see Data Flow Parameters.
Parameterized compute properties.
You can parameterize the core count or compute type if you use the autoresolve Azure Integration runtime and specify values for compute.coreCount and compute.computeType.
Pipeline debug of Data Flow activity
To execute a debug pipeline run with a Data Flow activity, you must switch on data flow debug mode via the Data Flow Debug slider on the top bar. Debug mode lets you run the data flow against an active Spark cluster. For more information, see Debug Mode.

The debug pipeline runs against the active debug cluster, not the integration runtime environment specified in the Data Flow activity settings. You can choose the debug compute environment when starting up debug mode.
Monitoring the Data Flow activity
The Data Flow activity has a special monitoring experience where you can view partitioning, stage time, and data lineage information. Open the monitoring pane via the eyeglasses icon under Actions. For more information, see Monitoring Data Flows.
Use Data Flow activity results in a subsequent activity
The data flow activity outputs metrics regarding the number of rows written to each sink and rows read from each source. These results are returned in the output section of the activity run result. The metrics returned are in the format of the below json.
{
    "runStatus": {
        "metrics": {
            "<your sink name1>": {
                "rowsWritten": <number of rows written>,
                "sinkProcessingTime": <sink processing time in ms>,
                "sources": {
                    "<your source name1>": {
                        "rowsRead": <number of rows read>
                    },
                    "<your source name2>": {
                        "rowsRead": <number of rows read>
                    },
                    ...
                }
            },
            "<your sink name2>": {
                ...
            },
            ...
        }
    }
}
For example, to get to number of rows written to a sink named 'sink1' in an activity named 'dataflowActivity', use @activity('dataflowActivity').output.runStatus.metrics.sink1.rowsWritten.
To get the number of rows read from a source named 'source1' that was used in that sink, use @activity('dataflowActivity').output.runStatus.metrics.sink1.sources.source1.rowsRead.
Note
If a sink has zero rows written, it won't show up in metrics. Existence can be verified using the contains function. For example, contains(activity('dataflowActivity').output.runStatus.metrics, 'sink1') checks whether any rows were written to sink1.
Related content
See supported control flow activities: