Note
Access to this page requires authorization. You can try signing in or changing directories.
Access to this page requires authorization. You can try changing directories.
This article describes troubleshooting steps and possible resolutions for issues when interacting with Azure HDInsight clusters.
Scenario: OutOfMemoryError or Unresponsive Apache Ambari Metrics Collector
Background
The Ambari Metrics Collector is a daemon that runs on a specific host in the cluster and receives data from the registered publishers, Monitors, and Sinks.
Issue
- You could receive a critical "Metrics Collector Process" alert in Ambari UI and show below similar message.
Connection failed: timed out to <headnode fqdn>:6188 - Ambari Metrics Collector maybe getting restarted in the headnode frequently
- Some Apache Ambari metrics may not show up in Ambari UI or Grafana. For example, NAMENODE shows Started instead of Active/Standby status. The 'No Data Available' message might appear in Ambari Dashboard
Cause
The following scenarios are possible causes of these issues:
An out of memory exception happens frequently
Check the Apache Ambari Metrics Collector log /var/log/ambari-metrics-collector/ambari-metrics-collector.log*.
19:59:45,457 ERROR [325874797@qtp-2095573052-22] log:87 - handle failed
java.lang.OutOfMemoryError: Java heap space

19:59:45,457 FATAL [MdsLoggerSenderThread] YarnUncaughtExceptionHandler:51 - Thread Thread[MdsLoggerSenderThread,5,main] threw an Error.  Shutting down now...
java.lang.OutOfMemoryError: Java heap space
Busy garbage collection
Apache Ambari Metrics Collector is not listening on 6188 in hbase-ams log
/var/log/ambari-metrics-collector/hbase-ams-master-hn*.log2021-04-13 05:57:37,546 INFO [timeline] timeline.HadoopTimelineMetricsSink: No live collector to send metrics to. Metrics to be sent will be discarded. This message will be skipped for the next 20 times.Get the Apache Ambari Metrics Collector
pidand check GC performanceps -fu ams | grep 'org.apache.ambari.metrics.AMSApplicationServer'Check the garbage collection status using
jstat -gcutil <pid> 1000 100. If you see the FGCT increase a lot in short seconds, it indicates Apache Ambari Metrics Collector is busy in Full GC and unable to process the other requests.
Resolution
To avoid these issues, consider using one of the following options:
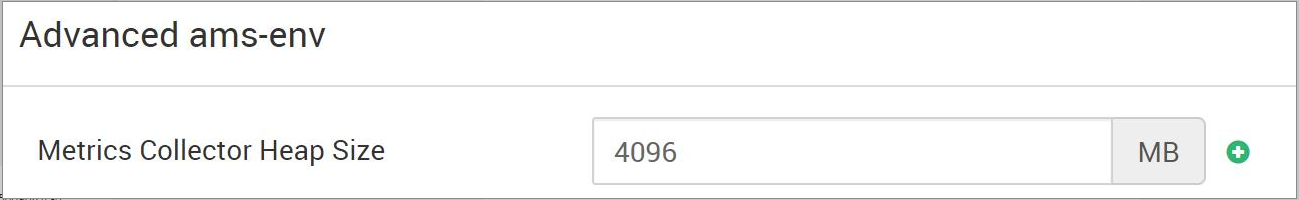
Increase the heap memory of Apache Ambari Metrics Collector from Ambari > Ambari Metrics > CONFIGS > Advanced ams-env > Metrics Collector Heap Size
Follow these steps to clean up Ambari Metrics service (AMS) data.
Note
Cleaning up the AMS data removes all the historical AMS data available. If you need the history, this may not be the best option.
- Login into the Ambari portal
- Set AMS to maintenance
- Stop AMS from Ambari
- Identify the following from the AMS Configs screen
1.
hbase.rootdir(Default value isfile:///mnt/data/ambari-metrics-collector/hbase) 2.hbase.tmp.dir(Default value is/var/lib/ambari-metrics-collector/hbase-tmp) - SSH into headnode where Apache Ambari Metrics Collector exists. As superuser:
- Remove the AMS zookeeper data by backing up and removing the contents of
'hbase.tmp.dir'/zookeeper - Remove any Phoenix spool files from
<hbase.tmp.dir>/phoenix-spoolfolder - (It is worthwhile to skip this step initially and try restarting AMS to see if the issue is resolved. If AMS is still failing to come up, try this step)
AMS data would be stored in
hbase.rootdiridentified above. Use regular OS commands to back up and remove the files. Example:tar czf /mnt/backupof-ambari-metrics-collector-hbase-$(date +%Y%m%d-%H%M%S).tar.gz /mnt/data/ambari-metrics-collector/hbase - Restart AMS using Ambari.
For Kafka cluster, if the above solutions do not help, consider the following solutions.
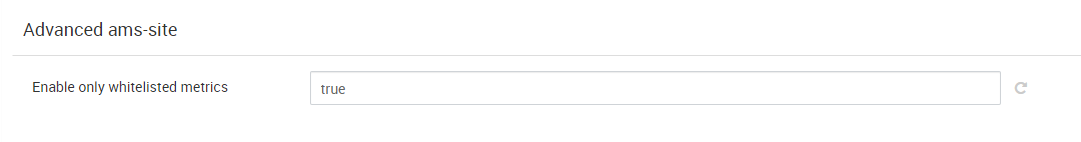
Ambari Metrics Service needs to deal with lots of kafka metrics, so it's a good idea to enable only metrics in the allowlist. Go to Ambari > Ambari Metrics > CONFIGS > Advanced ams-env, set below property to true. After this modification, need to restart the impacted services in Ambari UI as required.
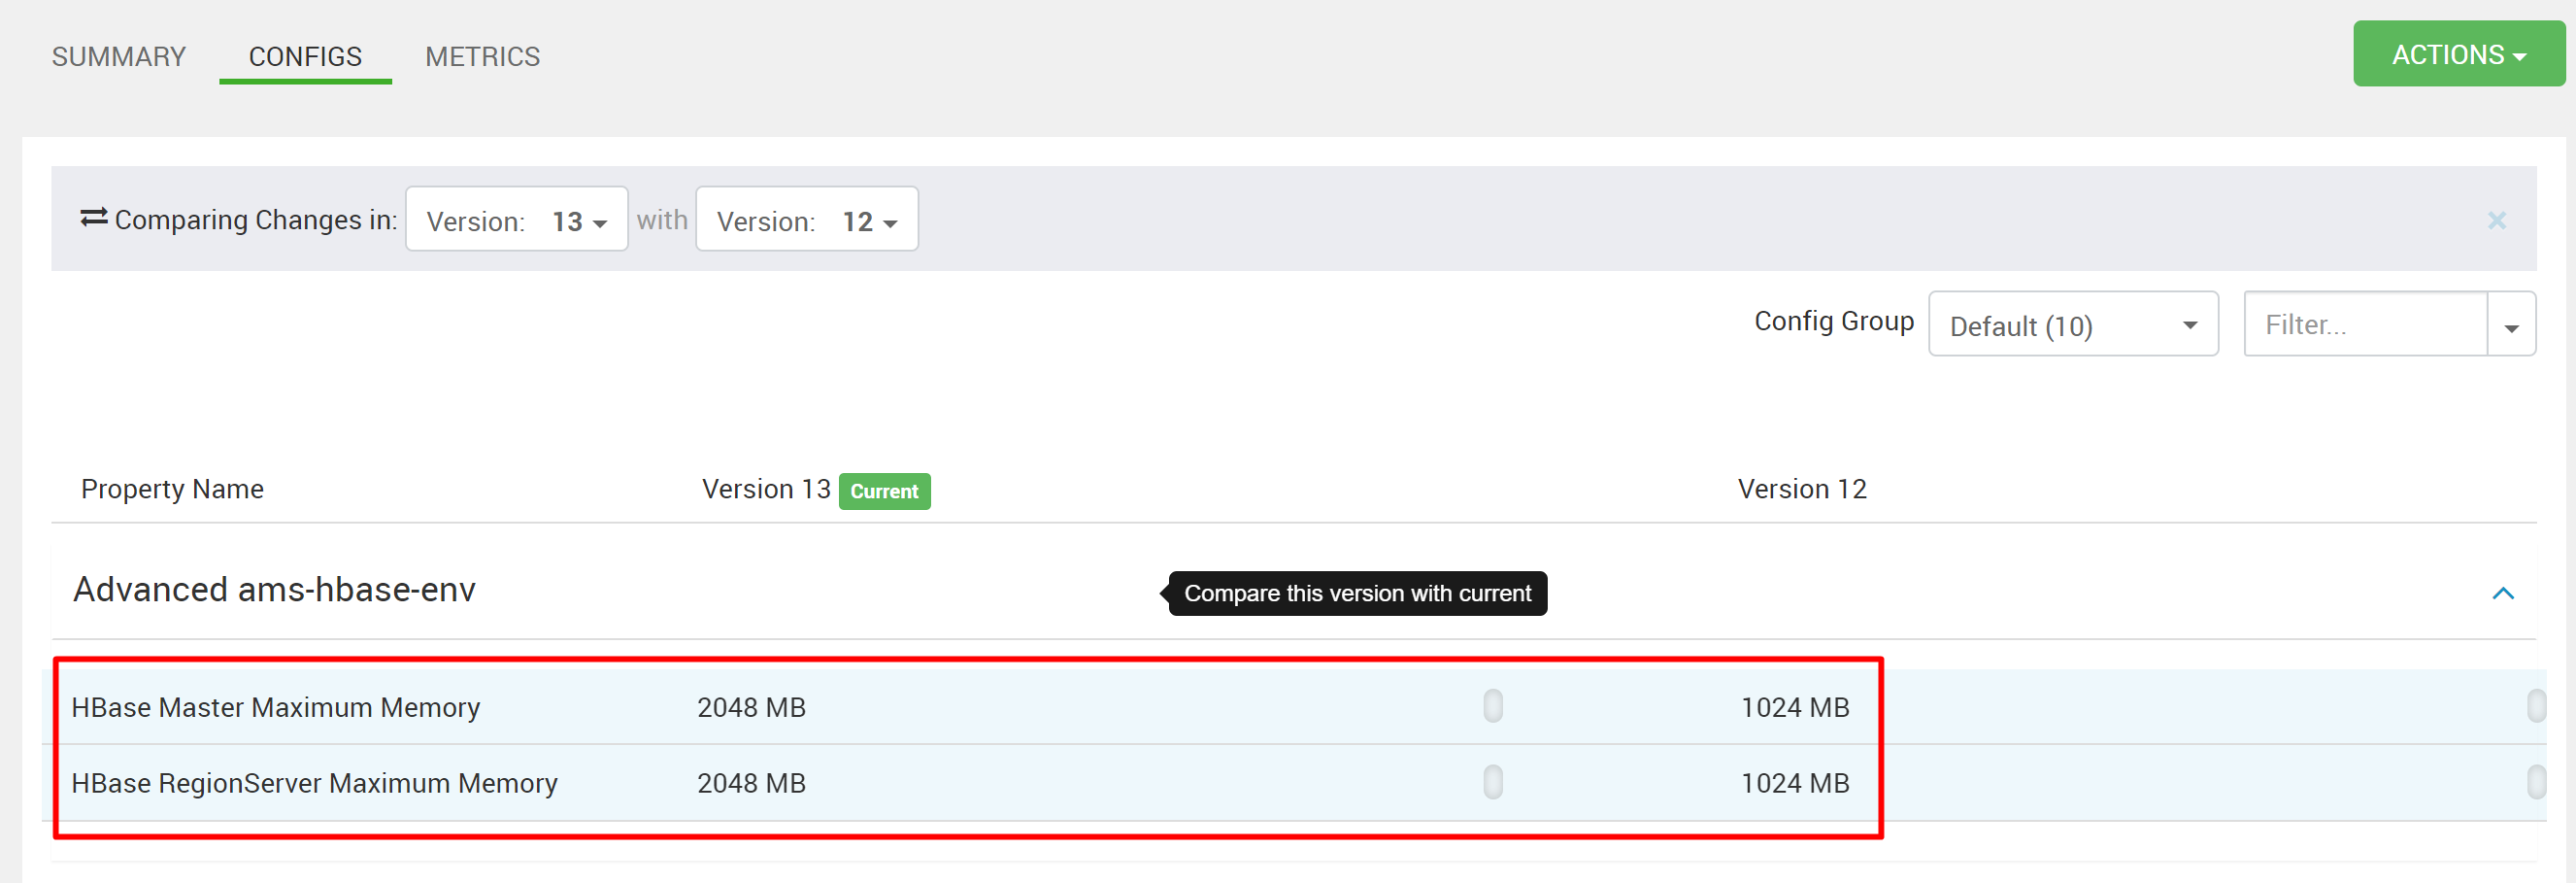
Handling lots of metrics for standalone HBase with limited memory would impact HBase response time. Hence metrics would be unavailable. If Kafka cluster has many topics and still generates a lot of allowed metrics, increase the heap memory for HMaster and RegionServer in Ambari Metrics Service. Go to Ambari > Ambari Metrics > CONFIGS > Advanced hbase-env > HBase Master Maximum Memory and HBase RegionServer Maximum Memory and increase the values. Restart the required services in Ambari UI.
Next steps
If you didn't see your problem or are unable to solve your issue, visit one of the following channels for more support:
- If you need more help, you can submit a support request from the Azure portal. Select Support from the menu bar or open the Help + support hub.