Note
Access to this page requires authorization. You can try signing in or changing directories.
Access to this page requires authorization. You can try changing directories.
In this tutorial, you learn how to create a dataframe from a csv file, and how to run interactive Spark SQL queries against an Apache Spark cluster in Azure HDInsight. In Spark, a dataframe is a distributed collection of data organized into named columns. Dataframe is conceptually equivalent to a table in a relational database or a data frame in R/Python.
In this tutorial, you learn how to:
- Create a dataframe from a csv file
- Run queries on the dataframe
Prerequisites
An Apache Spark cluster on HDInsight. See Create an Apache Spark cluster.
Create a Jupyter Notebook
Jupyter Notebook is an interactive notebook environment that supports various programming languages. The notebook allows you to interact with your data, combine code with markdown text and perform simple visualizations.
Edit the URL
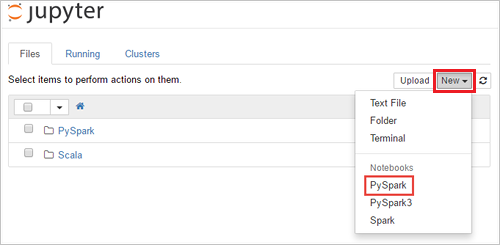
https://SPARKCLUSTER.azurehdinsight.cn/jupyterby replacingSPARKCLUSTERwith the name of your Spark cluster. Then enter the edited URL in a web browser. If prompted, enter the cluster login credentials for the cluster.From the Jupyter web page, For the Spark 2.4 clusters, Select New > PySpark to create a notebook. For the Spark 3.1 release, select New > PySpark3 instead to create a notebook because the PySpark kernel is no longer available in Spark 3.1.
A new notebook is created and opened with the name Untitled(
Untitled.ipynb).Note
By using the PySpark or the PySpark3 kernel to create a notebook, the
sparksession is automatically created for you when you run the first code cell. You do not need to explicitly create the session.
Create a dataframe from a csv file
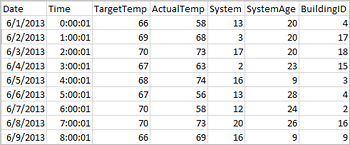
Applications can create dataframes directly from files or folders on the remote storage such as Azure Storage or Azure Data Lake Storage; from a Hive table; or from other data sources supported by Spark, such as Azure Cosmos DB, Azure SQL DB, DW, and so on. The following screenshot shows a snapshot of the HVAC.csv file used in this tutorial. The csv file comes with all HDInsight Spark clusters. The data captures the temperature variations of some buildings.
Paste the following code in an empty cell of the Jupyter Notebook, and then press SHIFT + ENTER to run the code. The code imports the types required for this scenario:
from pyspark.sql import *
from pyspark.sql.types import *
When you run an interactive query in Jupyter, the web browser window or tab caption shows a (Busy) status along with the notebook title. You also see a solid circle next to the PySpark text in the top-right corner. After the job is completed, it changes to a hollow circle.
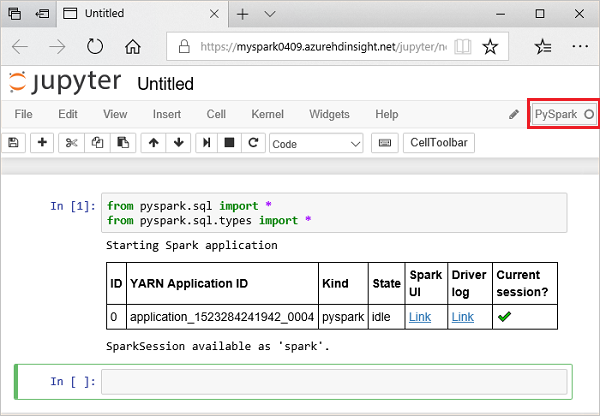
Note the session id returned. From the picture above, the session id is 0. If desired, you can retrieve the session details by navigating to
https://CLUSTERNAME.azurehdinsight.cn/livy/sessions/ID/statementswhere CLUSTERNAME is the name of your Spark cluster and ID is your session id number.Run the following code to create a dataframe and a temporary table (hvac) by running the following code.
# Create a dataframe and table from sample data
csvFile = spark.read.csv('/HdiSamples/HdiSamples/SensorSampleData/hvac/HVAC.csv', header=True, inferSchema=True)
csvFile.write.saveAsTable("hvac")
Run queries on the datanami
Once the table is created, you can run an interactive query on the data.
Run the following code in an empty cell of the notebook:
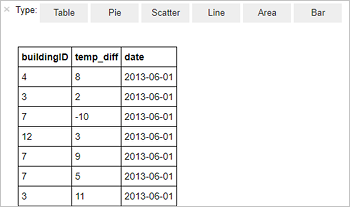
%%sql
SELECT buildingID, (targettemp - actualtemp) AS temp_diff, date FROM hvac WHERE date = \"6/1/13\"
The following tabular output is displayed.
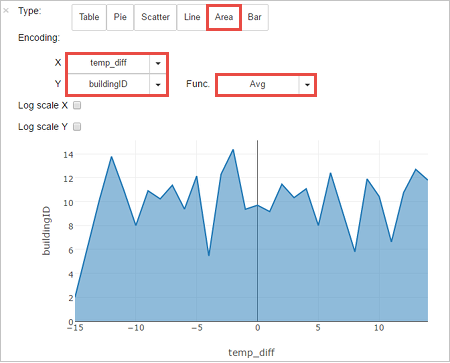
You can also see the results in other visualizations as well. To see an area graph for the same output, select Area then set other values as shown.
From the notebook menu bar, navigate to File > Save and Checkpoint.
If you're starting the next tutorial now, leave the notebook open. If not, shut down the notebook to release the cluster resources: from the notebook menu bar, navigate to File > Close and Halt.
Clean up resources
With HDInsight, your data and Jupyter Notebooks are stored in Azure Storage or Azure Data Lake Storage, so you can safely delete a cluster when it isn't in use. You're also charged for an HDInsight cluster, even when it's not in use. Since the charges for the cluster are many times more than the charges for storage, it makes economic sense to delete clusters when they aren't in use. If you plan to work on the next tutorial immediately, you might want to keep the cluster.
Open the cluster in the Azure portal, and select Delete.
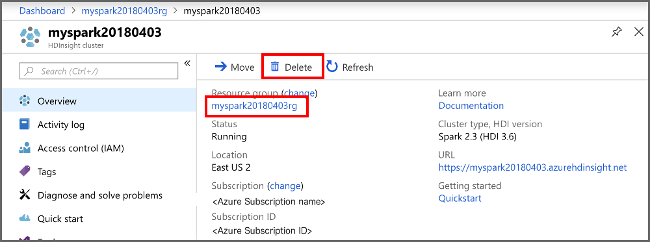
You can also select the resource group name to open the resource group page, and then select Delete resource group. By deleting the resource group, you delete both the HDInsight Spark cluster, and the default storage account.
Next steps
In this tutorial, you learned how to create a dataframe from a csv file, and how to run interactive Spark SQL queries against an Apache Spark cluster in Azure HDInsight. Advance to the next article to see how the data you registered in Apache Spark can be pulled into a BI analytics tool such as Power BI.