Note
Access to this page requires authorization. You can try signing in or changing directories.
Access to this page requires authorization. You can try changing directories.
Applies to:
![]() IoT Edge 1.5
IoT Edge 1.5
Important
IoT Edge 1.5 LTS is the supported release. IoT Edge 1.4 LTS reached end of life on November 12, 2024. If you're using an earlier release, see Update IoT Edge.
Use Azure Monitor Log alerts to monitor IoT Edge devices at scale. As highlighted in the solution architecture, Azure Monitor Log Analytics is used as the metrics database. This integration unlocks powerful and flexible alerting capabilities using resource-centric log alerts.
Important
This feature is currently only available for IoT Hub and not for IoT Central.
Create an alert rule
You can create a log alert rule for monitoring a broad range of conditions across your device fleet.
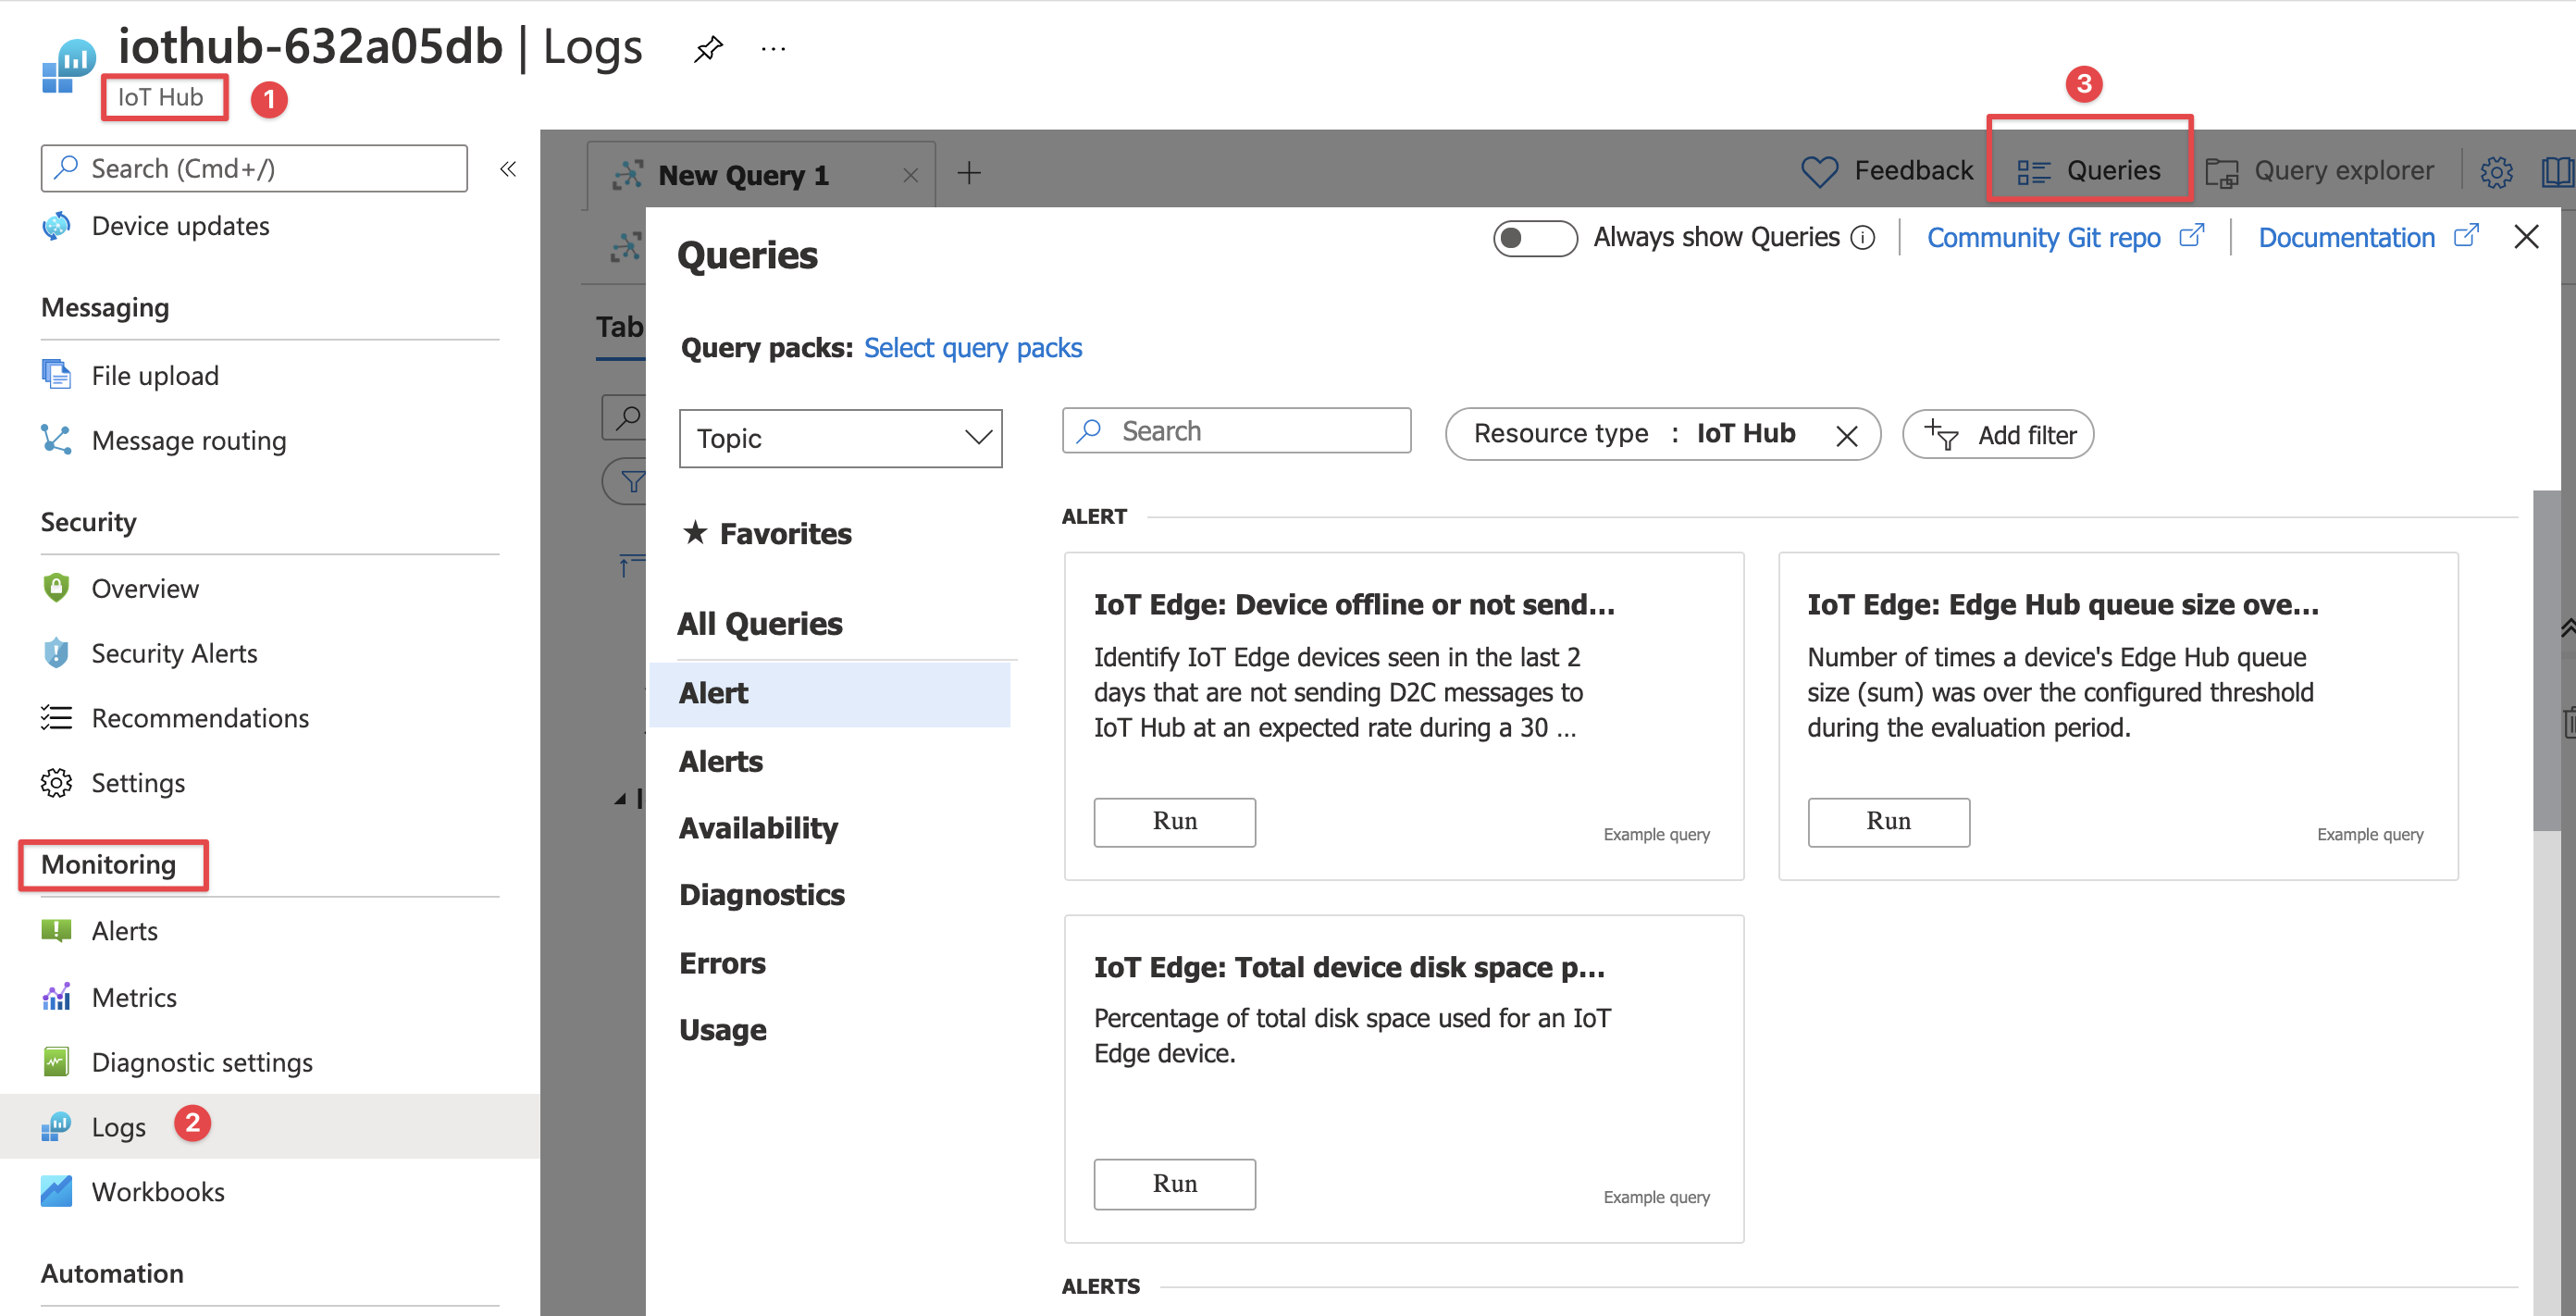
Sample KQL alert queries are provided under the IoT Hub resource. Queries that operate on metrics data from edge devices are prefixed with IoT Edge: in their title. Use these examples as-is or modify them as needed to create a query for your exact need.
To access the example alert queries, use the following steps:
- Sign in to the Azure portal and navigate to your IoT hub.
- Select Logs from the Monitoring section of the menu.
- The Queries example query browser will automatically open. If this is your first time to Logs you may have to close a video tutorial before you can see the query browser. The Queries tab can be used to bring up the example query browser again if you don't see it.
The metrics-collector module ingests all data into the standard InsightsMetrics table. You can create alert rules based on metrics data from custom modules by querying the same table.
Split by device dimension
All the example alert rule queries aggregate values by device ID. This grouping is needed to determine which device caused the alert to fire. You can select specific devices to enable the alert rule on or enable on all devices. Use the preview graph to explore the trend per device before setting the alert logic.
Choose notification preferences
Configure your notification preferences in an action group and associate it with an alert rule when creating an alert rule.
Select alert rule scope
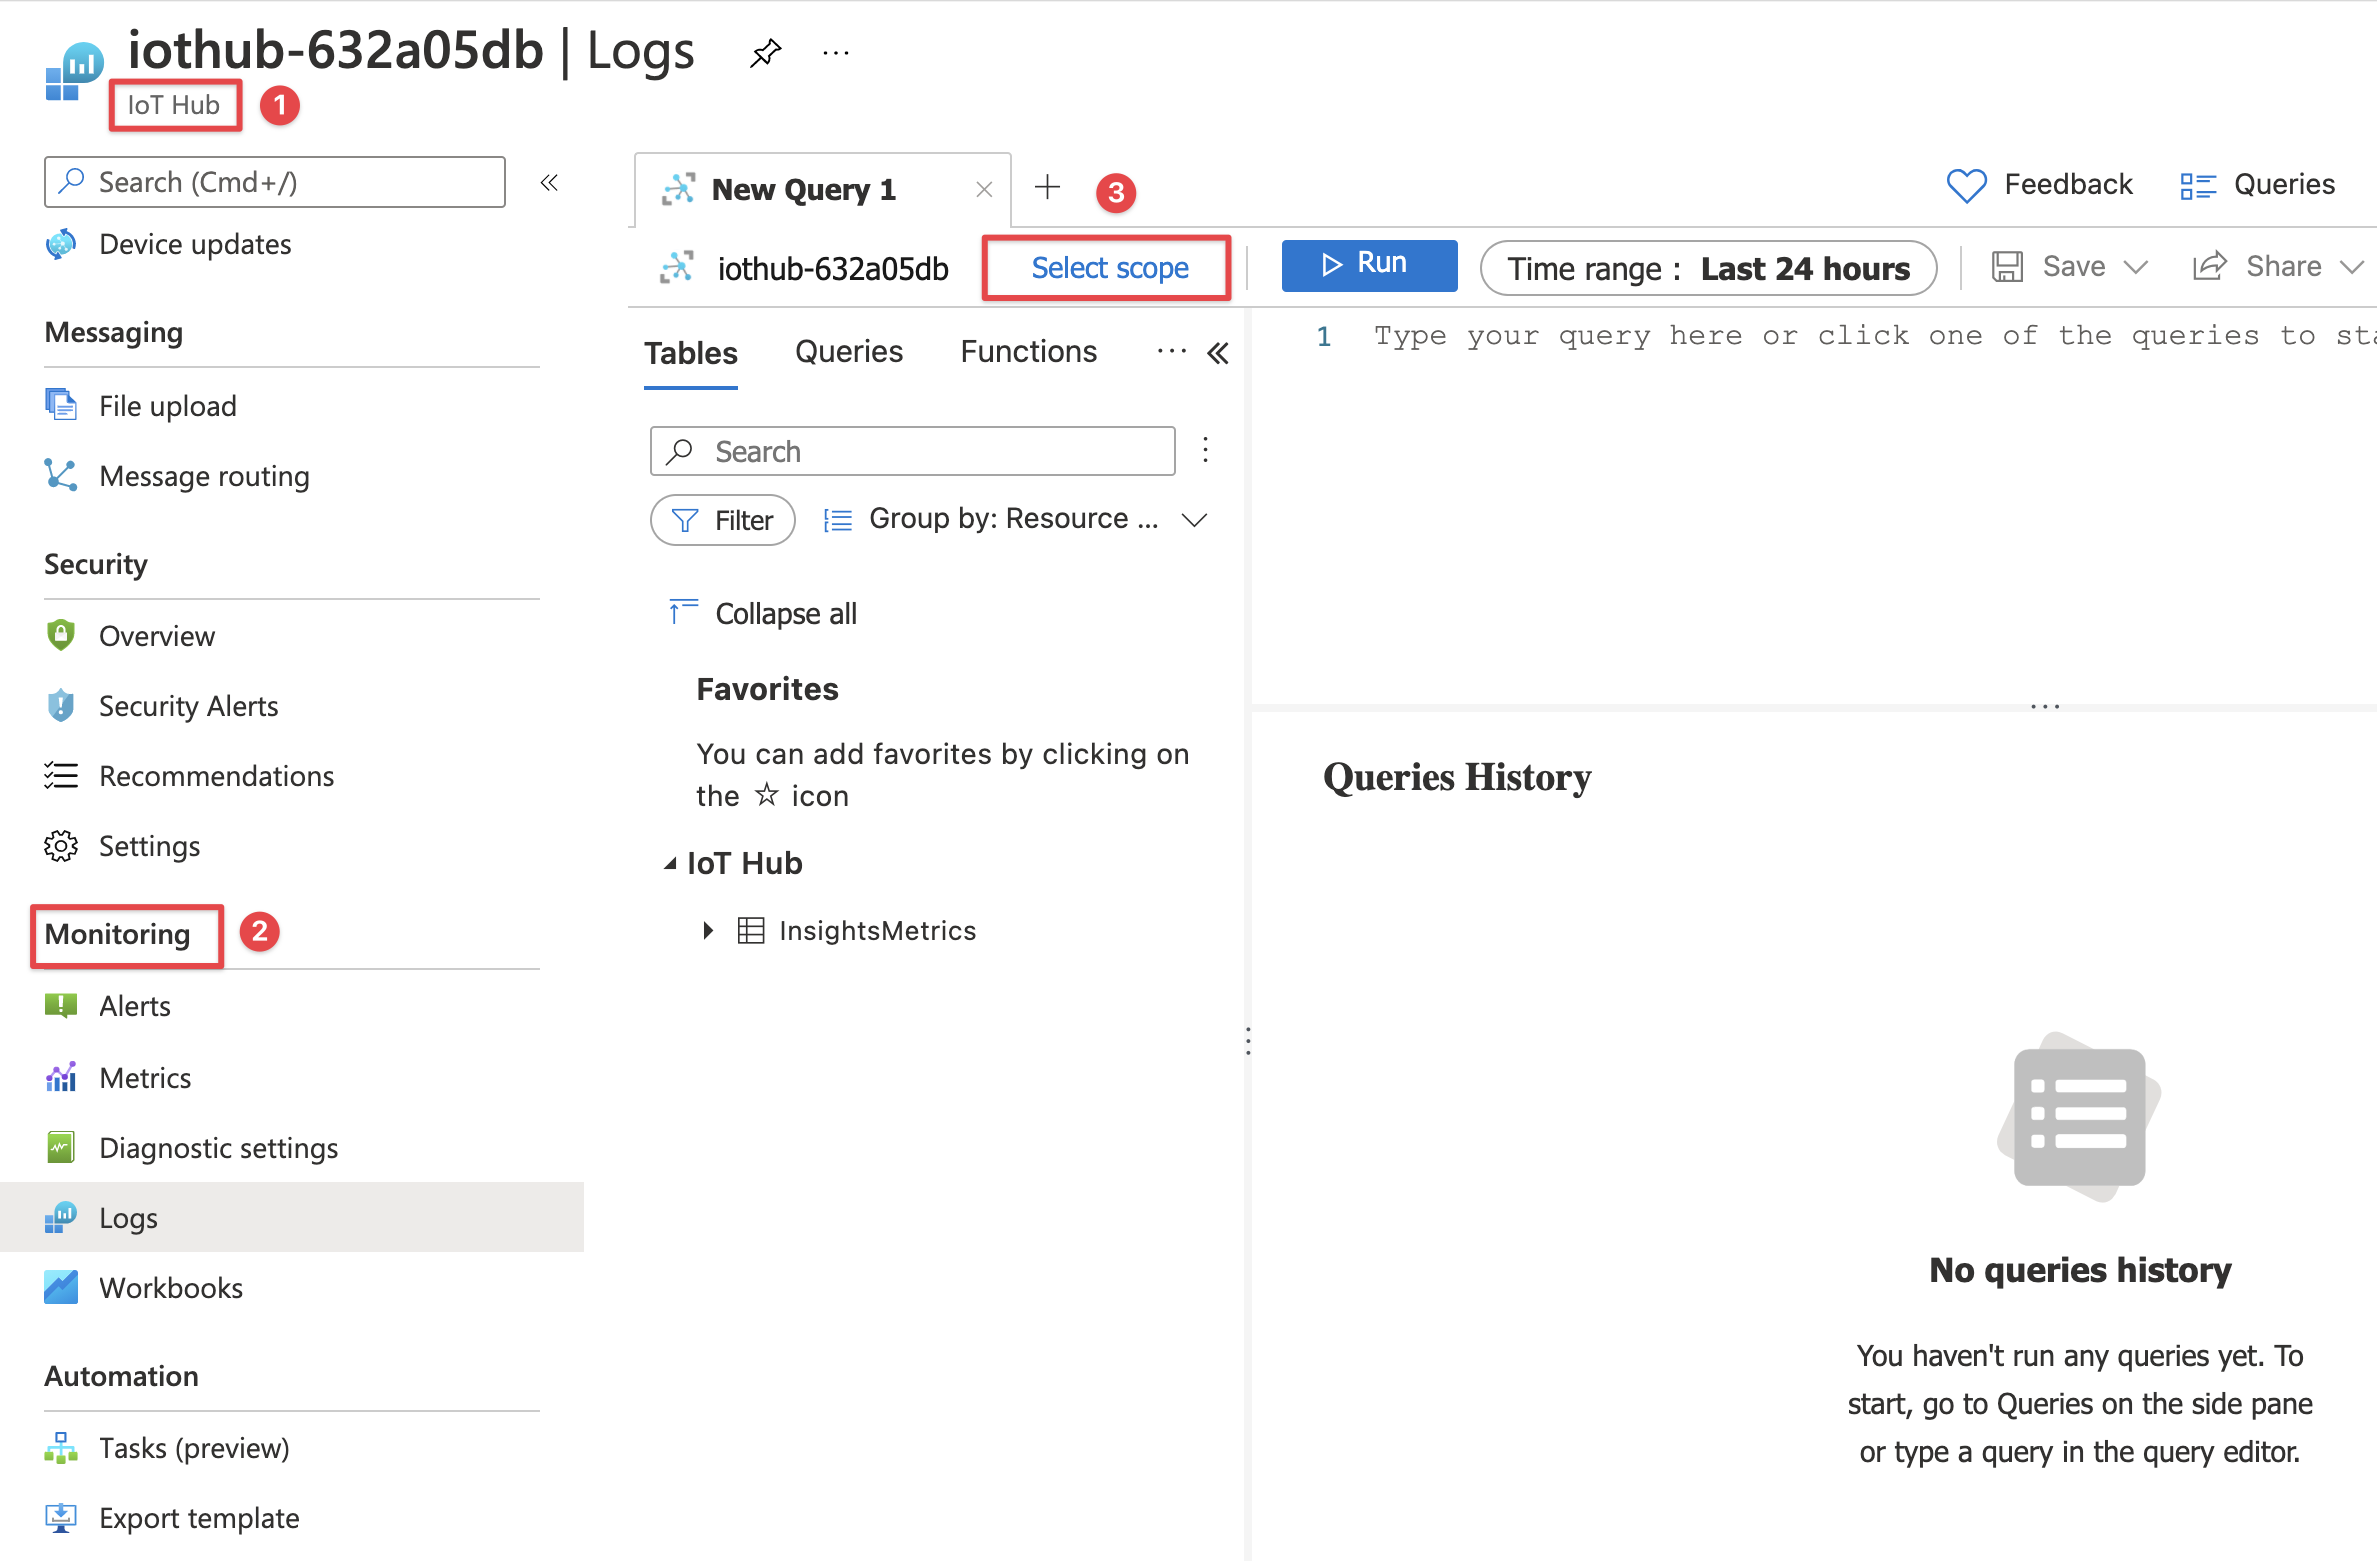
Using the guidance in the previous section creates an alert rule scoped to a single IoT hub. However, you might want to create the same rule for multiple IoT hubs. Change the scope to a resource group or an entire subscription to enable the alert rule on all hubs within that scope.
- Sign in to the Azure portal and navigate to your IoT hub.
- Select Logs from the Monitoring section of the menu.
- Select Select scope to change the scope of an alert rule.
Aggregate values by the _ResourceId field and choose it as the Resource ID column when creating the alert rule. This approach will associate an alert with the correct resource for convenience.
Viewing alerts
See alerts generated for devices across multiple IoT Hubs in Alerts tab of the IoT Edge fleet view workbook.
Click the alert rule name to see more context about the alert. Clicking the device name link will show you the detailed metrics for the device around the time when the alert fired.
Next steps
Enhance your monitoring solution with metrics from custom modules.

