Note
Access to this page requires authorization. You can try signing in or changing directories.
Access to this page requires authorization. You can try changing directories.
Applies to:
![]() IoT Edge 1.5
IoT Edge 1.5
Important
IoT Edge 1.5 LTS is the supported release. IoT Edge 1.4 LTS reached end of life on November 12, 2024. If you're using an earlier release, see Update IoT Edge.
You can visually explore metrics collected from IoT Edge devices by using Azure Monitor workbooks. Curated monitoring workbooks for IoT Edge devices are available as public templates:
- For devices connected to IoT Hub, from the IoT Hub page in the Azure portal, go to the Workbooks page in the Monitoring section.
- For devices connected to IoT Central, from the IoT Central page in the Azure portal, go to the Workbooks page in the Monitoring section.
Curated workbooks use built-in metrics from the IoT Edge runtime. They first need metrics to be ingested into a Log Analytics workspace. These views don't need any metrics instrumentation from the workload modules.
Access curated workbooks
Azure Monitor workbooks for IoT are templates that you use to visualize device metrics. You can customize them to fit your solution.
Follow these steps to access the curated workbooks:
- Sign in to the Azure portal, and go to your IoT Hub or IoT Central application.
- Select Workbooks from the Monitoring section of the menu.
- Choose a workbook to explore from the list of public templates:
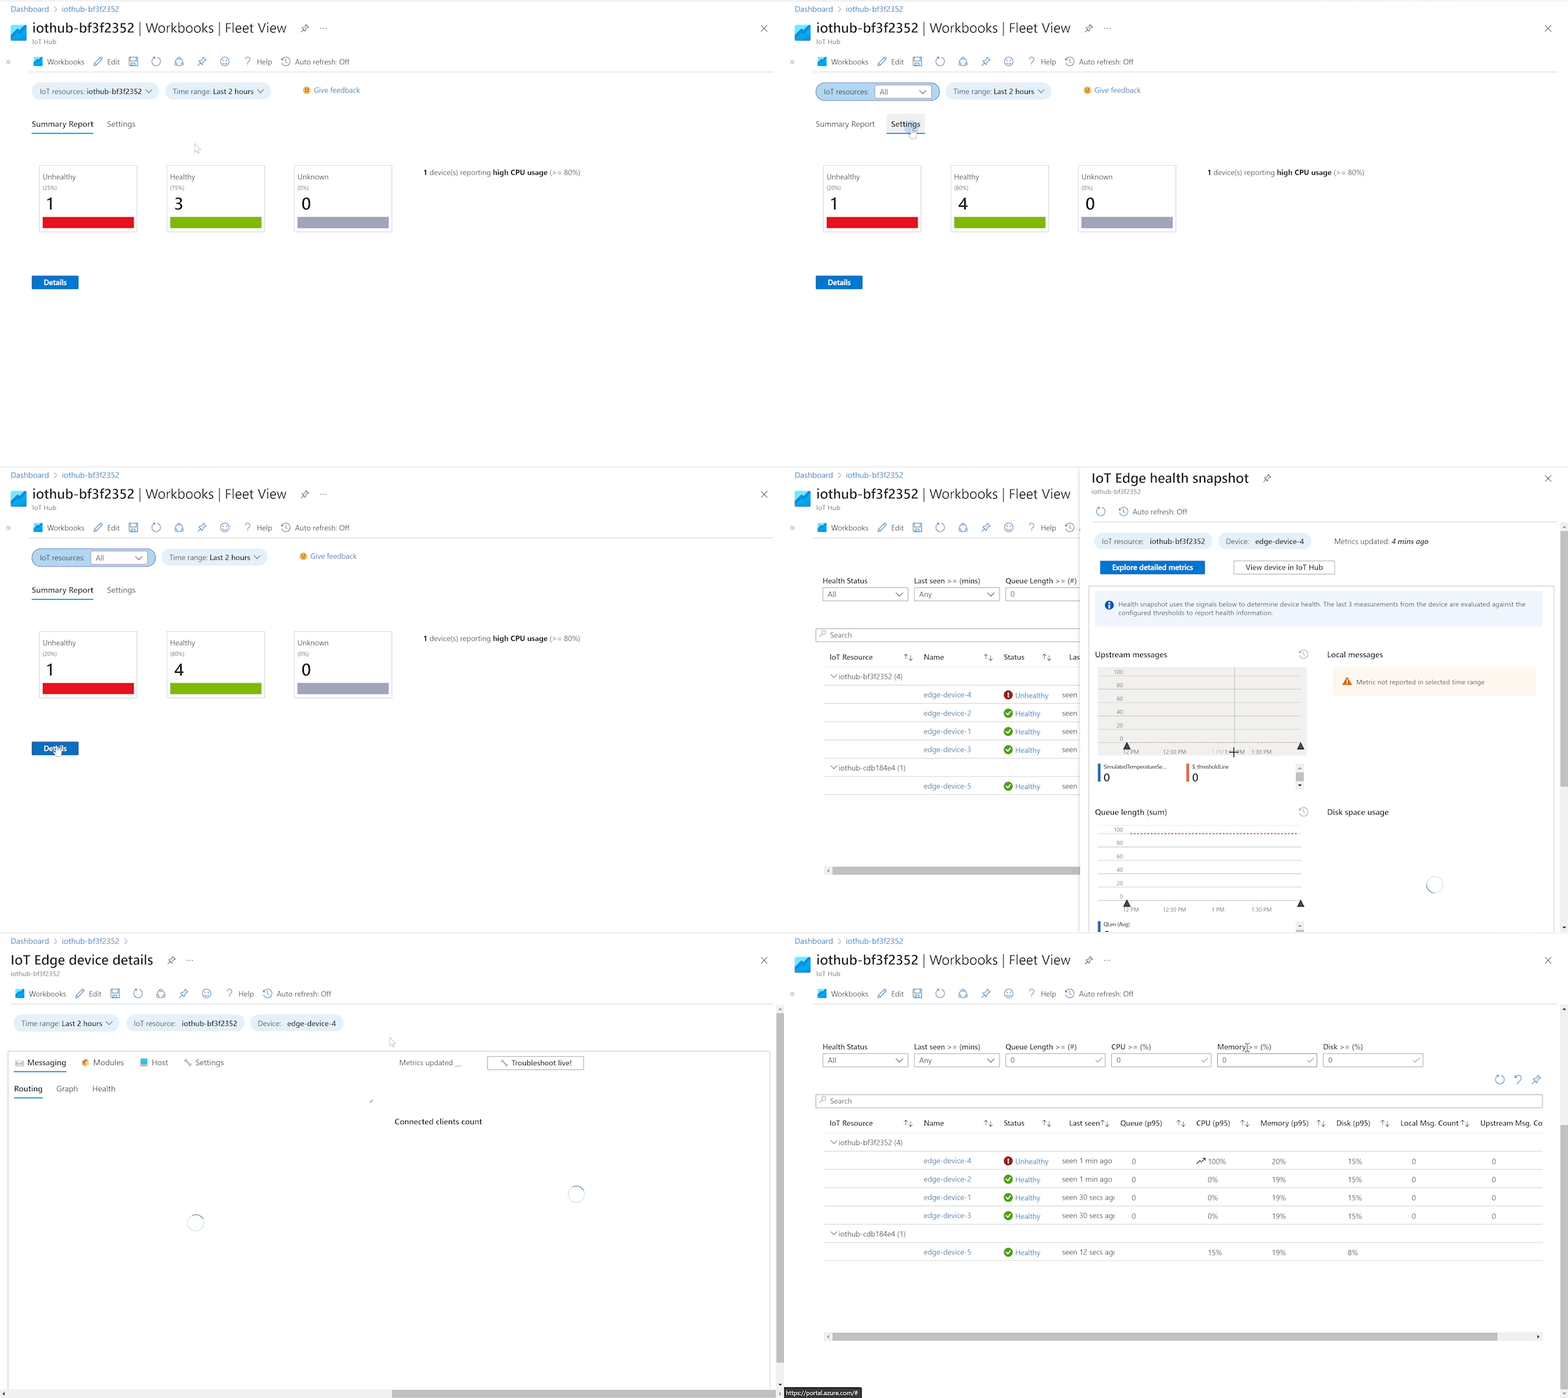
Fleet View: Monitor your fleet of devices across multiple IoT Hubs or Central Apps, and drill into specific devices for a health snapshot.
Device Details: Visualize device details around messaging, modules, and host components on an IoT Edge device.
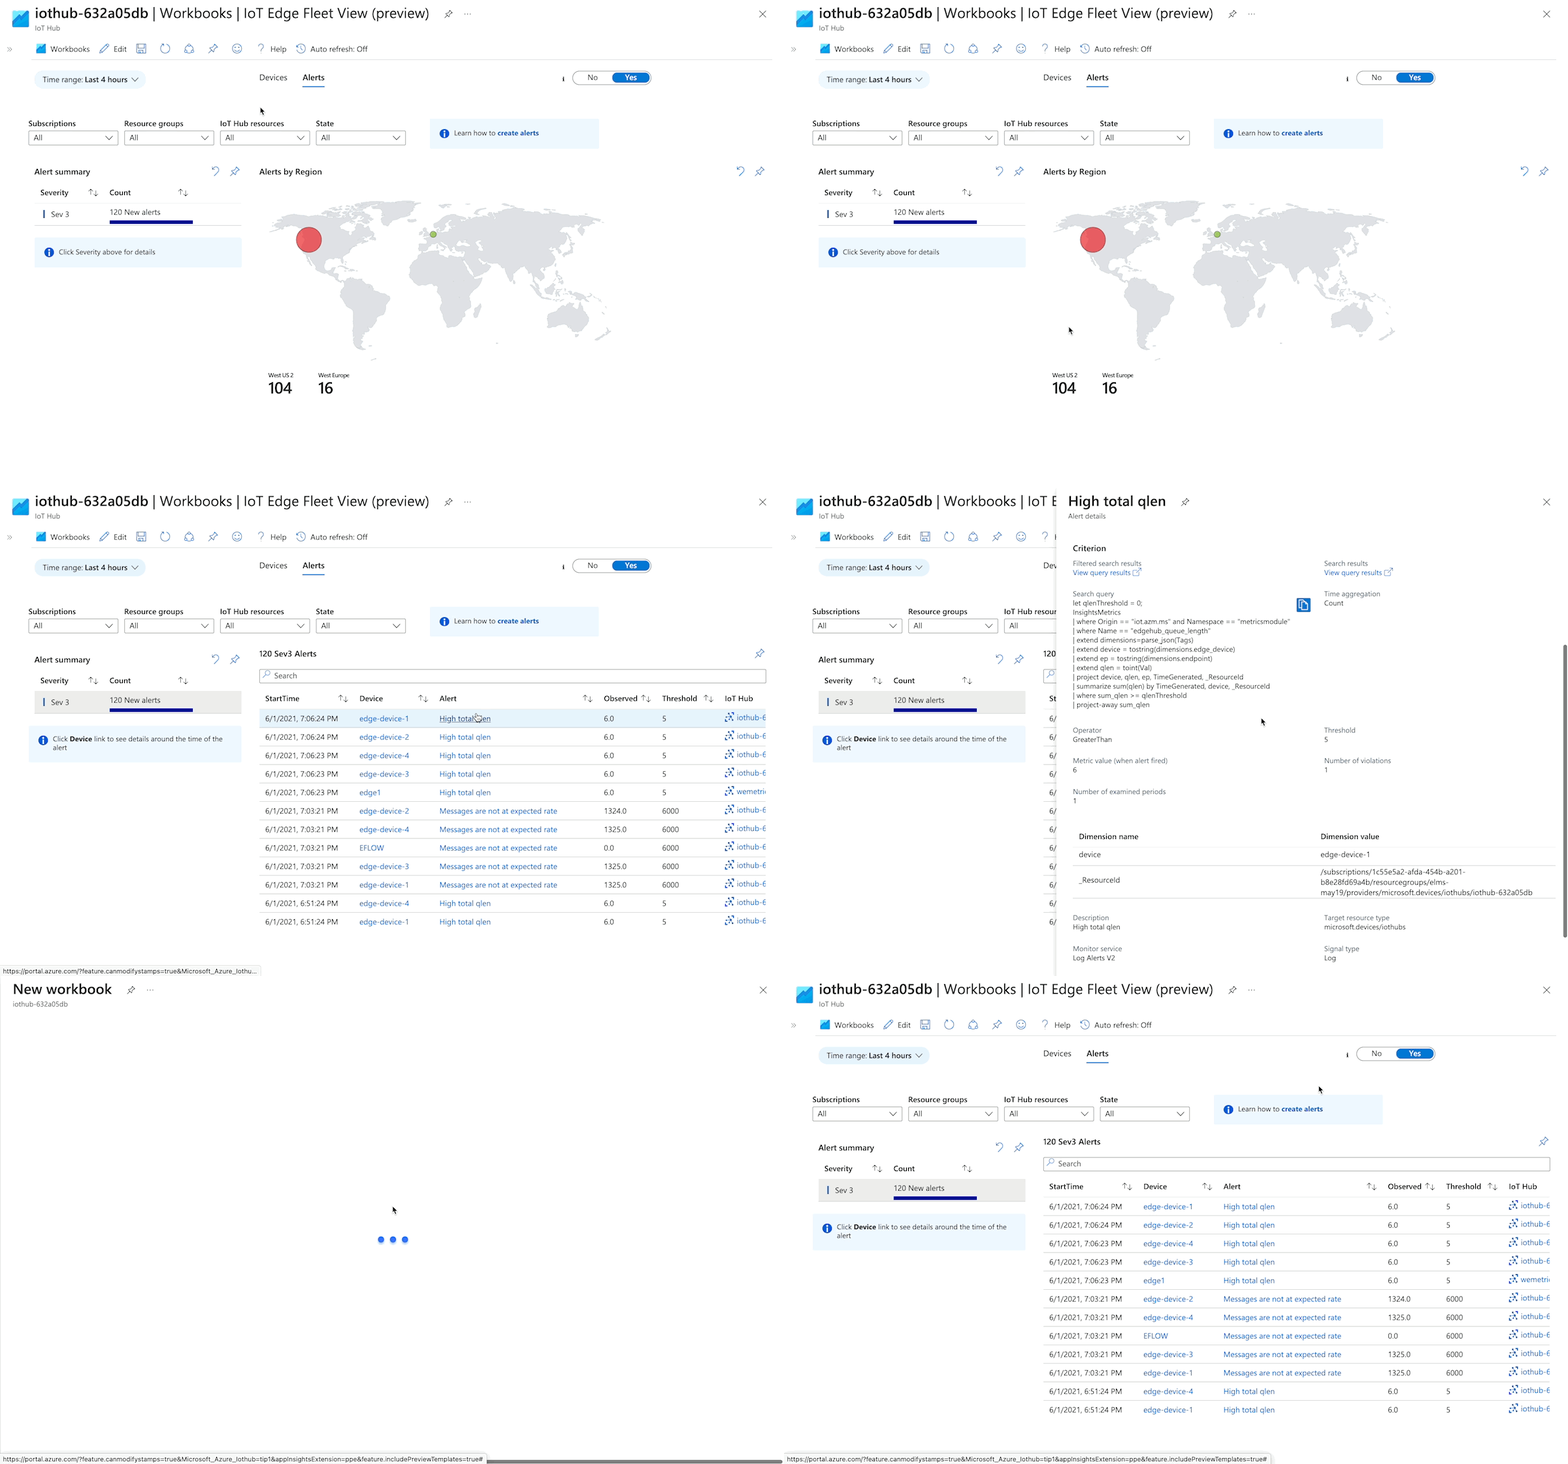
Alerts: View triggered alerts for devices across multiple IoT resources.
For a preview of the data and visualizations each workbook offers, see the following sections.
Note
The screen captures that follow might not reflect the latest workbook design.
Fleet view workbook
By default, this view shows the health of devices associated with the current IoT cloud resource. Select multiple IoT resources using the dropdown control at the top left.
Use the Settings tab to adjust thresholds to categorize devices as healthy or unhealthy.
Select the Details button to view the device list with a snapshot of aggregated primary metrics. Select the link in the Status column to view trends in an individual device's health metrics or select the device name to view its detailed metrics.
Device details workbook
The device details workbook has three views:
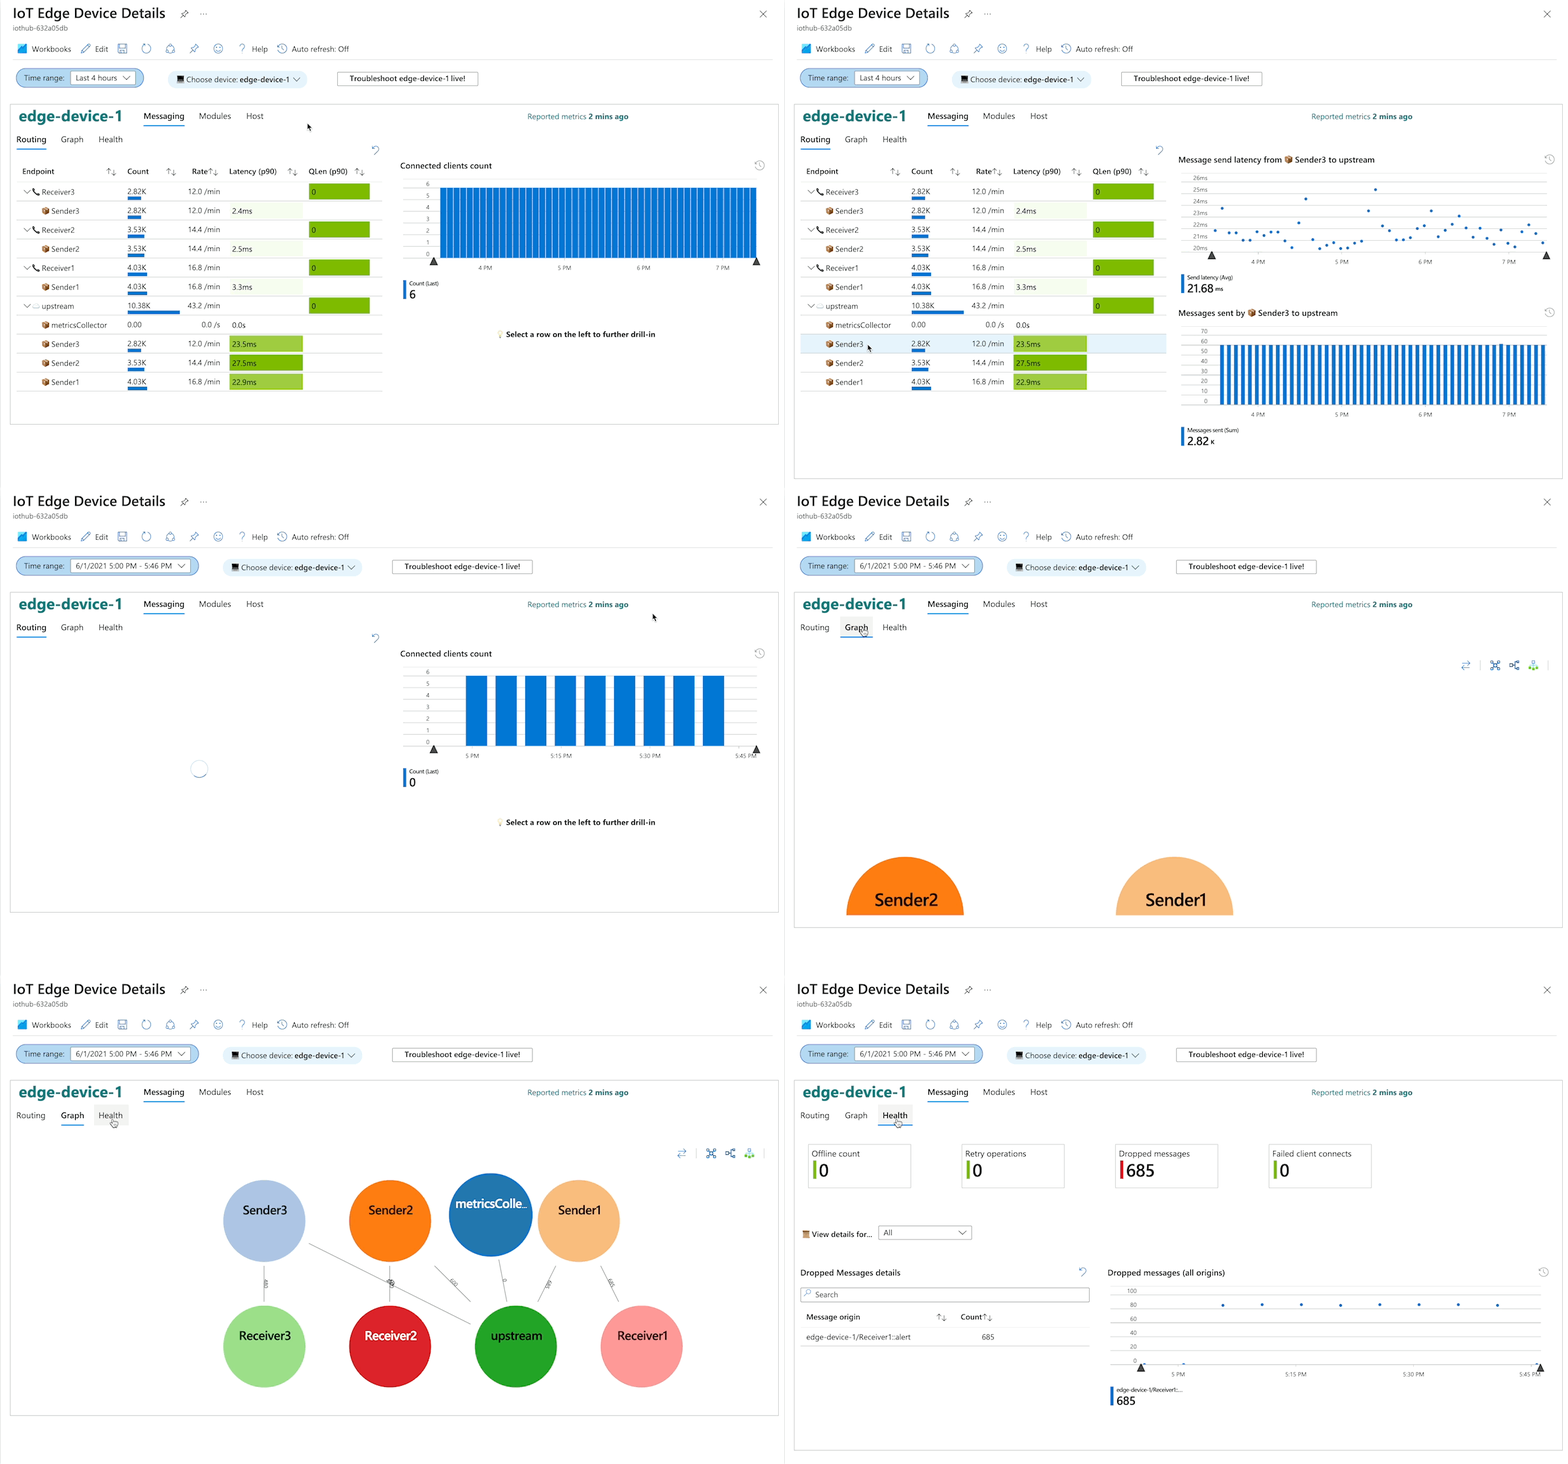
- The Messaging view visualizes the message routes for the device and reports on the overall health of the messaging system.
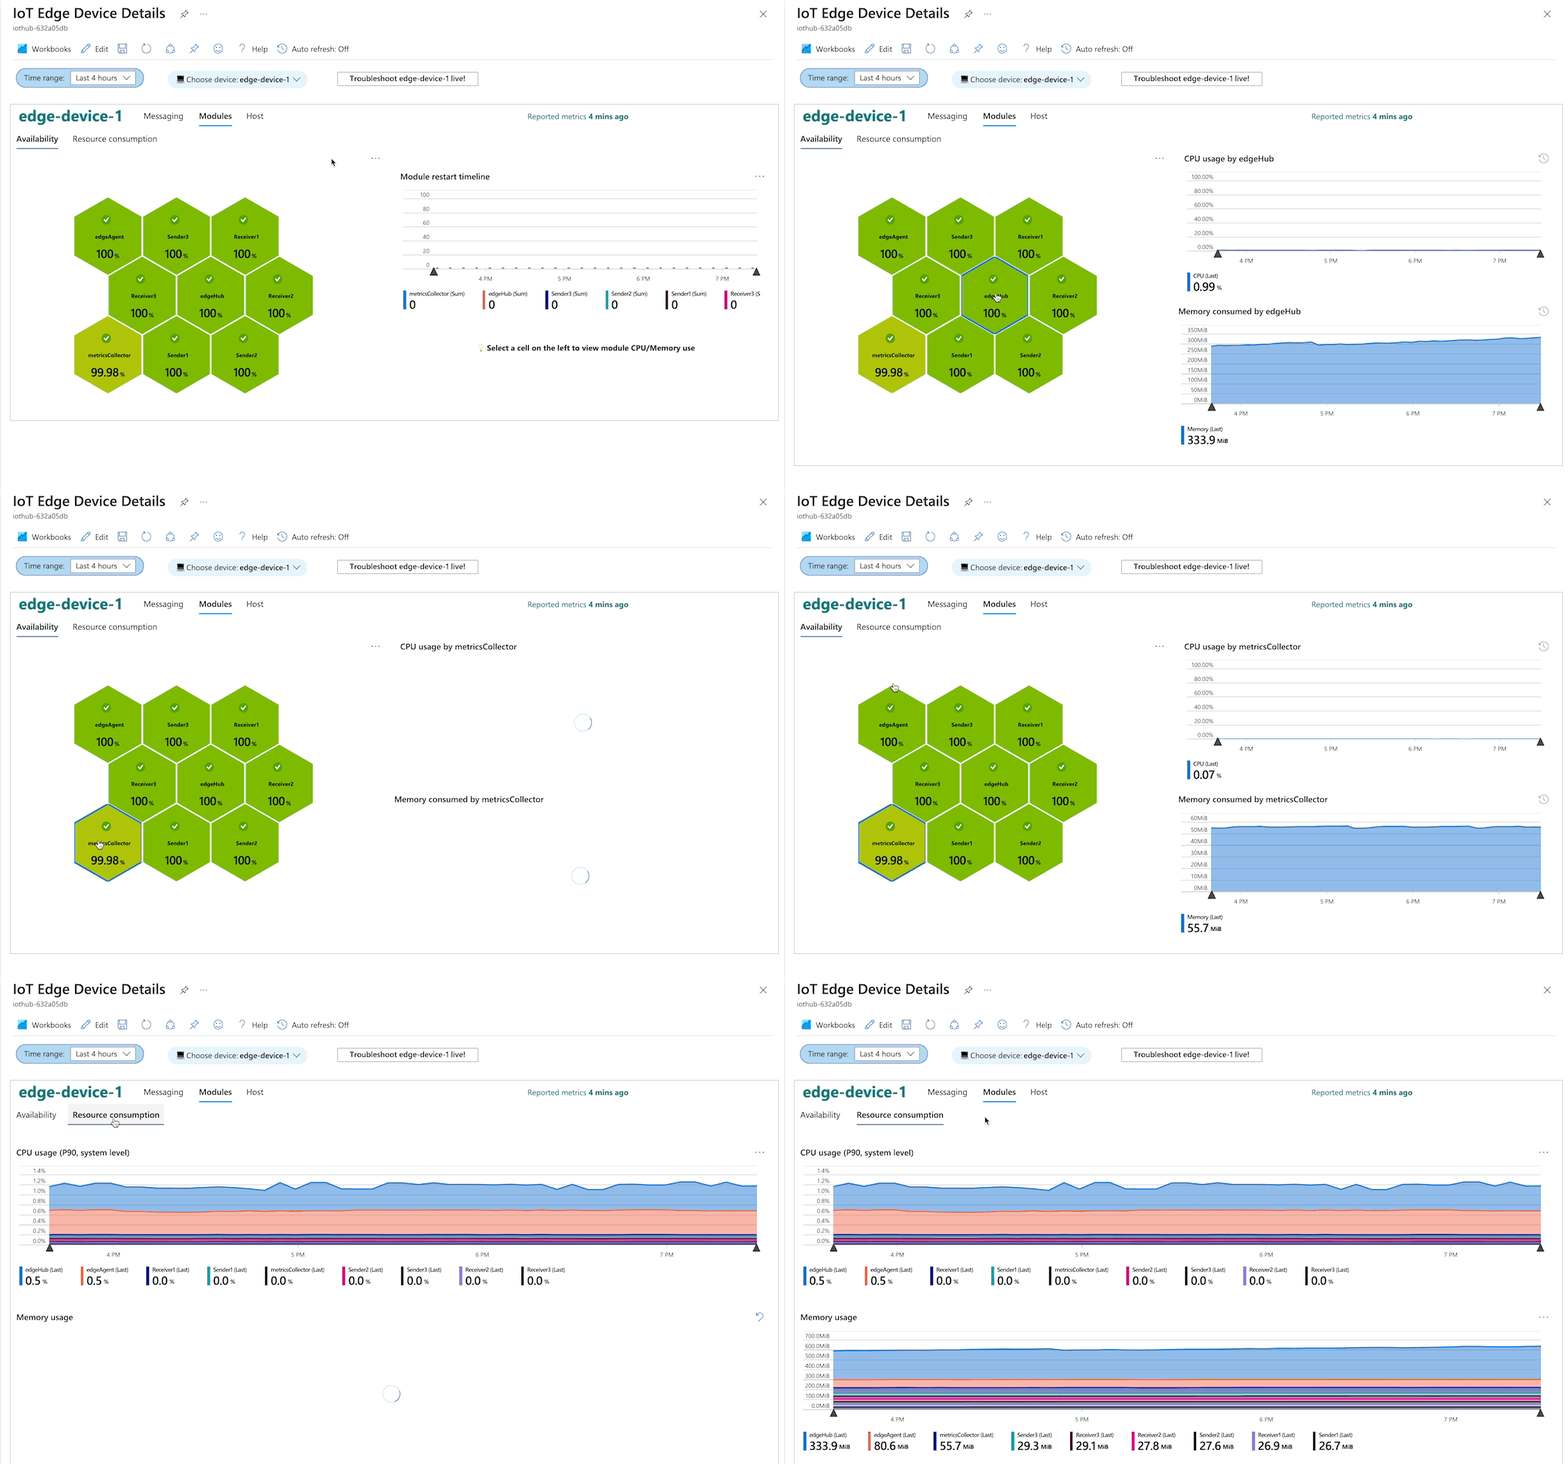
- The Modules view shows how the individual modules on a device are performing.
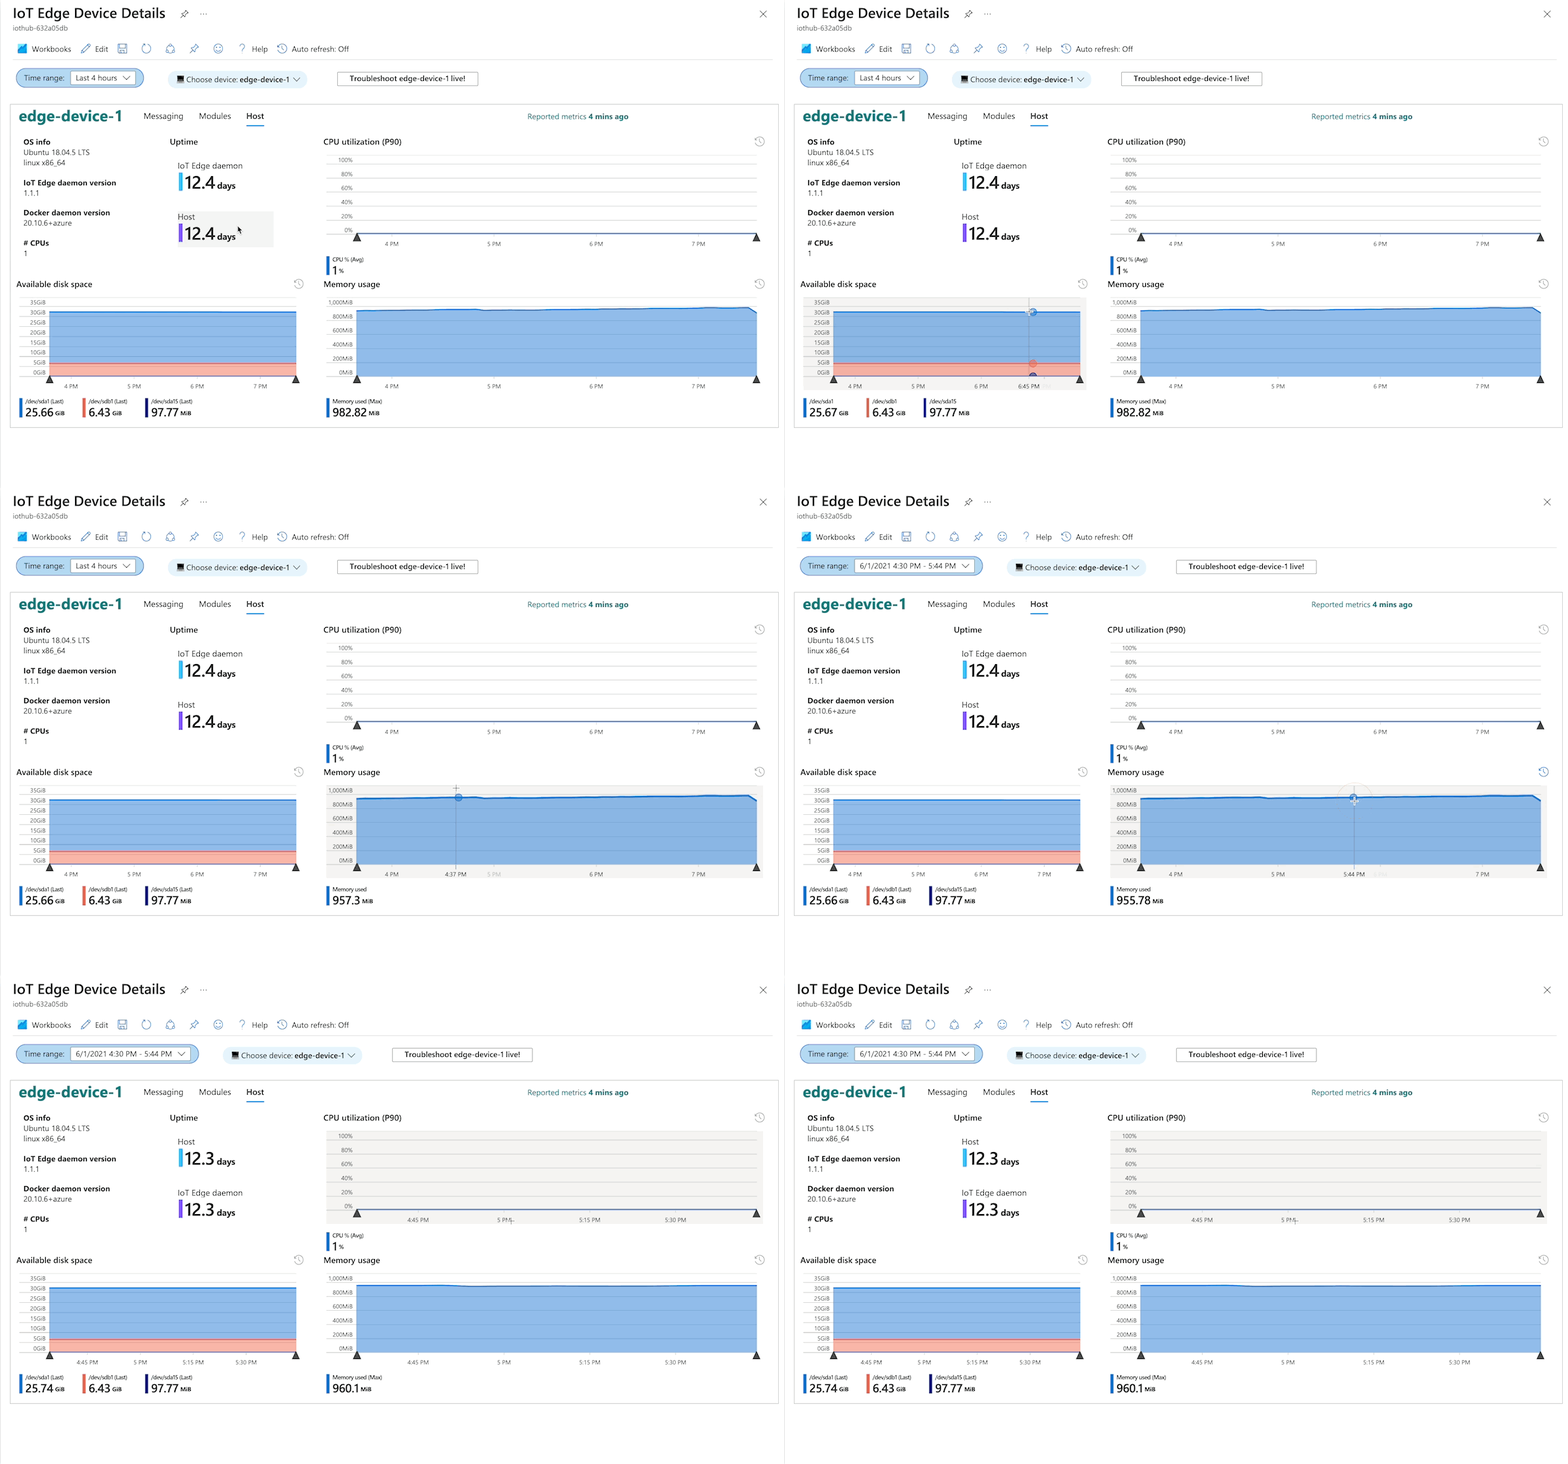
- The Host view shows information about the host device including version information for host components and resource use.
Switch between views by selecting the tabs at the top of the workbook.
The device details workbook also integrates with the IoT Edge portal-based troubleshooting experience. You can pull Live logs from your device by using this feature. Access this experience by selecting the Troubleshoot <device name> live button above the workbook.
The Messaging view includes three subsections: routing details, a routing graph, and messaging health. Drag any time chart and release it to adjust the global time range to the selected range.
The Routing section shows message flow between sending modules and receiving modules. It presents information such as message count, rate, and number of connected clients. Select a sender or receiver to drill in further. Selecting a sender shows the latency trend chart experienced by the sender and the number of messages it sent. Selecting a receiver shows the queue length trend for the receiver and the number of messages it received.
The Graph section shows a visual representation of message flow between modules. Drag and zoom to adjust the graph.
The Health section shows various metrics related to the overall health of the messaging subsystem. Drill into details if any errors are noted.
Alerts workbook
View the generated alerts from pre-created alert rules in the Alerts workbook. This view lets you see alerts from multiple IoT Hubs or IoT Central applications.
Select a severity row to view alert details. The Alert rule link opens the alert context, and the Device link opens the detailed metrics workbook. When opened from this view, the device details workbook automatically adjusts to the time range around the alert firing.
Customize workbooks
To customize a workbook, enter editing mode. Select the Edit button in the workbook's menu bar. Curated workbooks use workbook groups extensively. You might need to select Edit on several nested groups to view a visualization query.
Save your changes as a new workbook. You can share the saved workbook with your team or deploy them programmatically as part of your organization's resource deployments.
Next steps
Customize your monitoring solution with alert rules and metrics from custom modules.
