Note
Access to this page requires authorization. You can try signing in or changing directories.
Access to this page requires authorization. You can try changing directories.
Applies to:  IoT Edge 1.6
Important
IoT Edge 1.6 LTS is the supported release. IoT Edge 1.5 LTS support ends on November 10, 2026; IoT Edge 1.4 LTS reached end of life on November 12, 2024. If you're using an earlier release, see Update IoT Edge.
Use Azure Monitor workbooks to monitor the health and performance of your Azure IoT Edge deployments.
This tutorial uses Metrics Collector 2.0.0, a Log Analytics custom table, a DCR, and Microsoft Entra authentication. For an existing collector 1.x deployment, use Migrate the metrics collector.
In this tutorial, you learn how to:
- Learn what metrics IoT Edge devices share and how the metrics collector module handles them.
- Deploy the metrics collector module to an IoT Edge device.
- View curated visualizations of the metrics collected from the device.
Prerequisites
You need an IoT Edge device with the simulated temperature sensor module deployed. If you don't have a device ready, follow the steps in Deploy your first IoT Edge module to a virtual Linux device to create one using a virtual machine.
You also need:
- Permission to update the device's deployment.
- A Log Analytics workspace, a DCR, and a custom metrics table (default
IoTEdgeMetrics_CL). - Permission to register an application in the Microsoft Entra tenant that contains the DCR.
- Permission to assign an Azure role on the DCR.
- Permission to query the workspace and open workbooks for your IoT Hub.
Use Prepare Azure Monitor resources for the platform setup links and collector-specific schema.
Understand IoT Edge metrics
Every IoT Edge device relies on two modules, called the runtime modules, that manage the lifecycle and communication of all other modules on a device. These modules are the IoT Edge agent and the IoT Edge hub. To learn more about these modules, see Understand the Azure IoT Edge runtime and its architecture.
Both runtime modules create metrics that let you remotely monitor how an IoT Edge device or its individual modules perform. The IoT Edge agent reports on the state of individual modules and the host device, so it creates metrics like how long a module runs correctly, or the amount of RAM and percent of CPU used on the device. The IoT Edge hub reports on communications on the device, so it creates metrics like the total number of messages sent and received, or the time it takes to resolve a direct method. For the full list of available metrics, see Access built-in metrics.
Both modules automatically expose these metrics, so you can create your own solutions to access and report on them. To make this process easier, Microsoft provides the azureiotedge-metrics-collector module, which handles this process if you don't have or want a custom solution. The metrics collector module collects metrics from the two runtime modules and any other modules you want to monitor, and sends them off the device.
This tutorial sends metrics directly to the custom table. The alternative IotMessage path sends metrics through IoT Hub and needs a separate cloud workflow for Log Analytics ingestion.
Record your ingestion configuration
Record the HTTPS logs-ingestion endpoint, DCR immutable ID, and input-stream name from your Azure Monitor configuration. The immutable ID starts with dcr-.
The collector uses Microsoft Entra authentication. It doesn't use the workspace ID or shared key.
Create a tutorial identity
For this tutorial, register a single-tenant Microsoft Entra application and use a short-lived client secret.
Important
Use a client secret only to learn and test this tutorial. Don't use this authentication method for a production deployment. The secret becomes part of the IoT Edge module deployment configuration and is delivered to the device. Anyone or any service that can read that configuration can recover the secret, even if the portal masks it on screen. Secrets also require secure distribution, rotation, revocation, and cleanup on every device where they're deployed.
For production, choose an authentication method that your host and credential-delivery process support. An Azure virtual machine can use its managed identity when the identity endpoint is available to the container. Workload identity federation requires a supported OIDC issuer, a matching federated credential, and a refreshed token file available to the container. Don't treat an untested custom token refresher as a supported configuration. You can also use a securely delivered and rotated certificate. See Configure authentication.
In the Azure portal, go to Microsoft Entra ID > App registrations, and then select New registration.
Enter a name, such as
iot-edge-metrics-tutorial.For Supported account types, select Accounts in this organizational directory only. Leave Redirect URI empty, and then select Register.
On the application's Overview page, copy these values:
- Application (client) ID. You use this value for
AZURE_CLIENT_ID. - Directory (tenant) ID. You use this value for
AZURE_TENANT_ID.
- Application (client) ID. You use this value for
Select Certificates & secrets > Client secrets > New client secret.
Enter a description, select the shortest expiration that gives you enough time to complete the tutorial, and then select Add.
Copy the new secret's Value immediately and store it securely until you configure the module. The value is shown only once. Don't copy the Secret ID.
In the Azure portal, open the DCR that sends data to your custom metrics table.
Select Access control (IAM) > Add > Add role assignment.
On the Role tab, select Monitoring Metrics Publisher, and then select Next.
On the Members tab, select User, group, or service principal > Select members. Find the application that you registered, select it, and then select Select.
Select Review + assign, review the DCR-scoped assignment, and then select Review + assign again.
No Microsoft Graph API permission is required. The DCR-scoped Azure role assignment authorizes ingestion. Allow up to 30 minutes for the assignment to take effect. An upload attempted before propagation can return HTTP 403.
Retrieve your IoT hub resource ID
When you configure the metrics collector module, you enter the Azure Resource Manager resource ID for your IoT hub. Get that ID now.
In the Azure portal, go to your IoT hub.
Under Settings, select Properties.
Copy the value of Resource ID. The format is
/subscriptions/<subscription_id>/resourceGroups/<resource_group_name>/providers/Microsoft.Devices/IoTHubs/<iot_hub_name>.
Deploy the metrics collector module
Deploy the metrics collector module to each device you want to monitor. It runs on the device like any other module and watches its assigned endpoints for metrics to collect and send to the cloud.
Follow these steps to deploy and configure the collector module:
Sign in to the Azure portal, then go to your IoT hub.
Under Device management, select Devices.
Select the device ID of the target device in the list of IoT Edge devices to open the device details page.
In the menu bar, select Set Modules.
The first step of deploying modules from the portal is to declare which Modules are on a device. If you're using the same device you created in the quickstart, you already see SimulatedTemperatureSensor listed. If not, add it now:
In the IoT Edge modules section, select Add, then choose IoT Edge Module.
Update the following module settings:
Setting Value IoT Module name SimulatedTemperatureSensorImage URI mcr.microsoft.com/azureiotedge-simulated-temperature-sensor:latestRestart policy always Desired status running Select Next: Routes to continue to configure routes.
Add a route that sends all messages from the simulated temperature module to IoT Hub.
Setting Value Name SimulatedTemperatureSensorToIoTHubValue FROM /messages/modules/SimulatedTemperatureSensor/* INTO $upstream
Add and configure the metrics collector module:
Select Add, then choose IoT Edge Module.
Update the following module settings:
Setting Value IoT Module name IoTEdgeMetricsCollectorImage URI mcr.microsoft.com/azureiotedge-metrics-collector:2.0.0Restart policy always Desired status running
To use a different version or architecture of the metrics collector module, find available images in the Microsoft Artifact Registry.
Go to the Environment Variables tab.
Add the following text-type environment variables:
Name Value ResourceId Your IoT hub resource ID that you retrieved in a previous section. UploadTarget AzureMonitorDataCollectionEndpoint Your HTTPS logs-ingestion base endpoint. DataCollectionRuleId Your DCR immutable ID. DataCollectionStreamName Your DCR input-stream name, such as Custom-IoTEdgeMetrics.AZURE_TENANT_ID The Directory (tenant) ID that you copied from the app registration. AZURE_CLIENT_ID The Application (client) ID that you copied from the app registration. AZURE_CLIENT_SECRET The client secret Value that you copied. Don't use the Secret ID. Treat any masked display of
AZURE_CLIENT_SECRETin the portal as visual masking only. The value is still stored in the deployment configuration. Don't put it in source control, screenshots, support bundles, or logs.The default endpoints are
http://edgeHub:9600/metrics,http://edgeAgent:9600/metrics. The default collection interval is 300 seconds.For all environment variables and production authentication options, see Metrics collector configuration and Configure authentication.
Select Apply to save your changes.
Note
To send metrics through IoT Hub, add a route to upstream similar to
FROM /messages/modules/< FROM_MODULE_NAME >/* INTO $upstream. In this tutorial, metrics are sent directly to Log Analytics, so this route isn't needed.Select Review + create to continue to the final step of deploying modules.
Select Create to finish the deployment.
After you finish deploying the modules, return to the device details page, where you see four modules listed as Specified in Deployment. It can take a few moments for all four modules to be listed as Reported by Device, which means they've started and reported their status to IoT Hub. Refresh the page to see the latest status.
Monitor device health
Allow time for a collection cycle and ingestion. In the destination workspace, use Check new ingestion to check for recent rows.
Metrics are in your custom table (default IoTEdgeMetrics_CL), using the pass-through schema. These workbooks query the workspace and filter for your IoT Hub.
Azure Monitor provides three default workbook templates for IoT:
- The Fleet View workbook shows the health of devices across multiple IoT resources. The view lets you set thresholds for device health and shows aggregations of primary metrics per device.
- The Device Details workbook shows visualizations for messaging, modules, and host. The messaging view visualizes the message routes for a device and reports on the overall health of the messaging system. The modules view shows how the individual modules on a device perform. The host view shows information about the host device, including version information for host components and resource use.
- The Alerts workbook view shows alerts for devices across multiple IoT resources.
Explore the fleet view and health snapshot workbooks
The fleet view workbook shows all your devices and lets you select specific devices to view their health snapshots. Follow these steps to explore the workbook visualizations:
Go to your IoT hub page in the Azure portal.
In the main menu, scroll down to the Monitoring section, and select Workbooks.
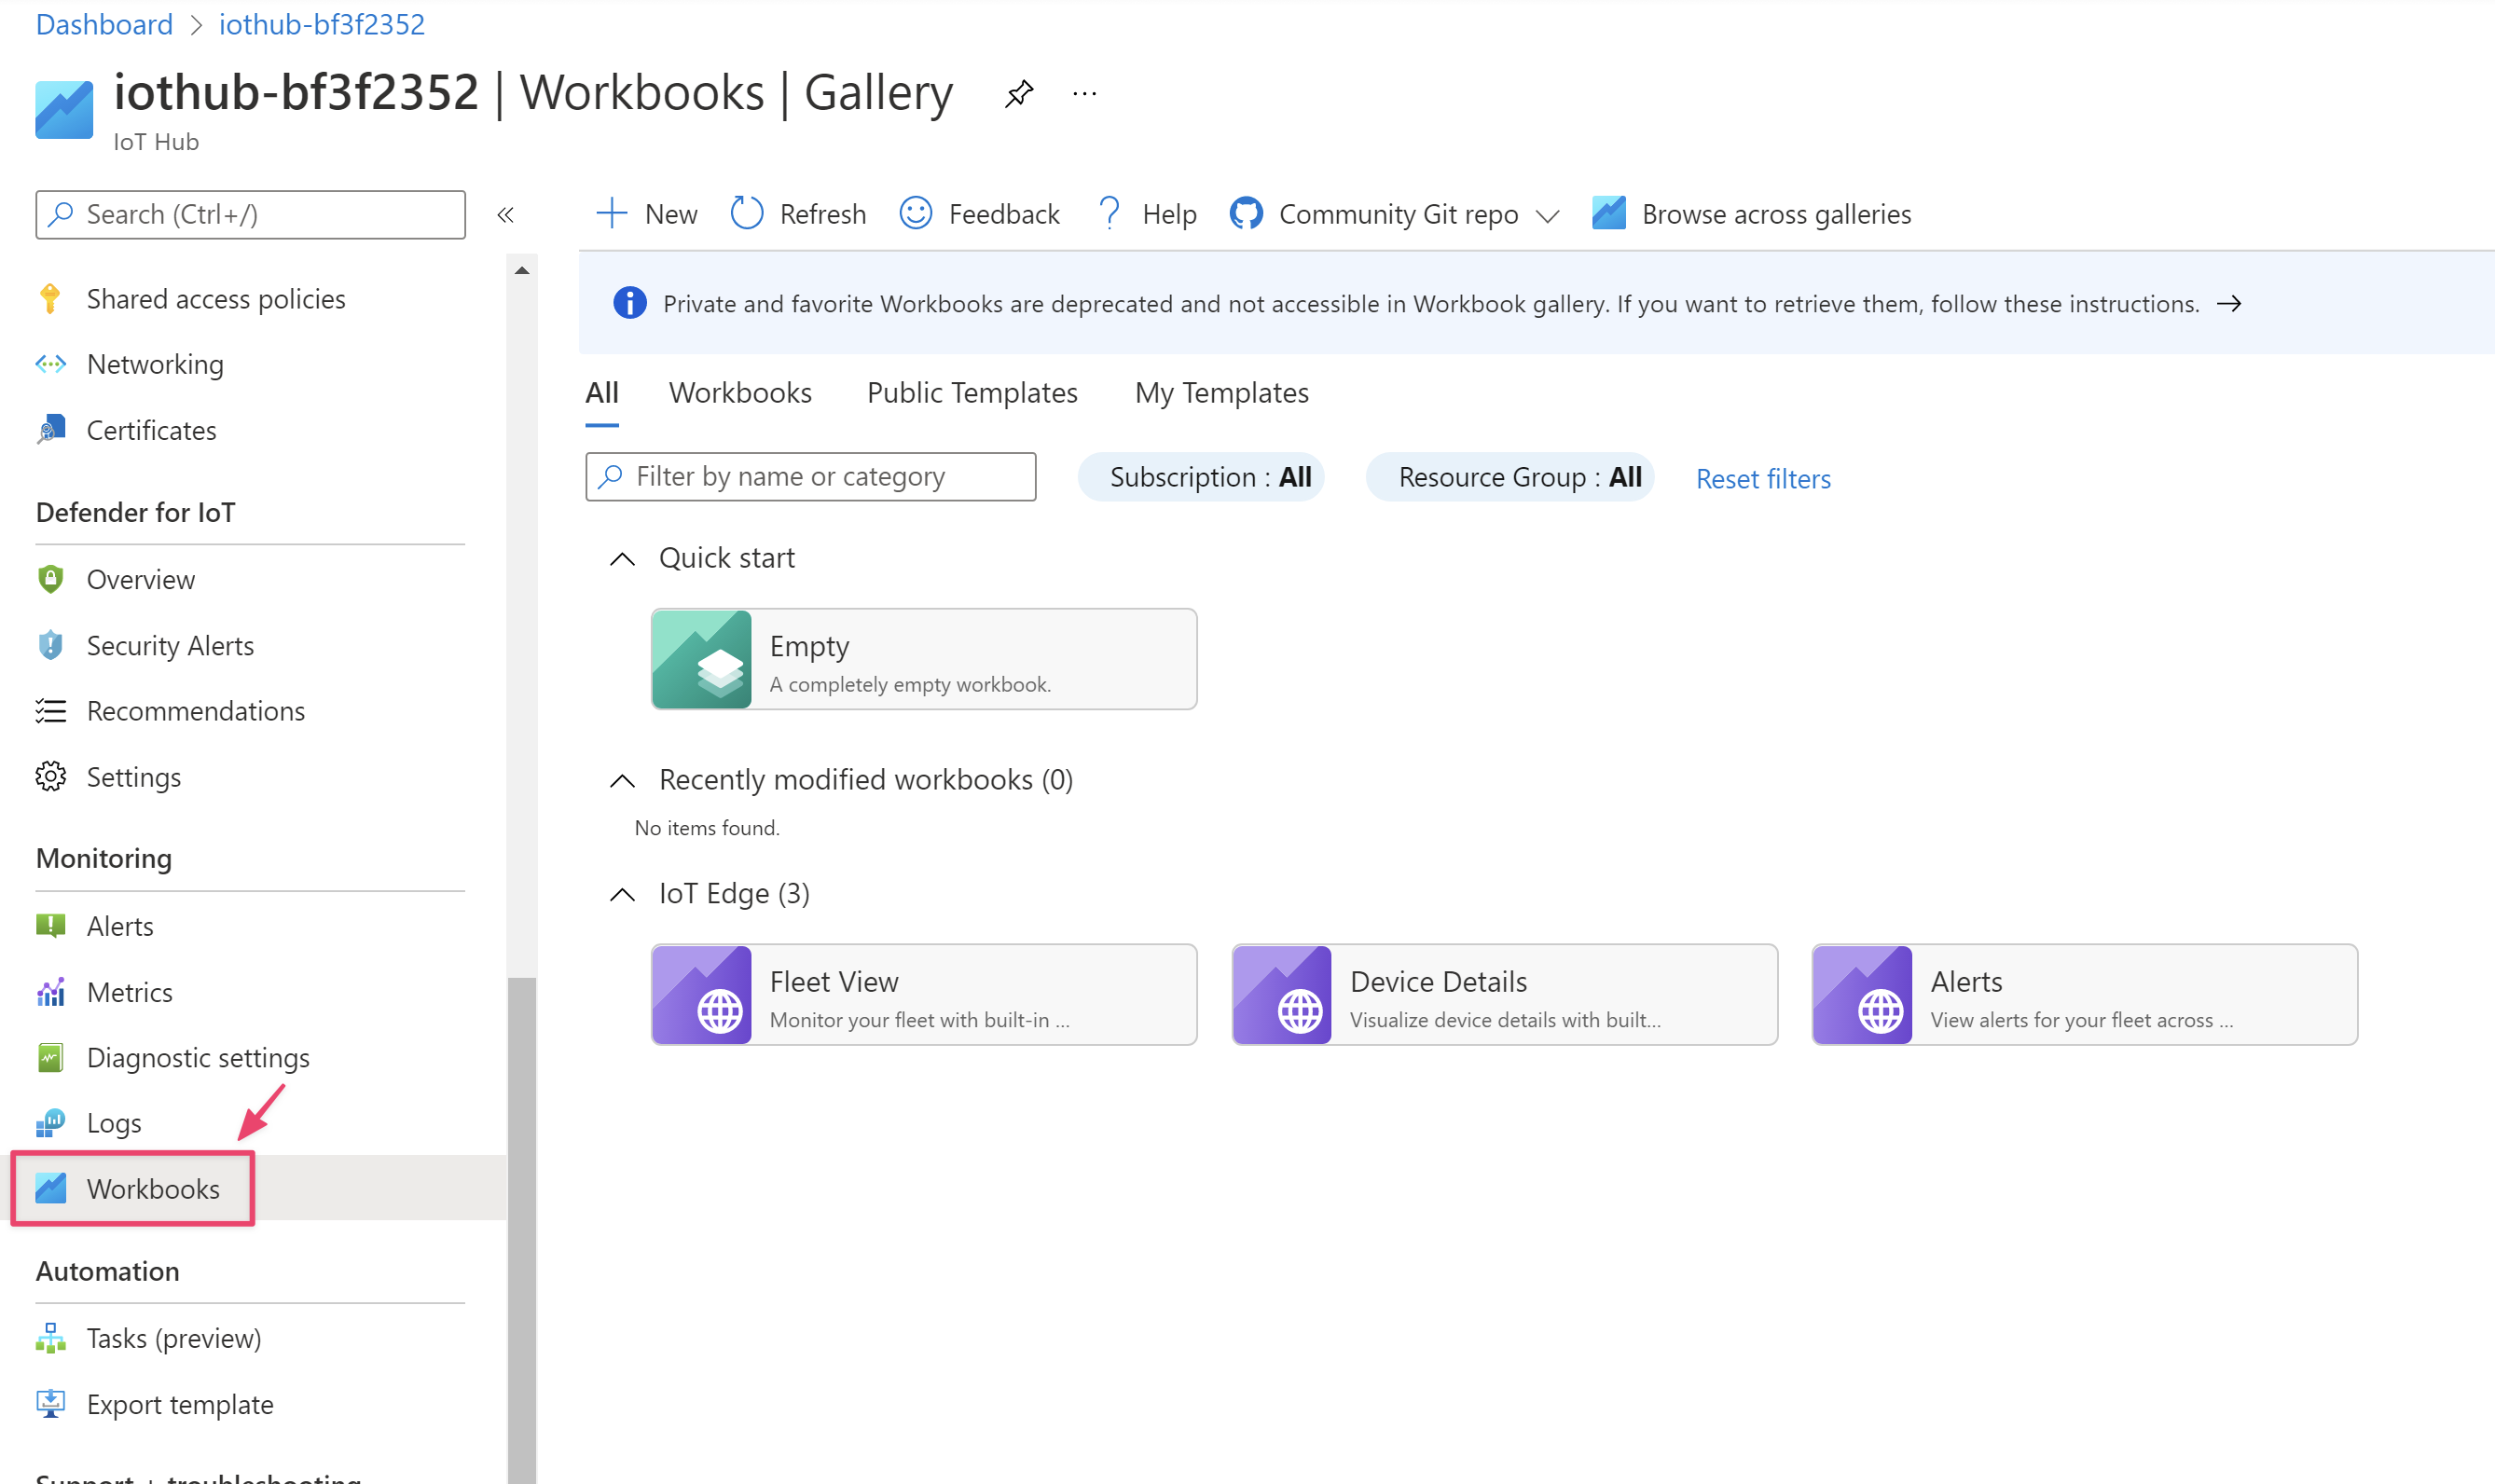
Select the Fleet View workbook.
Select your Metrics Log Analytics workspace.
Select your IoT Hub and a time range that contains recent uploads.
Confirm that Metrics source is New only.
The updated gallery template defaults to New only, which reads the selected custom table and doesn't require a cutover time. An existing saved copy keeps its saved setting and might still open in Legacy only.
Set
MetricsTableNameto your custom table name, or keep the defaultIoTEdgeMetrics_CL.Select Details to open the device list.
Find your device in the list.
Health depends on the configured thresholds and metric freshness. Older samples can produce an Unknown status.
Select the status icon to open Health Snapshot.
The device-name link opens Device Details instead.
On any time chart, use the arrow icons under the X-axis or select the chart and drag your cursor to change the time range.
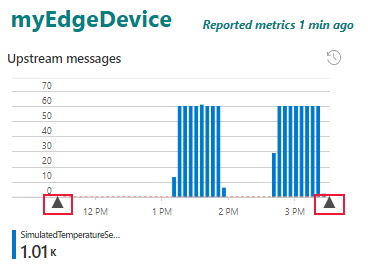
Close the health snapshot workbook. In the fleet view workbook, select Workbooks to return to the workbooks gallery.
Explore the device details workbook
The device details workbook shows performance details for an individual device. Follow these steps to explore the workbook visualizations:
In the workbooks gallery, select the IoT Edge device details workbook.
Select the workspace, IoT Hub, New only, and your device.
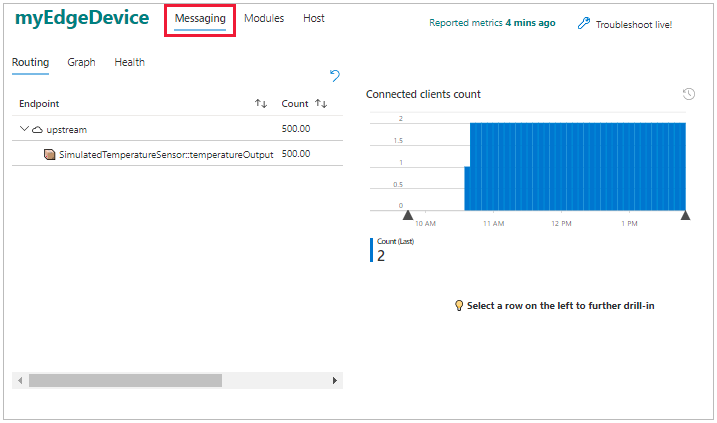
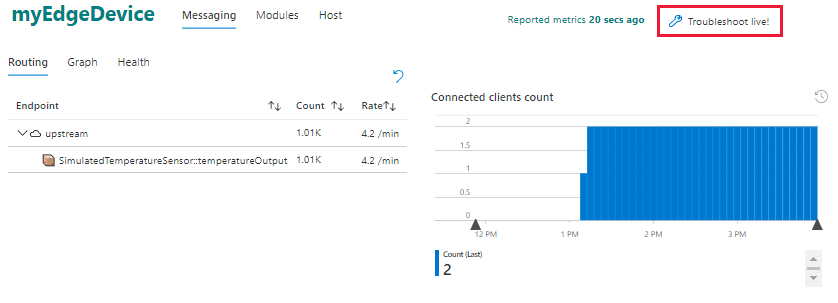
The first page in the device details workbook is the messaging view with the routing tab selected.
On the left, a table shows the routes on the device, organized by endpoint. For this device, the upstream endpoint, which is the term for routing to IoT Hub, receives messages from the temperatureOutput output of the simulated temperature sensor module.
On the right, a graph shows the number of connected clients over time. Select and drag the graph to change the time range.
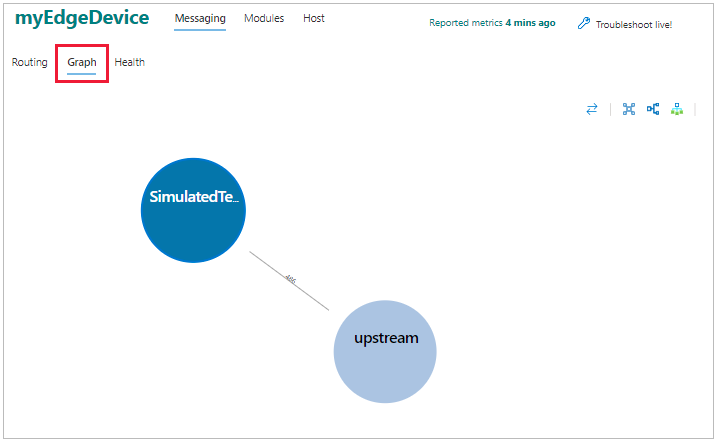
Select the graph tab to see a different visualization of the routes. On the graph page, drag and drop the endpoints to rearrange the graph. This feature helps when you have many routes to visualize.
The health tab shows any issues with messaging, like dropped messages or disconnected clients.
Select the modules view to see the status of all modules deployed on the device. Select a module to see details about its CPU and memory use.
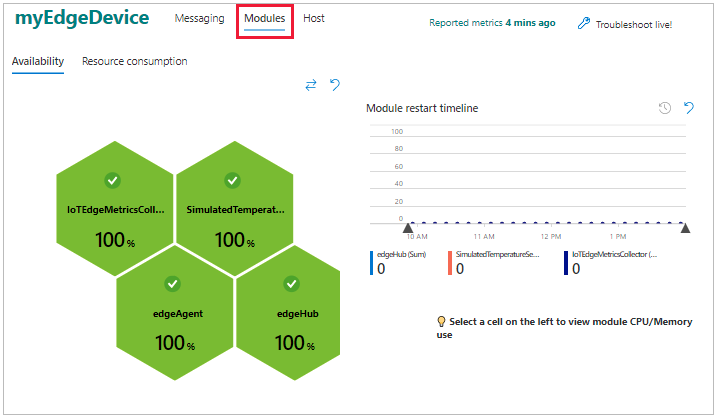
Select the host view to see information about the host device, including its operating system, IoT Edge daemon version, and resource use.
View module logs
After you view the metrics for a device, you might want to dive in further and inspect the individual modules. IoT Edge provides troubleshooting support in the Azure portal with a live module log feature.
In the device details workbook, select Troubleshoot live.
The troubleshooting page opens to the edgeAgent logs from your IoT Edge device. If you select a specific time range in the device details workbook, that setting passes through to the troubleshooting page.
Use the dropdown menu to switch to the logs of other modules running on the device, and use the Restart button to restart a module.
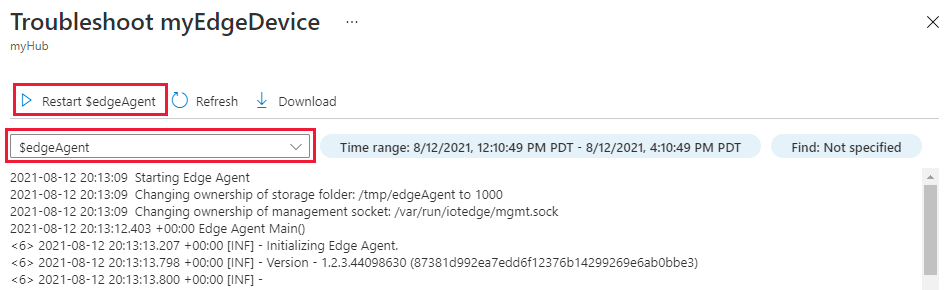
You can also access the troubleshoot page from an IoT Edge device's details page. For more information, see Troubleshoot IoT Edge devices from the Azure portal.
Next steps
As you go through the rest of the tutorials, keep the metrics collector module on your test devices, and return to these workbooks to see how the information changes when you add more complex modules and routing.
Before you use the collector in production, replace the tutorial client secret with a production authentication method. Then delete the client secret. If you no longer need the tutorial application, also remove its DCR role assignment and delete the application registration.
To compare old and new history, use Migrate the metrics collector.
To retain custom views, save a workbook copy. Configure alert rules separately.
Go to the next tutorial to set up your developer environment and start deploying custom modules to your devices.