Note
Access to this page requires authorization. You can try signing in or changing directories.
Access to this page requires authorization. You can try changing directories.
Customers using operations monitoring to track the status of operations in IoT Hub can migrate that workflow to Azure Monitor resource logs, a feature of Azure Monitor. Resource logs supply resource-level diagnostic information for many Azure services.
The operations monitoring functionality of IoT Hub is deprecated, and has been removed from the portal. This article provides steps to move your workloads from operations monitoring to Azure Monitor resource logs. For more information about the deprecation timeline, see Monitor your Azure IoT solutions with Azure Monitor and Azure Resource Health.
Update IoT Hub
To update your IoT Hub in the Azure portal, first create a diagnostic setting, then turn off operations monitoring.
Create a diagnostic setting
Sign in to the Azure portal and navigate to your IoT hub.
On the left pane, under Monitoring, select Diagnostics settings. Then select Add diagnostic setting.

On the Diagnostic setting pane, give the diagnostic setting a name.
Under Category details, select the categories for the operations you want to monitor. For more information about the categories of operations available with IoT Hub, see Resource logs.
Under Destination details, choose where you want to send the logs. You can select any combination of these destinations:
- Archive to a storage account
- Stream to an event hub
- Send to Azure Monitor Logs via a Log Analytics workspace
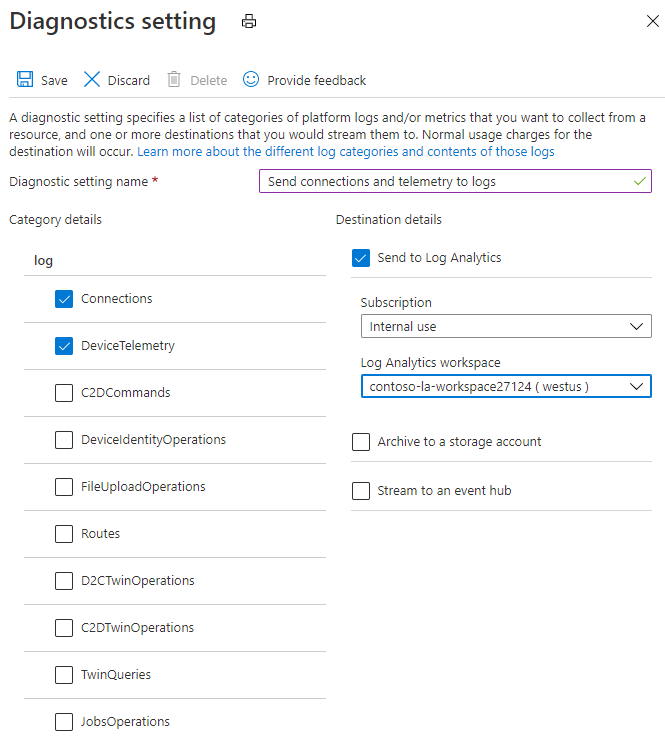
The following screenshot shows a diagnostic setting that routes operations in the Connections and Device telemetry categories to a Log Analytics workspace:
Select Save to save the settings.
New settings take effect in about 10 minutes. After that, logs appear in the configured destination. For more information about configuring diagnostics, see Collect and consume log data from your Azure resources.
For more detailed information about how to create diagnostic settings, including with PowerShell and the Azure CLI, see Diagnostic settings in the Azure Monitor documentation.
Turn off operations monitoring
Note
As of March 11, 2019, the operations monitoring feature is removed from IoT Hub's Azure portal interface. The steps below no longer apply. To migrate, make sure that the correct categories are routed to a destination with an Azure Monitor diagnostic setting above.
Once you test the new diagnostics settings in your workflow, you can turn off the operations monitoring feature.
In your IoT Hub menu, select Operations monitoring.
Under each monitoring category, select None.
Save the operations monitoring changes.
Update applications that use operations monitoring
The schemas for operations monitoring and resource logs vary slightly. It's important that you update the applications that use operations monitoring today to map to the schema used by resource logs.
Also, IoT Hub resource logs offers five new categories for tracking. After you update applications for the existing schema, add the new categories as well:
- Cloud-to-device twin operations
- Device-to-cloud twin operations
- Twin queries
- Jobs operations
- Direct Methods
For the specific schema structures, see Resource logs.
Monitoring device connect and disconnect events with low latency
To monitor device connect and disconnect events in production, we recommend subscribing to the device disconnected event on Event Grid to get alerts and monitor the device connection state. Use this tutorial to learn how to integrate Device Connected and Device Disconnected events from IoT Hub in your IoT solution.