Note
Access to this page requires authorization. You can try signing in or changing directories.
Access to this page requires authorization. You can try changing directories.
IoT Hub operations monitoring enables you to monitor the status of operations on your IoT hub in real time. IoT Hub tracks events across several categories of operations. You can opt into sending events from one or more categories to an endpoint of your IoT hub for processing. You can monitor the data for errors or set up more complex processing based on data patterns.
Note
IoT Hub operations monitoring is deprecated and has been removed from IoT Hub on March 10, 2019. For monitoring the operations and health of IoT Hub, see Monitor IoT Hub. For more information about the deprecation timeline, see Monitor your Azure IoT solutions with Azure Monitor and Azure Resource Health.
IoT Hub monitors six categories of events:
- Device identity operations
- Device telemetry
- Cloud-to-device messages
- Connections
- File uploads
- Message routing
Important
IoT Hub operations monitoring does not guarantee reliable or ordered delivery of events. Depending on IoT Hub underlying infrastructure, some events might be lost or delivered out of order. Use operations monitoring to generate alerts based on error signals such as failed connection attempts, or high-frequency disconnections for specific devices. You should not rely on operations monitoring events to create a consistent store for device state, e.g. a store tracking connected or disconnected state of a device.
How to enable operations monitoring
Create an IoT hub. You can find instructions on how to create an IoT hub in the Get Started guide.
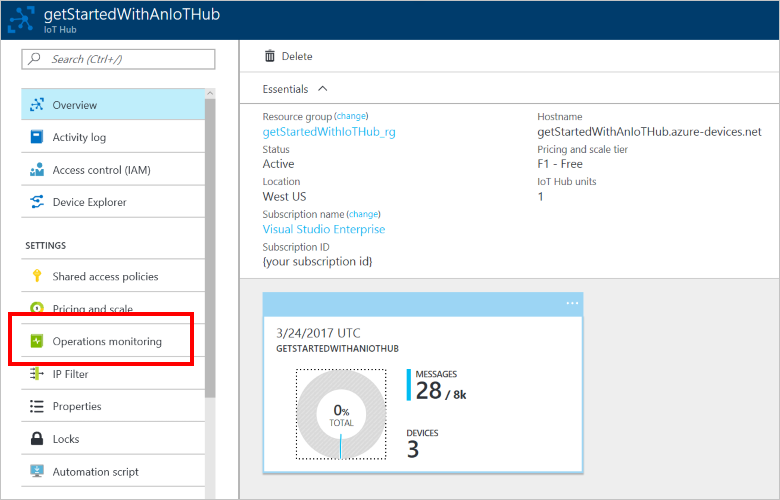
Open the blade of your IoT hub. From there, click Operations monitoring.
Select the monitoring categories you wish to monitor, and then click Save. The events are available for reading from the Event Hub-compatible endpoint listed in Monitoring settings. The IoT Hub endpoint is called
messages/operationsmonitoringevents.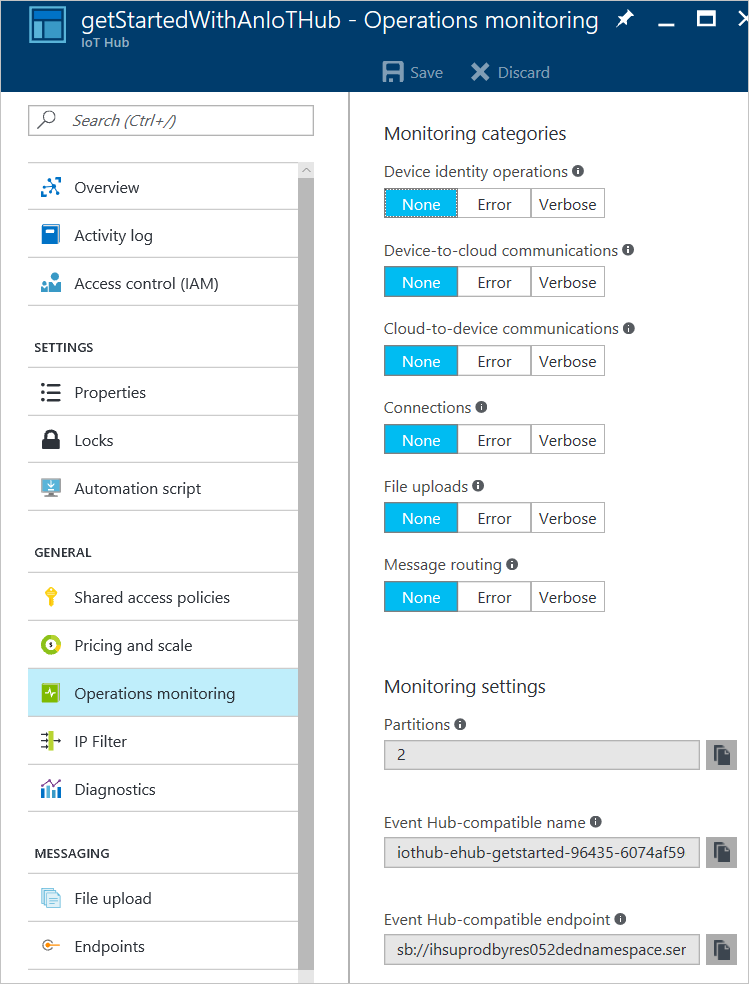
Note
Selecting Verbose monitoring for the Connections category causes IoT Hub to generate additional diagnostics messages. For all other categories, the Verbose setting changes the quantity of information IoT Hub includes in each error message.
Event categories and how to use them
Each operations monitoring category tracks a different type of interaction with IoT Hub, and each monitoring category has a schema that defines how events in that category are structured.
Device identity operations
The device identity operations category tracks errors that occur when you attempt to create, update, or delete an entry in your IoT hub's identity registry. Tracking this category is useful for provisioning scenarios.
{
    "time": "UTC timestamp",
    "operationName": "create",
    "category": "DeviceIdentityOperations",
    "level": "Error",
    "statusCode": 4XX,
    "statusDescription": "MessageDescription",
    "deviceId": "device-ID",
    "durationMs": 1234,
    "userAgent": "userAgent",
    "sharedAccessPolicy": "accessPolicy"
}
Device telemetry
The device telemetry category tracks errors that occur at the IoT hub and are related to the telemetry pipeline. This category includes errors that occur when sending telemetry events (such as throttling) and receiving telemetry events (such as unauthorized reader). This category cannot catch errors caused by code running on the device itself.
{
    "messageSizeInBytes": 1234,
    "batching": 0,
    "protocol": "Amqp",
    "authType": "{\"scope\":\"device\",\"type\":\"sas\",\"issuer\":\"iothub\"}",
    "time": "UTC timestamp",
    "operationName": "ingress",
    "category": "DeviceTelemetry",
    "level": "Error",
    "statusCode": 4XX,
    "statusType": 4XX001,
    "statusDescription": "MessageDescription",
    "deviceId": "device-ID",
    "EventProcessedUtcTime": "UTC timestamp",
    "PartitionId": 1,
    "EventEnqueuedUtcTime": "UTC timestamp"
}
Cloud-to-device commands
The cloud-to-device commands category tracks errors that occur at the IoT hub and are related to the cloud-to-device message pipeline. This category includes errors that occur when sending cloud-to-device messages (such as unauthorized sender), receiving cloud-to-device messages (such as delivery count exceeded), and receiving cloud-to-device message feedback (such as feedback expired). This category does not catch errors from a device that improperly handles a cloud-to-device message if the cloud-to-device message was delivered successfully.
{
    "messageSizeInBytes": 1234,
    "authType": "{\"scope\":\"hub\",\"type\":\"sas\",\"issuer\":\"iothub\"}",
    "deliveryAcknowledgement": 0,
    "protocol": "Amqp",
    "time": " UTC timestamp",
    "operationName": "ingress",
    "category": "C2DCommands",
    "level": "Error",
    "statusCode": 4XX,
    "statusType": 4XX001,
    "statusDescription": "MessageDescription",
    "deviceId": "device-ID",
    "EventProcessedUtcTime": "UTC timestamp",
    "PartitionId": 1,
    "EventEnqueuedUtcTime": "UTC timestamp"
}
Connections
The connections category tracks errors that occur when devices connect or disconnect from an IoT hub. Tracking this category is useful for identifying unauthorized connection attempts and for tracking when a connection is lost for devices in areas of poor connectivity.
{
    "durationMs": 1234,
    "authType": "{\"scope\":\"hub\",\"type\":\"sas\",\"issuer\":\"iothub\"}",
    "protocol": "Amqp",
    "time": " UTC timestamp",
    "operationName": "deviceConnect",
    "category": "Connections",
    "level": "Error",
    "statusCode": 4XX,
    "statusType": 4XX001,
    "statusDescription": "MessageDescription",
    "deviceId": "device-ID"
}
File uploads
The file upload category tracks errors that occur at the IoT hub and are related to file upload functionality. This category includes:
- Errors that occur with the SAS URI, such as when it expires before a device notifies the hub of a completed upload.
- Failed uploads reported by the device.
- Errors that occur when a file is not found in storage during IoT Hub notification message creation.
This category cannot catch errors that directly occur while the device is uploading a file to storage.
{
    "authType": "{\"scope\":\"hub\",\"type\":\"sas\",\"issuer\":\"iothub\"}",
    "protocol": "HTTP",
    "time": " UTC timestamp",
    "operationName": "ingress",
    "category": "fileUpload",
    "level": "Error",
    "statusCode": 4XX,
    "statusType": 4XX001,
    "statusDescription": "MessageDescription",
    "deviceId": "device-ID",
    "blobUri": "http//bloburi.com",
    "durationMs": 1234
}
Message routing
The message routing category tracks errors that occur during message route evaluation and endpoint health as perceived by IoT Hub. This category includes events such as when a rule evaluates to "undefined", when IoT Hub marks an endpoint as dead, and any other errors received from an endpoint. This category does not include specific errors about the messages themselves (such as device throttling errors), which are reported under the "device telemetry" category.
{
    "messageSizeInBytes": 1234,
    "time": "UTC timestamp",
    "operationName": "ingress",
    "category": "routes",
    "level": "Error",
    "deviceId": "device-ID",
    "messageId": "ID of message",
    "routeName": "myroute",
    "endpointName": "myendpoint",
    "details": "ExternalEndpointDisabled"
}
Connect to the monitoring endpoint
The monitoring endpoint on your IoT hub is an Event Hub-compatible endpoint. You can use any mechanism that works with Event Hubs to read monitoring messages from this endpoint. The following sample creates a basic reader that is not suitable for a high throughput deployment. For more information about how to process messages from Event Hubs, see the Get Started with Event Hubs tutorial.
To connect to the monitoring endpoint, you need a connection string and the endpoint name. The following steps show you how to find the necessary values in the portal:
In the portal, navigate to your IoT Hub resource blade.
Choose Operations monitoring, and make a note of the Event Hub-compatible name and Event Hub-compatible endpoint values:

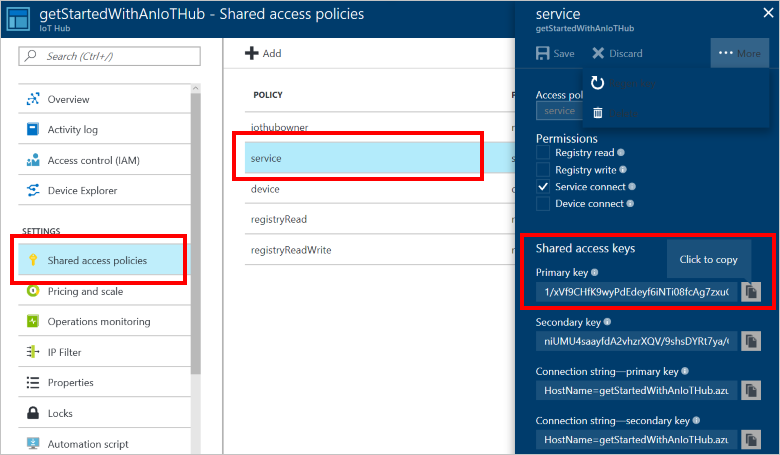
Choose Shared access policies, then choose service. Make a note of the Primary key value:
The following C# code sample is taken from a Visual Studio Windows Classic Desktop C# console app. The project has the WindowsAzure.ServiceBus NuGet package installed.
Replace the connection string placeholder with a connection string that uses the Event Hub-compatible endpoint and service Primary key values you noted previously as shown in the following example:
"Endpoint={your Event Hub-compatible endpoint};SharedAccessKeyName=service;SharedAccessKey={your service primary key value}"Replace the monitoring endpoint name placeholder with the Event Hub-compatible name value you noted previously.
class Program
{
    static string connectionString = "{your monitoring endpoint connection string}";
    static string monitoringEndpointName = "{your monitoring endpoint name}";
    static EventHubClient eventHubClient;

    static void Main(string[] args)
    {
        Console.WriteLine("Monitoring. Press Enter key to exit.\n");

        eventHubClient = EventHubClient.CreateFromConnectionString(connectionString, monitoringEndpointName);
        var d2cPartitions = eventHubClient.GetRuntimeInformation().PartitionIds;
        CancellationTokenSource cts = new CancellationTokenSource();
        var tasks = new List<Task>();

        foreach (string partition in d2cPartitions)
        {
            tasks.Add(ReceiveMessagesFromDeviceAsync(partition, cts.Token));
        }

        Console.ReadLine();
        Console.WriteLine("Exiting...");
        cts.Cancel();
        Task.WaitAll(tasks.ToArray());
    }

    private static async Task ReceiveMessagesFromDeviceAsync(string partition, CancellationToken ct)
    {
        var eventHubReceiver = eventHubClient.GetDefaultConsumerGroup().CreateReceiver(partition, DateTime.UtcNow);
        while (true)
        {
            if (ct.IsCancellationRequested)
            {
                await eventHubReceiver.CloseAsync();
                break;
            }

            EventData eventData = await eventHubReceiver.ReceiveAsync(new TimeSpan(0,0,10));

            if (eventData != null)
            {
                string data = Encoding.UTF8.GetString(eventData.GetBytes());
                Console.WriteLine("Message received. Partition: {0} Data: '{1}'", partition, data);
            }
        }
    }
}
Next steps
To further explore using Azure Monitor to monitor IoT Hub, see: