Note
Access to this page requires authorization. You can try signing in or changing directories.
Access to this page requires authorization. You can try changing directories.
Note
This feature is currently in public preview. This preview is provided without a service-level agreement, and we don't recommend it for production workloads. Certain features might not be supported or might have constrained capabilities. For more information, see Supplemental Terms of Use for Azure Previews.
After deploying a Generative AI APP in production, APP developers seek to enhance their understanding and optimize performance. Trace data for each request, aggregated metrics, and user feedback play critical roles.
In this article, you'll learn to enable trace, collect aggregated metrics, and user feedback during inference time of your flow deployment.
Prerequisites
- The Azure CLI and the Azure Machine Learning extension to the Azure CLI. For more information, see Install, set up, and use the CLI (v2).
- An Azure Machine Learning workspace. If you don't have one, use the steps in the Quickstart: Create workspace resources article to create one.
- An Application Insights. Usually a machine learning workspace has a default linked Application Insights. If you want to use a new one, you can create an Application Insights resource.
- Have basic understanding on managed online endpoints. Managed online endpoints work with powerful CPU and GPU machines in Azure in a scalable, fully managed way that frees you from the overhead of setting up and managing the underlying deployment infrastructure. For more information on managed online endpoints, see Online endpoints and deployments for real-time inference.
- Azure role-based access controls (Azure RBAC) are used to grant access to operations in Azure Machine Learning. To perform the steps in this article, your user account must be assigned the owner or contributor role for the Azure Machine Learning workspace, or a custom role allowing "Microsoft.MachineLearningServices/workspaces/onlineEndpoints/". If you use studio to create/manage online endpoints/deployments, you need another permission "Microsoft.Resources/deployments/write" from the resource group owner. For more information, see Manage access to an Azure Machine Learning workspace.
Deploy a flow for real-time inference
After you test your flow properly, either a flex flow or a DAG flow, you can deploy the flow in production. In this article, we use deploy a flow to Azure Machine Learning managed online endpoints as example. For flex flows, you need to prepare the flow.flex.yaml file instead of flow.dag.yaml.
You can also deploy to other platforms, such as Docker container, Kubernetes cluster, etc..
Note
You need to use the latest prompt flow base image to deploy the flow, so that it support the tracing and feedback collection API.
Enable trace and collect system metrics for your deployment
If you're using studio UI to deploy, then you can turn-on Application Insights diagnostics in Advanced settings -> Deployment step in the deploy wizard, in which way the tracing data and system metrics are collected to workspace linked Application Insights.
If you're using SDK or CLI, you can add a property app_insights_enabled: true in the deployment yaml file that will collect data to workspace linked Application Insights. You can also specify other Application Insights by an environment variable APPLICATIONINSIGHTS_CONNECTION_STRING in the deployment yaml file as following. You can find the connection string of your Application Insights in the Overview page in Azure portal.
# below is the property in deployment yaml
# app_insights_enabled: true

# you can also use the environment variable
environment_variables:
  APPLICATIONINSIGHTS_CONNECTION_STRING: <connection_string>
Note
If you only set app_insights_enabled: true but your workspace does not have a linked Application Insights, your deployment will not fail but there will be no data collected.
If you specify both app_insights_enabled: true and the above environment variable at the same time, the tracing data and metrics will be sent to workspace linked Application Insights. Hence, if you want to specify a different Application Insights, you only need to keep the environment variable.
If you deploy to other platforms, you can also use the environment variable APPLICATIONINSIGHTS_CONNECTION_STRING: <connection_string> to collect trace data and metrics to speicifed Application Insights.
View tracing data in Application Insights
Traces record specific events or the state of an application during execution. It can include data about function calls, variable values, system events and more. Traces help break down an application's components into discrete inputs and outputs, which is crucial for debugging and understanding an application. To learn more, see OpenTelemetry traces on traces. The trace data follows OpenTelemetry specification.
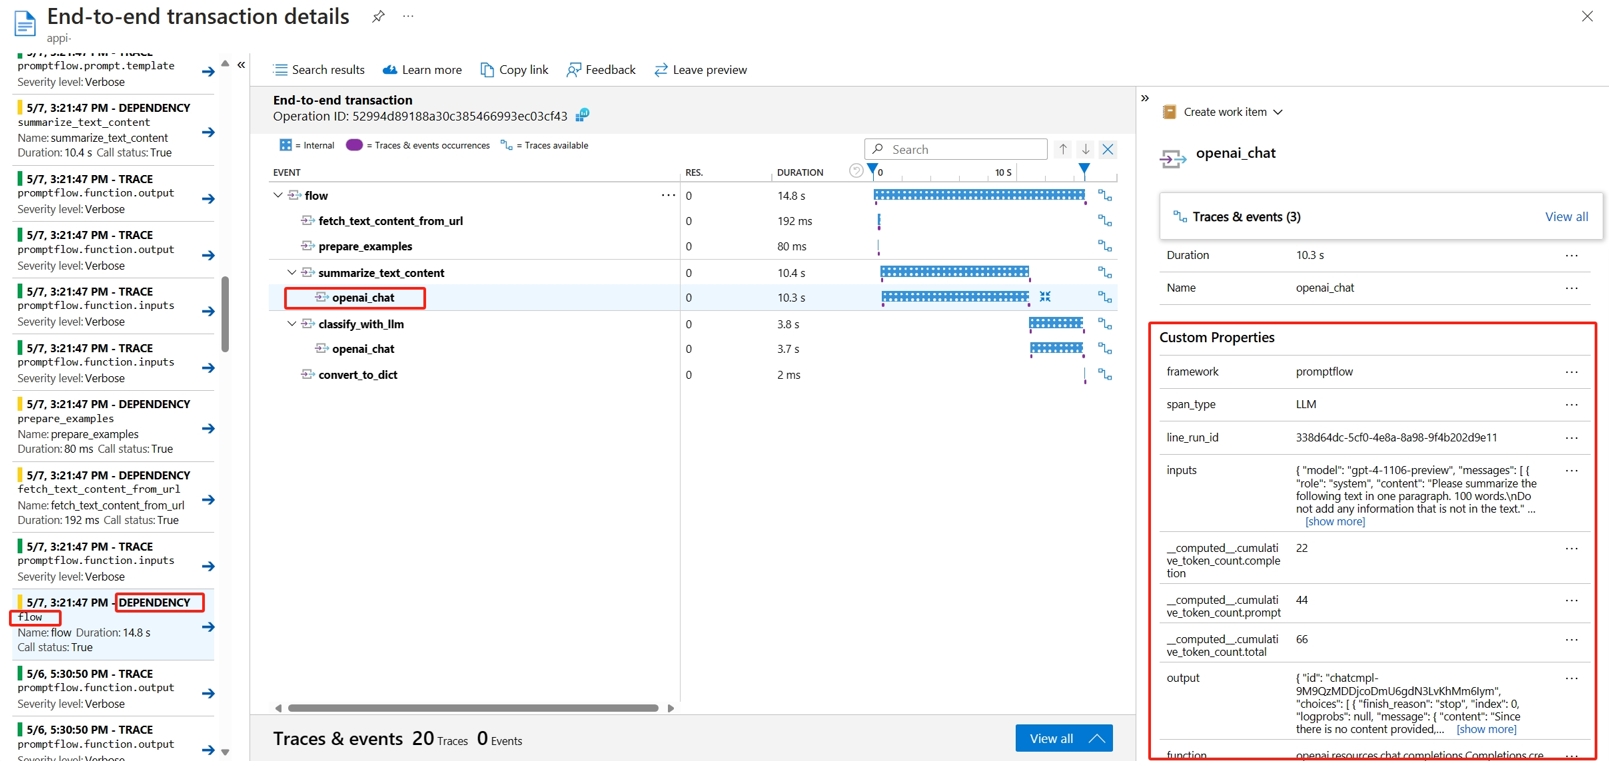
You can view the detailed trace in the specified Application Insights. The following screenshot shows an example of an event of a deployed flow containing multiple nodes. In Application Insights -> Investigate -> Transaction search, and you can select each node to view its detailed trace.
The Dependency type events record calls from your deployments. The name of that event is the name of the flow folder. Learn more about Transaction search and diagnostics in Application Insights.
View system metrics in Application Insights
| Metrics Name | Type | Dimensions | Description |
|---|---|---|---|
| token_consumption | counter | - flow - node - llm_engine - token_type: prompt_tokens: LLM API input tokens; completion_tokens: LLM API response tokens; total_tokens = prompt_tokens + completion tokens |
OpenAI token consumption metrics |
| flow_latency | histogram | flow, response_code, streaming, response_type | request execution cost, response_type means whether it's full/firstbyte/lastbyte |
| flow_request | counter | flow, response_code, exception, streaming | flow request count |
| node_latency | histogram | flow, node, run_status | node execution cost |
| node_request | counter | flow, node, exception, run_status | node execution count |
| rpc_latency | histogram | flow, node, api_call | rpc cost |
| rpc_request | counter | flow, node, api_call, exception | rpc count |
| flow_streaming_response_duration | histogram | flow | streaming response sending cost, from sending first byte to sending last byte |
You can find the workspace default Application Insights in your workspace overview page in Azure portal.
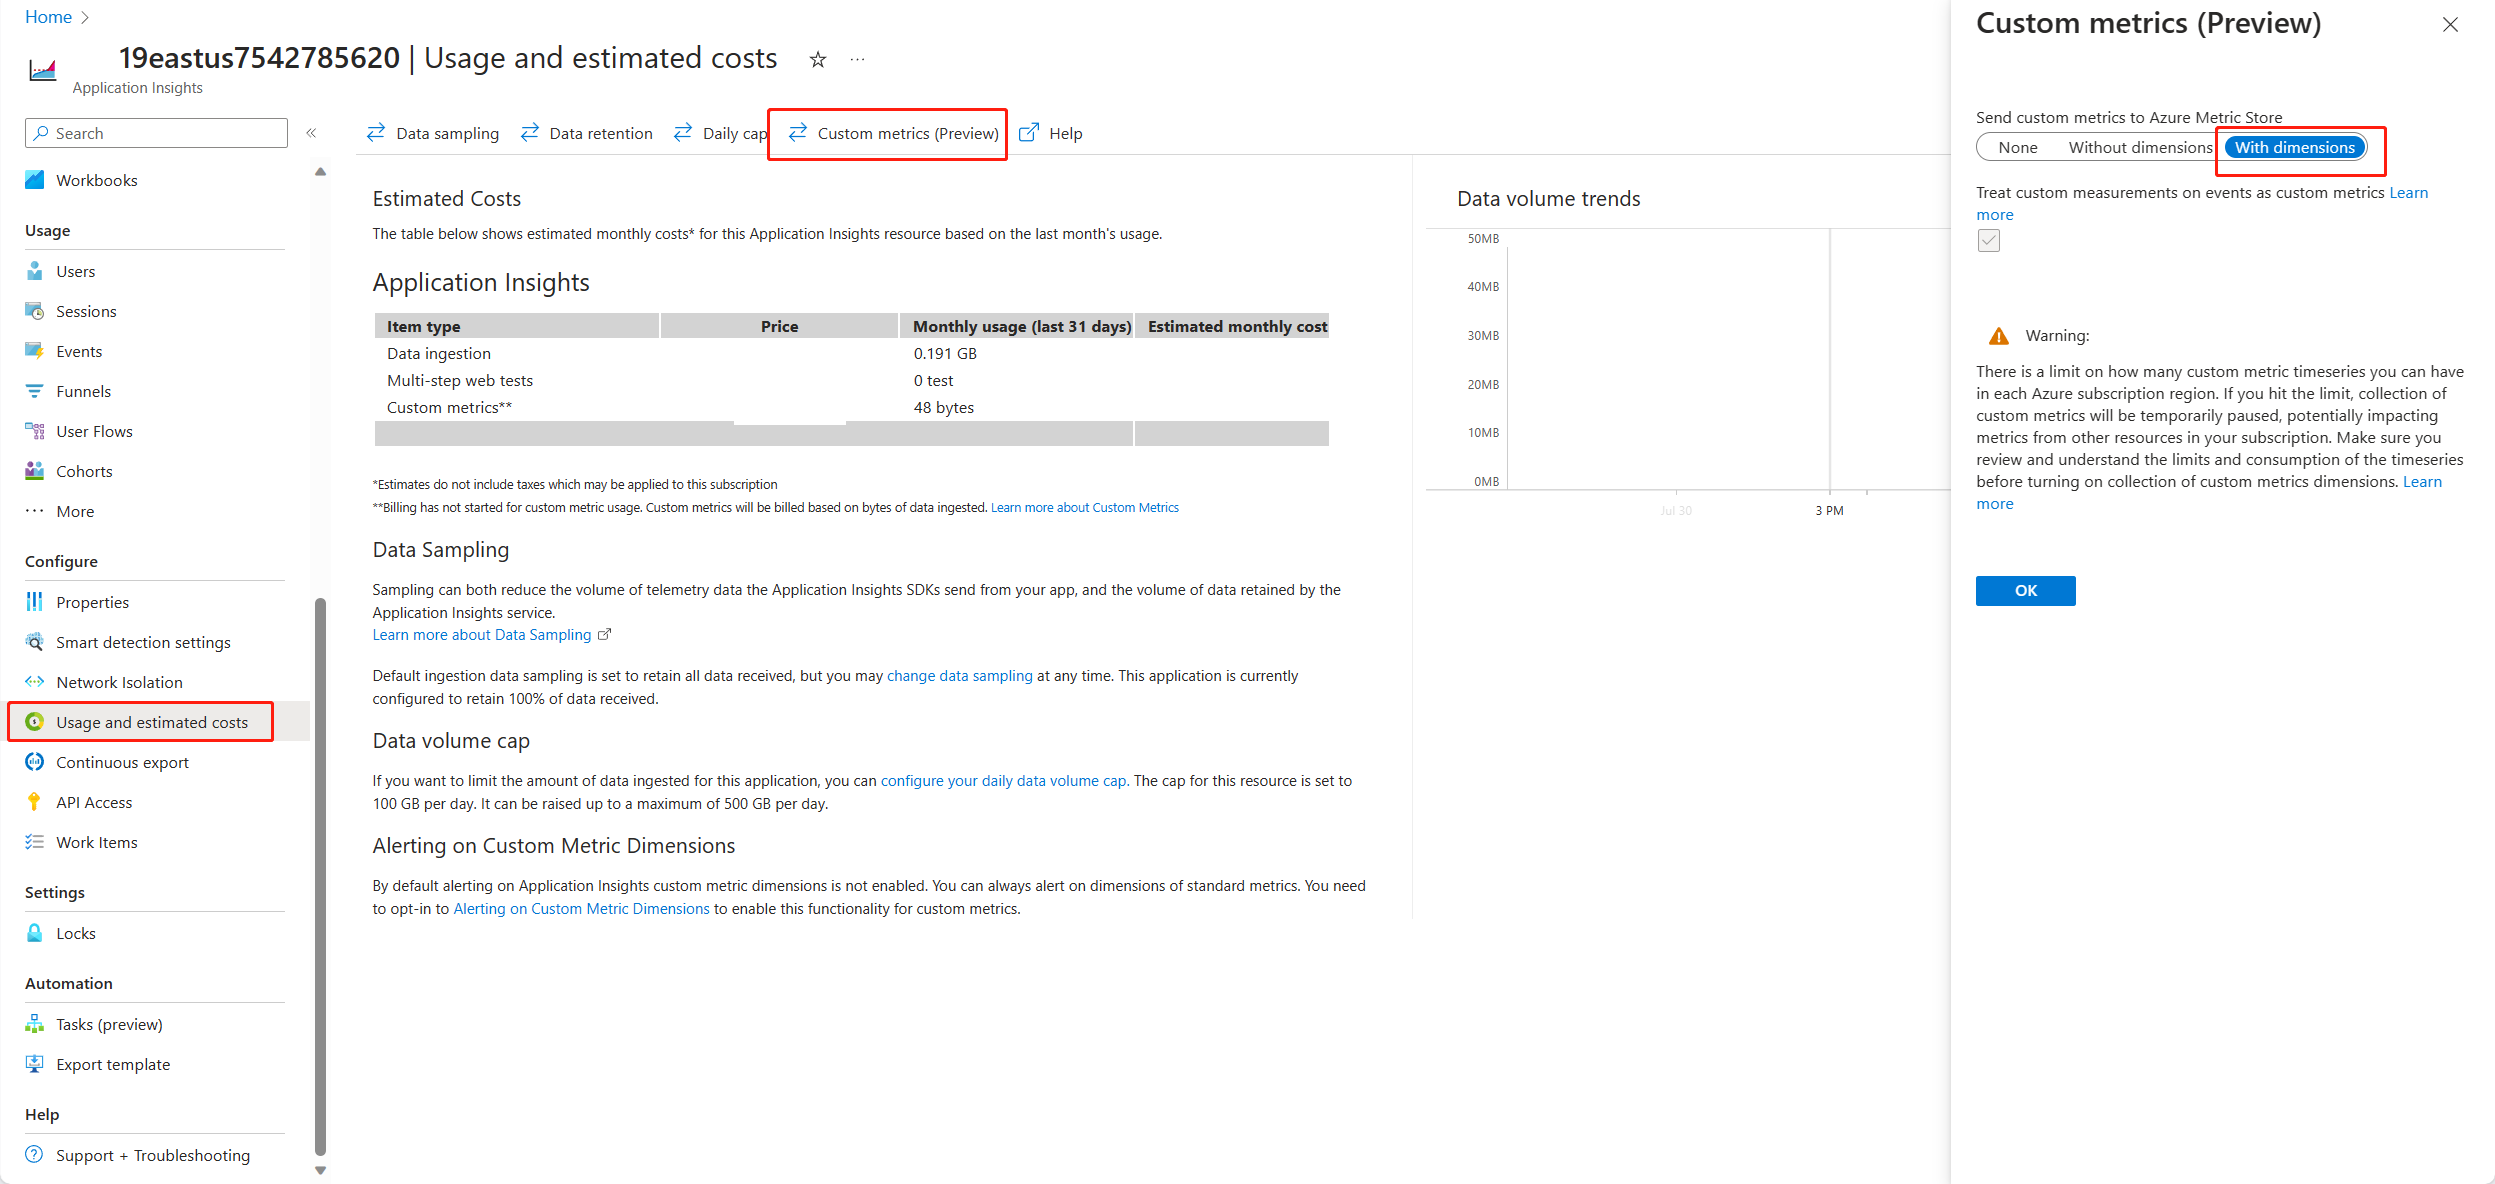
Open the Application Insights, and select Usage and estimated costs from the left navigation. Select Custom metrics (Preview), and select With dimensions, and save the change.
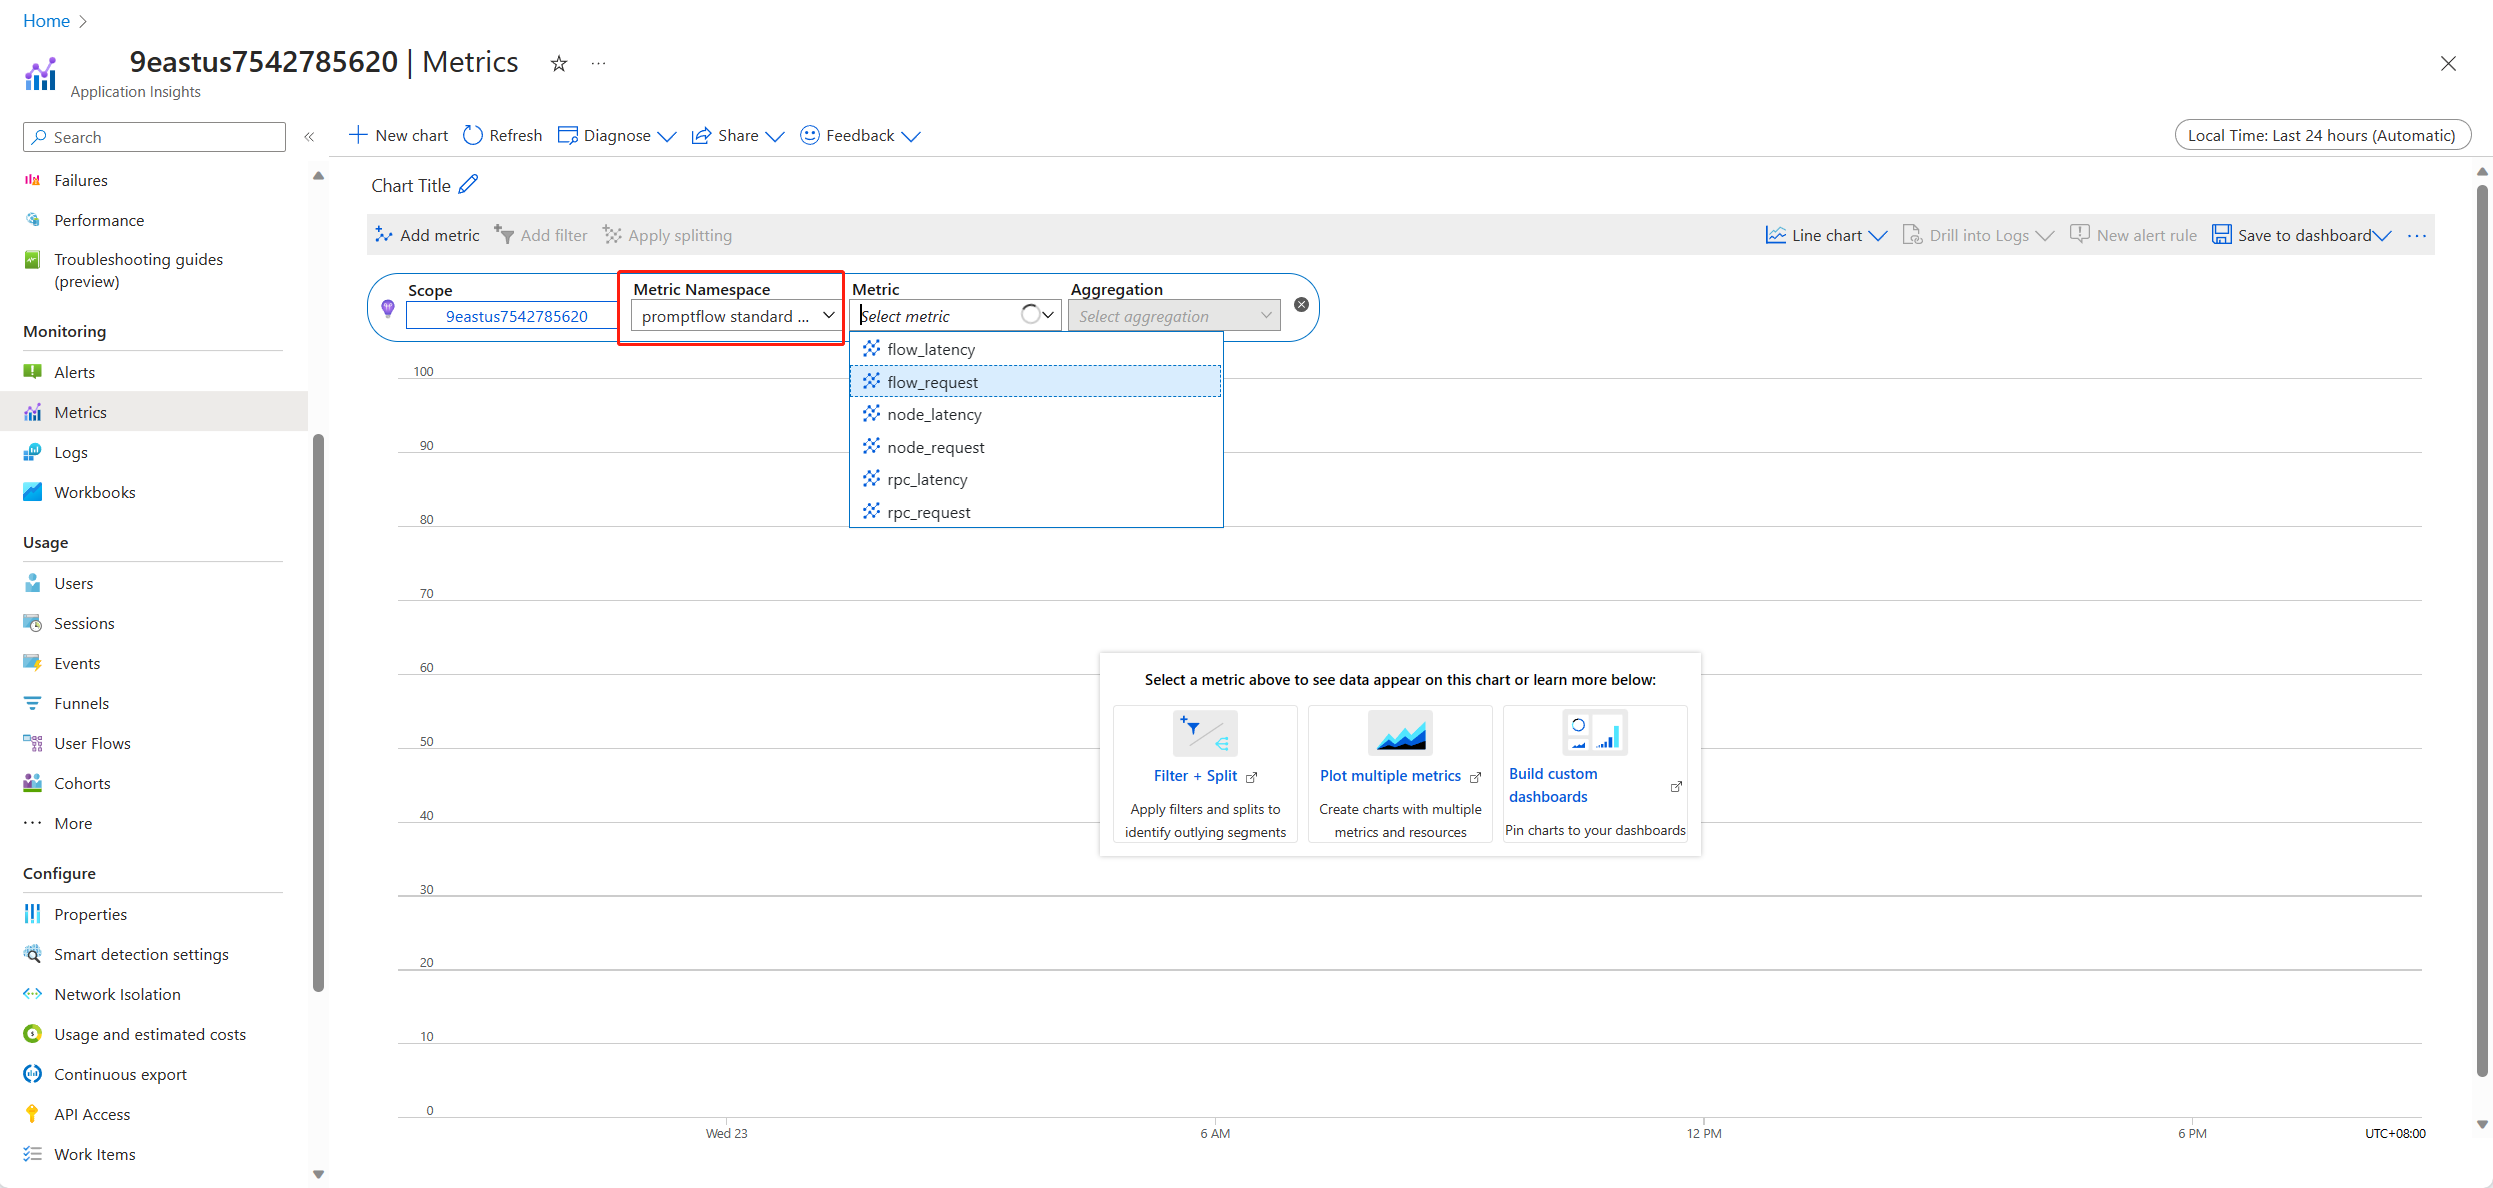
Select Metrics tab in the left navigation. Select promptflow standard metrics from the Metric Namespace, and you can explore the metrics from the Metric dropdown list with different aggregation methods.
Collect feedback and send to Application Insights
Prompt flow serving provides a new /feedback API to help customer collect the feedback, the feedback payload can be any json format data, PF serving just helps customer save the feedback data to a trace span. Data will be saved to the trace exporter target customer configured. It also supports OpenTelemetry standard trace context propagation, saying it respects the trace context set in the request header and use that as the request parent span context. You can leverage the distributed tracing functionality to correlate the Feedback trace to its chat request trace.
Following is sample code showing how to score a flow deployed managed endpoint enabled tracing and send the feedback to the same trace span of scoring request. The flow has inputs question and chat_hisotry, and output answer. After scoring the endpoint, we collect a feedback and send to Application Insights specified when deploying the flow. You need to fill in the api_key value or modify the code according to your use case.
import urllib.request
import json
import os
import ssl
from opentelemetry import trace, context
from opentelemetry.baggage.propagation import W3CBaggagePropagator
from opentelemetry.trace.propagation.tracecontext import TraceContextTextMapPropagator
from opentelemetry.sdk.trace import TracerProvider

# Initialize your tracer
tracer = trace.get_tracer("my.genai.tracer")
trace.set_tracer_provider(TracerProvider())

# Request data goes here
# The example below assumes JSON formatting which may be updated
# depending on the format your endpoint expects.
# More information can be found here:
# /machine-learning/how-to-deploy-advanced-entry-script
data = {
    "question": "hello",
    "chat_history": []
}

body = str.encode(json.dumps(data))

url = 'https://basic-chat-endpoint.eastus.inference.ml.azure.com/score'
feedback_url = 'https://basic-chat-endpoint.eastus.inference.ml.azure.com/feedback'
# Replace this with the primary/secondary key, AMLToken, or Microsoft Entra ID token for the endpoint
api_key = ''
if not api_key:
    raise Exception("A key should be provided to invoke the endpoint")

# The azureml-model-deployment header will force the request to go to a specific deployment.
# Remove this header to have the request observe the endpoint traffic rules
headers = {'Content-Type':'application/json', 'Authorization':('Bearer '+ api_key), 'azureml-model-deployment': 'basic-chat-deployment' }

try:
    with tracer.start_as_current_span('genai-request') as span:

        ctx = context.get_current()
        TraceContextTextMapPropagator().inject(headers, ctx)
        print(headers)
        print(ctx)
        req = urllib.request.Request(url, body, headers)
        response = urllib.request.urlopen(req)

        result = response.read()
        print(result)

        # Now you can process the answer and collect feedback
        feedback = "thumbdown"  # Example feedback (modify as needed)

        # Make another request to save the feedback
        feedback_body = str.encode(json.dumps(feedback))
        feedback_req = urllib.request.Request(feedback_url, feedback_body, headers)
        urllib.request.urlopen(feedback_req)


except urllib.error.HTTPError as error:
    print("The request failed with status code: " + str(error.code))

    # Print the headers - they include the requert ID and the timestamp, which are useful for debugging the failure
    print(error.info())
    print(error.read().decode("utf8", 'ignore'))
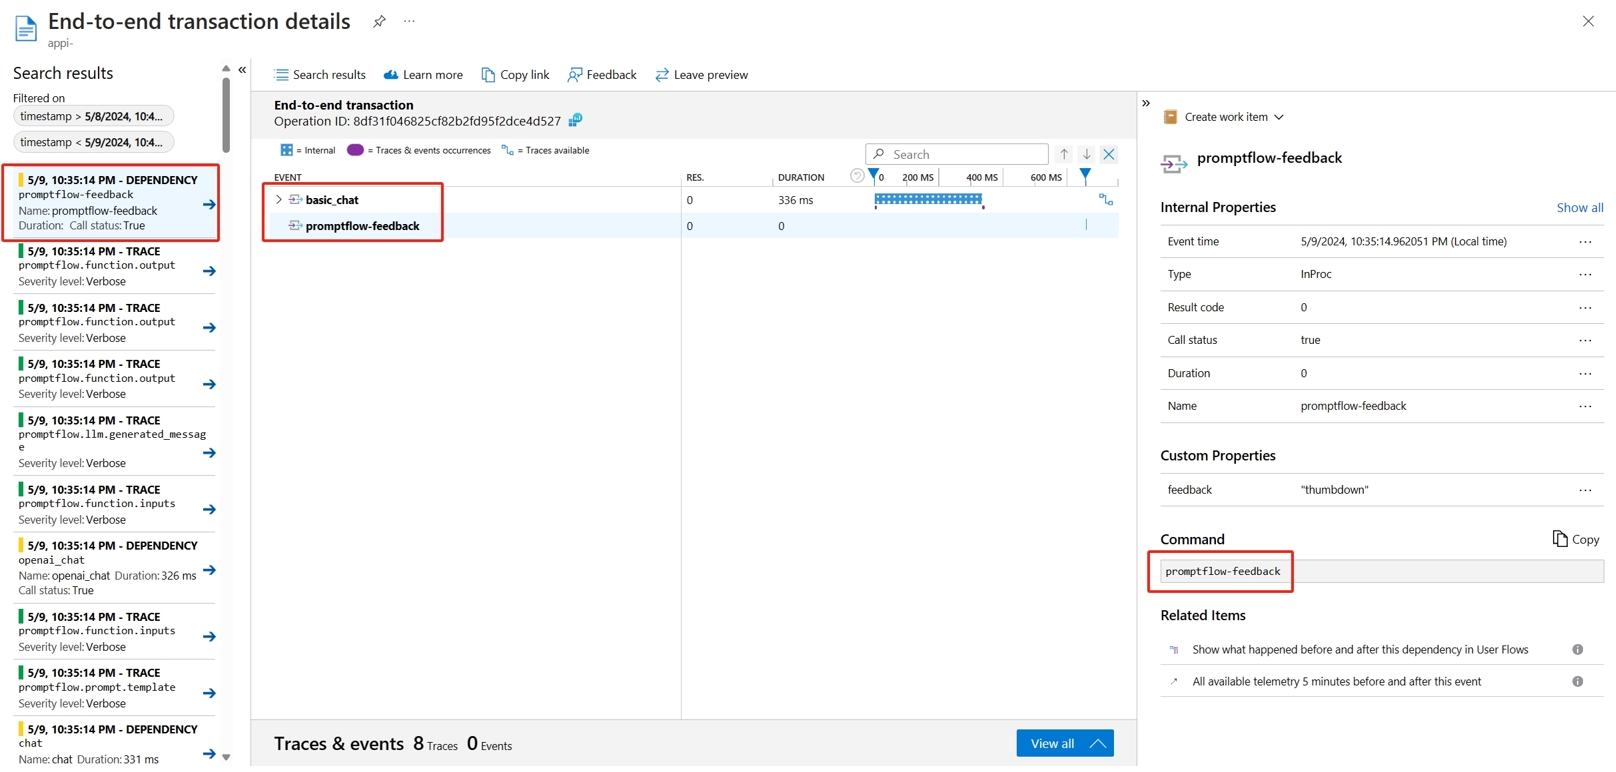
You can view the trace of the request along with feedback in Application Insights.
Advanced usage: Export trace to custom OpenTelemetry collector service
In some cases, you might want to export the trace data to your deployed OTel collector service, enabled by setting "OTEL_EXPORTER_OTLP_ENDPOINT". Use this exporter when you want to customize our own span processing logic and your own trace persistent target.


