Note
Access to this page requires authorization. You can try signing in or changing directories.
Access to this page requires authorization. You can try changing directories.
Important
This article provides information on using the Azure Machine Learning SDK v1. SDK v1 is deprecated as of March 31, 2025. Support for it will end on June 30, 2026. You can install and use SDK v1 until that date. Your existing workflows using SDK v1 will continue to operate after the end-of-support date. However, they could be exposed to security risks or breaking changes in the event of architectural changes in the product.
We recommend that you transition to the SDK v2 before June 30, 2026. For more information on SDK v2, see What is Azure Machine Learning CLI and Python SDK v2? and the SDK v2 reference.
This article explains how to use the Azure Machine Learning designer to train a linear regression model that predicts car prices. This tutorial is part one of a two-part series.
To learn more about the designer, see What is Azure Machine Learning designer?
Note
Designer supports two types of components: classic prebuilt components (v1) and custom components (v2). These two types of components are NOT compatible.
Classic prebuilt components are intended primarily for data processing and traditional machine learning tasks like regression and classification. This type of component continues to be supported but will not have any new components added.
Custom components allow you to wrap your own code as a component. It supports sharing components across workspaces and seamless authoring across Studio, CLI v2, and SDK v2 interfaces.
For new projects, we highly suggest that you use custom components, which are compatible with Azure Machine Learning V2 and will keep receiving new updates.
This article applies to classic prebuilt components and isn't compatible with CLI v2 and SDK v2.
In this tutorial, you learn how to:
- Create a new pipeline.
- Import data.
- Prepare data.
- Train a machine learning model.
- Evaluate a machine learning model.
In part two of the tutorial, you deploy your model as a real-time inferencing endpoint to predict the price of any car based on technical specifications that you send it.
Note
To view a completed version of this tutorial as a sample pipeline, see Use regression to predict car prices with Azure Machine Learning designer.
Important
If you don't see graphical elements mentioned in this document, such as buttons in studio or designer, you might not have the right level of permissions to the workspace. Contact your Azure subscription administrator to verify that you have been granted the correct level of access. For more information, see Manage users and roles.
Create a new pipeline
Azure Machine Learning pipelines organize multiple machine learning and data processing steps into a single resource. Pipelines let you organize, manage, and reuse complex machine learning workflows across projects and users.
To create an Azure Machine Learning pipeline, you need an Azure Machine Learning workspace. In this section, you learn how to create both these resources.
Create a new workspace
You need an Azure Machine Learning workspace to use the designer. The workspace is the top-level resource for Azure Machine Learning. It provides a centralized place to work with all the artifacts you create in Azure Machine Learning. To learn how to create a workspace, see Create workspace resources.
Note
If your workspace uses a virtual network, there are additional configuration steps needed to use the designer. For more information, see Use Azure Machine Learning studio in an Azure virtual network.
Create the pipeline
Sign in to the Azure Machine Learning studio, and select the workspace you want to use.
Select Designer from the sidebar menu. Under Classic prebuilt, choose Create a new pipeline using classic prebuilt components.
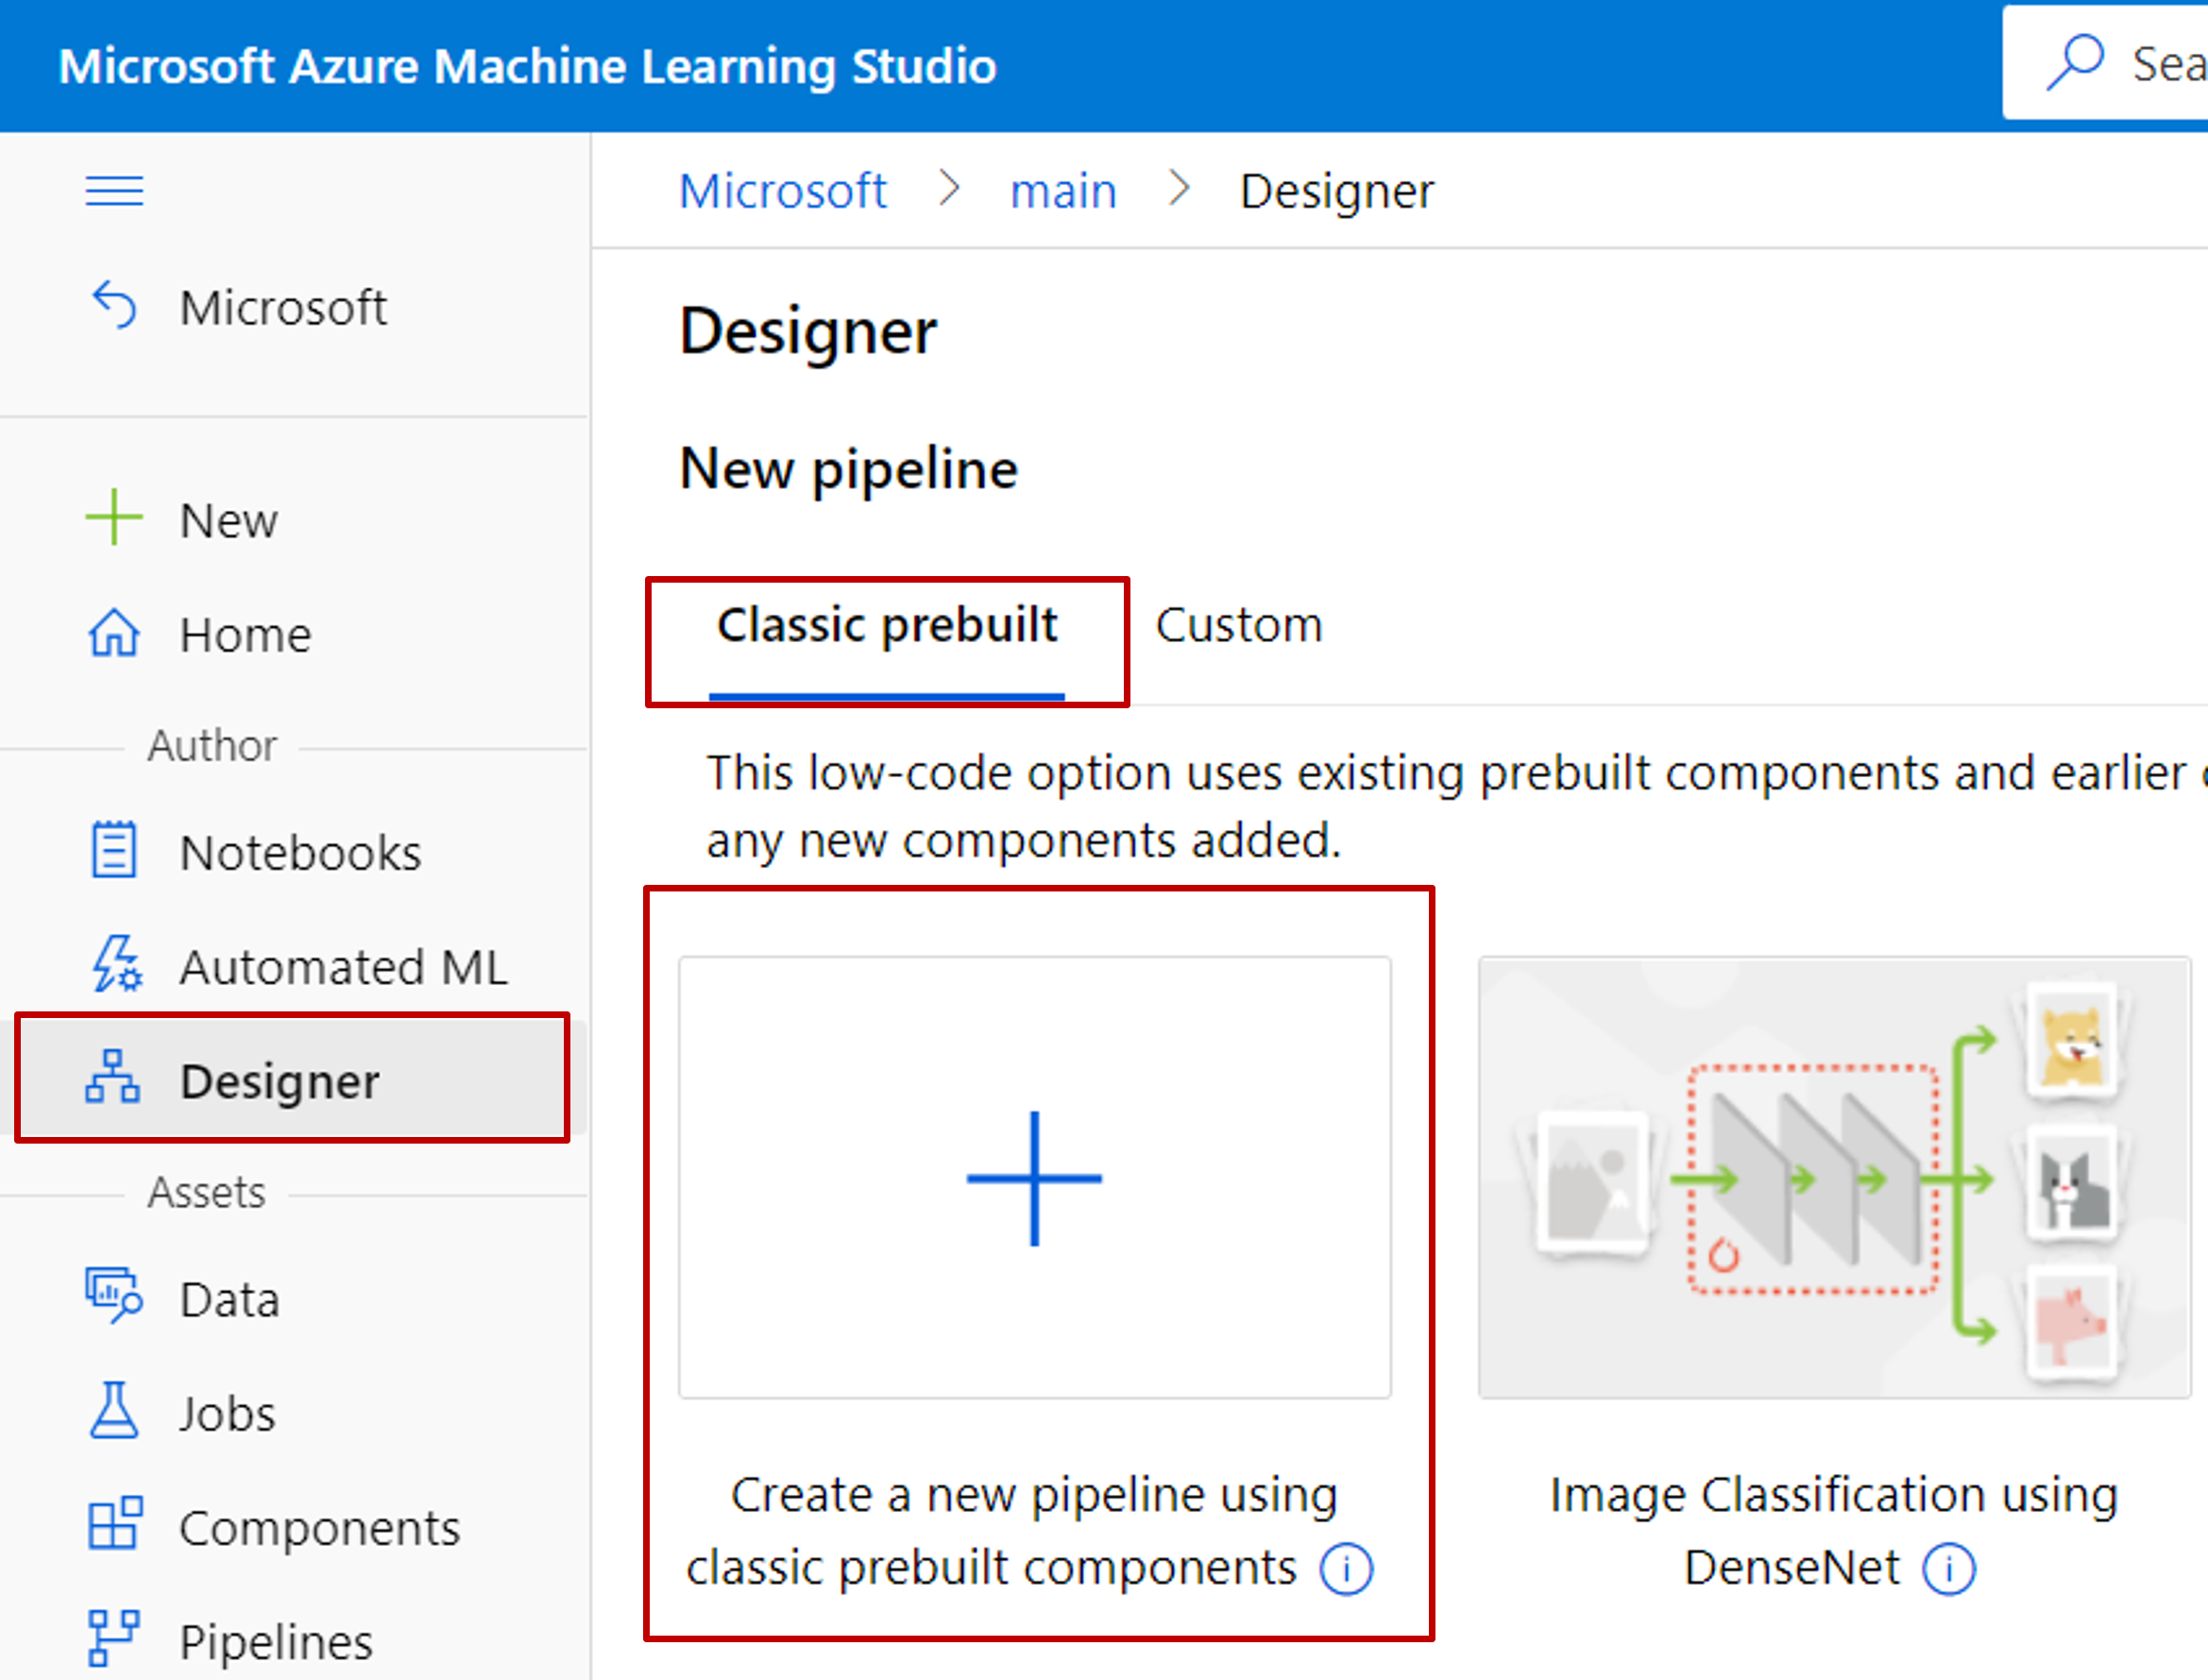
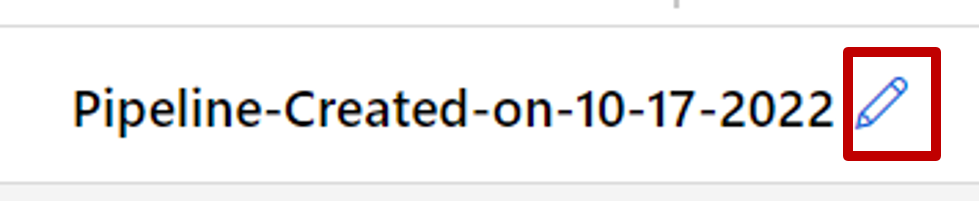
Select the pencil icon next to the automatically generated pipeline draft name, rename it to Automobile price prediction. The name doesn't need to be unique.

Import data
There are several sample datasets included in the designer for you to experiment with. For this tutorial, use Automobile price data (Raw).
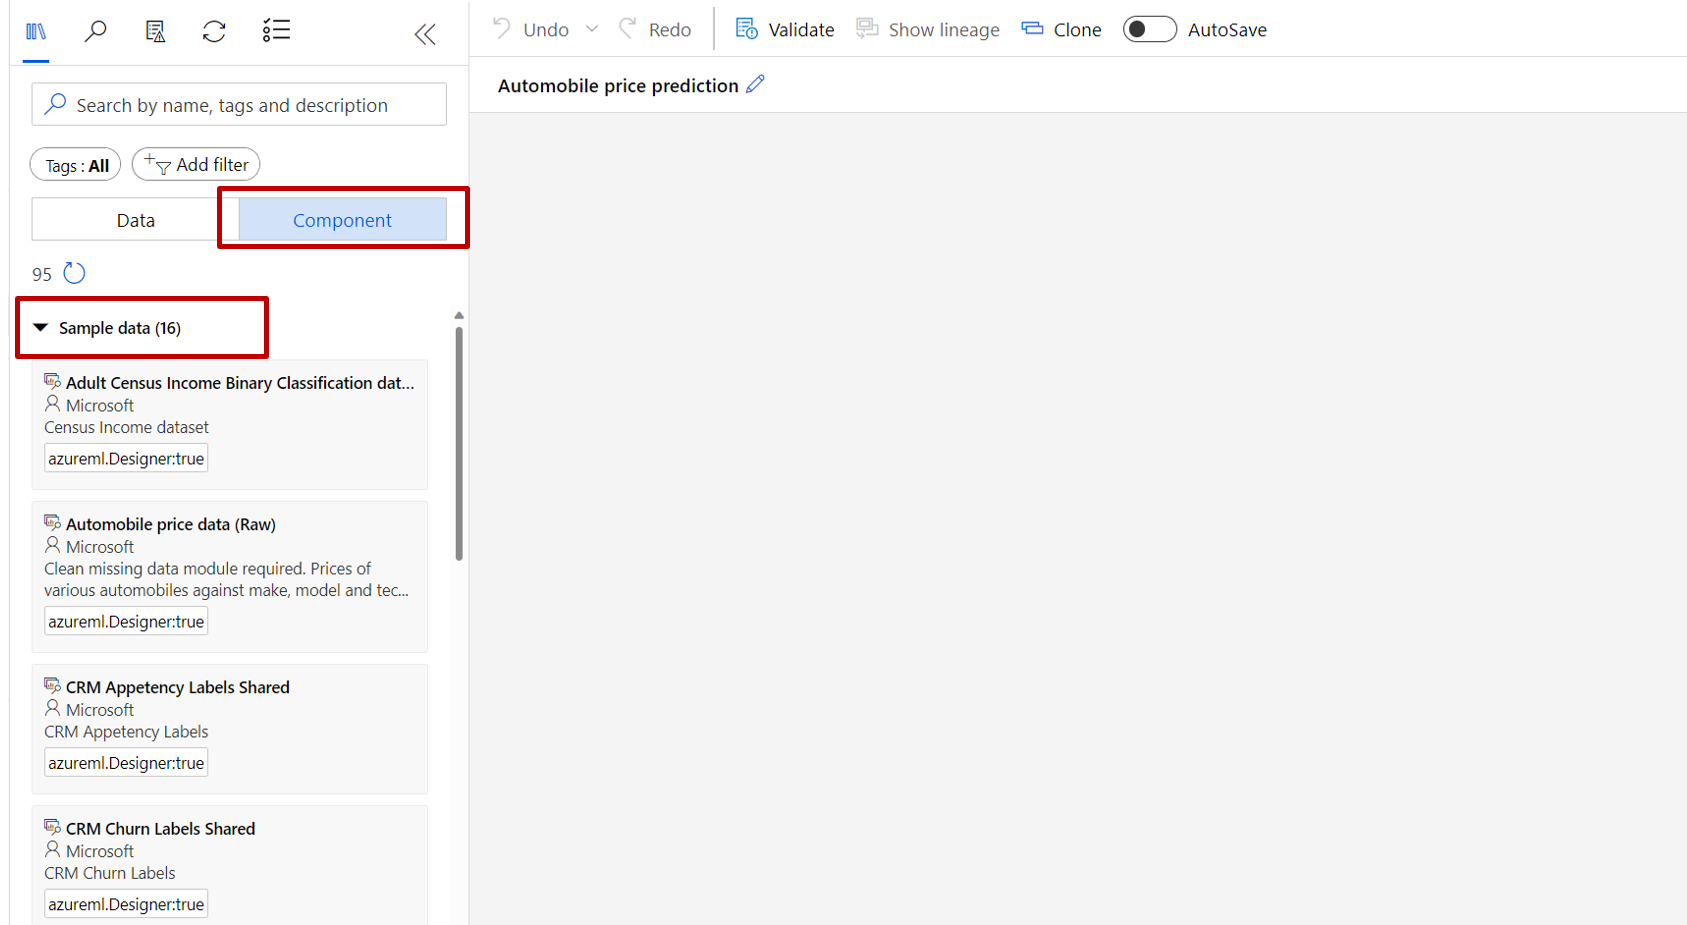
To the left of the pipeline canvas is a palette of datasets and components. Select Component > Sample data.
Select the dataset Automobile price data (Raw), and drag it onto the canvas.

Visualize the data
You can visualize the data to understand the dataset that you'll use.
Right-click the Automobile price data (Raw) and select Preview Data.
Select the different columns in the data window to view information about each one.
Each row represents an automobile, and the variables associated with each automobile appear as columns. There are 205 rows and 26 columns in this dataset.
Prepare data
Datasets typically require some preprocessing before analysis. You might have noticed some missing values when you inspected the dataset. These missing values must be cleaned so that the model can analyze the data correctly.
Remove a column
When you train a model, you must do something about the data that's missing. In this dataset, the normalized-losses column is missing many values, so you exclude that column from the model altogether.
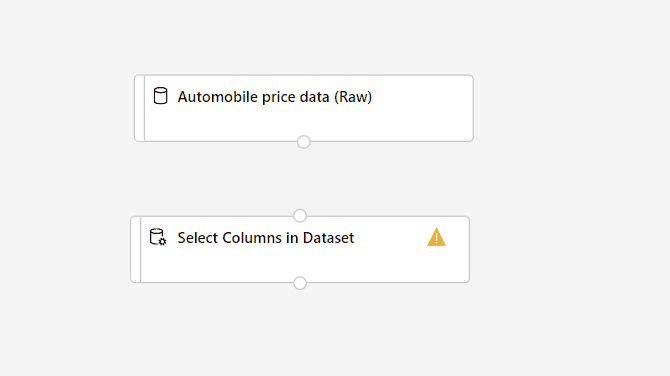
In the datasets and component palette to the left of the canvas, select Component and search for the Select Columns in Dataset component.
Drag the Select Columns in Dataset component onto the canvas. Drop the component below the dataset component.
Connect the Automobile price data (Raw) dataset to the Select Columns in Dataset component. Drag from the dataset's output port, which is the small circle at the bottom of the dataset on the canvas, to the input port of Select Columns in Dataset, which is the small circle at the top of the component.
Tip
You create a flow of data through your pipeline when you connect the output port of one component to an input port of another.
Select the Select Columns in Dataset component.
Select the arrow icon under Pipeline interface to the right of the canvas to open the component details pane. Alternatively, you can double-click the Select Columns in Dataset component to open the details pane.
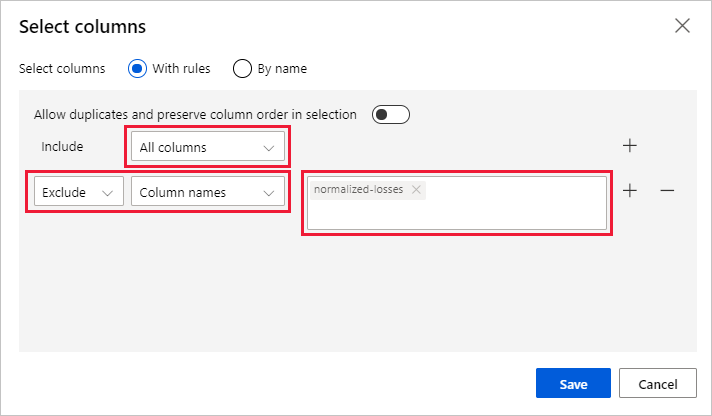
Select Edit column to the right of the pane.
Expand the Column names drop down next to Include, and select All columns.
Select the + to add a new rule.
From the drop-down menus, select Exclude and Column names.
Enter normalized-losses in the text box.
In the lower right, select Save to close the column selector.
In the Select Columns in Dataset component details pane, expand Node information.
Select the Comment text box and enter Exclude normalized losses.
Comments appear on the graph to help you organize your pipeline.
Clean missing data
Your dataset still has missing values after you remove the normalized-losses column. You can remove the remaining missing data by using the Clean Missing Data component.
Tip
Cleaning the missing values from input data is a prerequisite for using most of the components in the designer.
In the datasets and component palette to the left of the canvas, select Component and search for the Clean Missing Data component.
Drag the Clean Missing Data component to the pipeline canvas. Connect it to the Select Columns in Dataset component.
Select the Clean Missing Data component.
Select the arrow icon under Pipeline interface to the right of the canvas to open the component details pane. Alternatively, you can double-click the Clean Missing Data component to open the details pane.
Select Edit column to the right of the pane.
In the Columns to be cleaned window that appears, expand the drop-down menu next to Include. Select All columns.
Select Save.
In the Clean Missing Data component details pane, under Cleaning mode, select Remove entire row.
In the Clean Missing Data component details pane, expand Node information.
Select the Comment text box and enter Remove missing value rows.
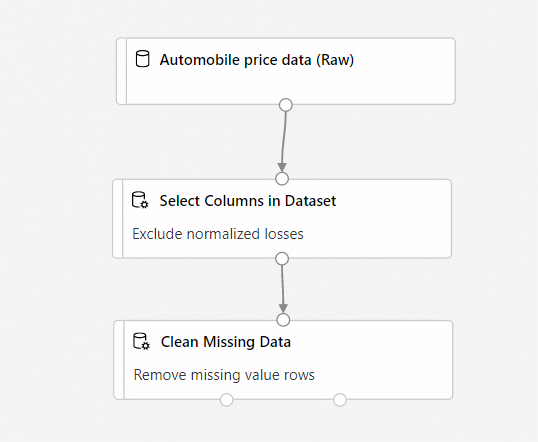
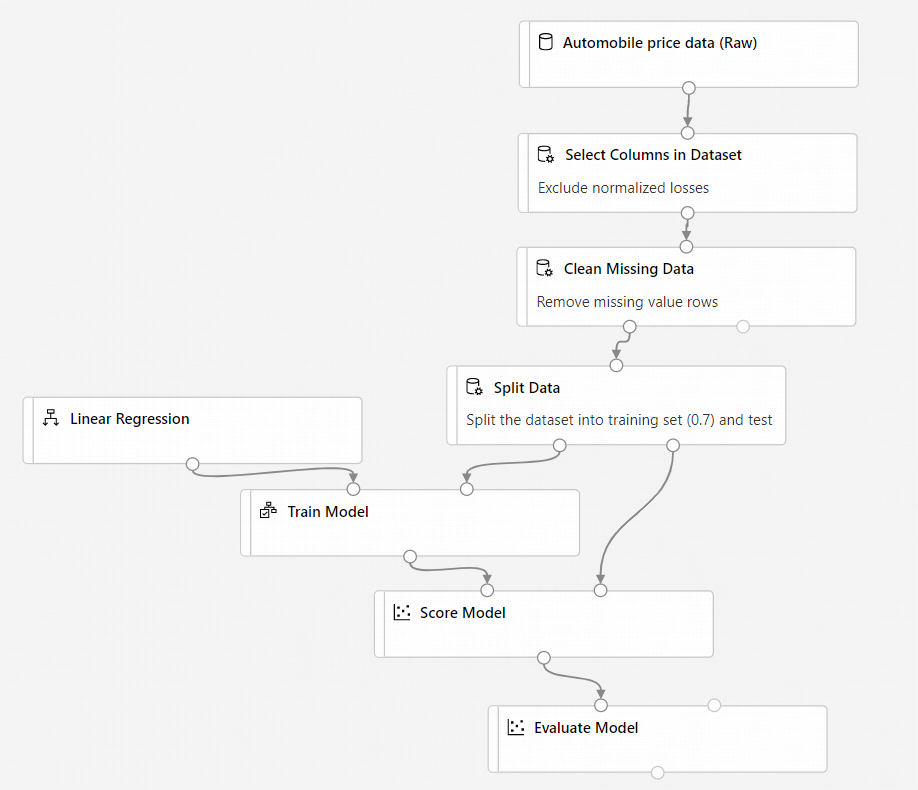
Your pipeline should now look something like this:
Train a machine learning model
Now that you have the components in place to process the data, you can set up the training components.
Because you want to predict price, which is a number, you can use a regression algorithm. For this example, you use a linear regression model.
Split the data
Splitting data is a common task in machine learning. You'll split your data into two separate datasets. One dataset trains the model and the other tests how well the model performed.
In the datasets and component palette to the left of the canvas, select Component and search for the Split Data component.
Drag the Split Data component to the pipeline canvas.
Connect the left port of the Clean Missing Data component to the Split Data component.
Important
Make sure that the left output port of Clean Missing Data connects to Split Data. The left port contains the cleaned data. The right port contains the discarded data.
Select the Split Data component.
Select the arrow icon under Pipeline interface to the right of the canvas to open the component details pane. Alternatively, you can double-click the Split Data component to open the details pane.
In the Split Data details pane, set the Fraction of rows in the first output dataset to 0.7.
This option splits 70 percent of the data to train the model and 30 percent for testing it. The 70 percent dataset is accessible through the left output port. The remaining data is available through the right output port.
In the Split Data details pane, expand Node information.
Select the Comment text box and enter Split the dataset into training set (0.7) and test set (0.3).
Train the model
Train the model by giving it a dataset that includes the price. The algorithm constructs a model that explains the relationship between the features and the price as presented by the training data.
In the datasets and component palette to the left of the canvas, select Component and search for the Linear Regression component.
Drag the Linear Regression component to the pipeline canvas.
In the datasets and component palette to the left of the canvas, select Component and search for the Train Model component.
Drag the Train Model component to the pipeline canvas.
Connect the output of the Linear Regression component to the left input of the Train Model component.
Connect the training data output (left port) of the Split Data component to the right input of the Train Model component.
Important
Make sure that the left output port of Split Data connects to Train Model. The left port contains the training set. The right port contains the test set.
Select the Train Model component.
Select the arrow icon under Pipeline settings to the right of the canvas to open the component details pane. Alternatively, you can double-click the Train Model component to open the details pane.
Select Edit column to the right of the pane.
In the Label column window that appears, expand the drop-down menu and select Column names.
In the text box, enter price to specify the value that your model is going to predict.
Important
Make sure you enter the column name exactly. Don't capitalize price.
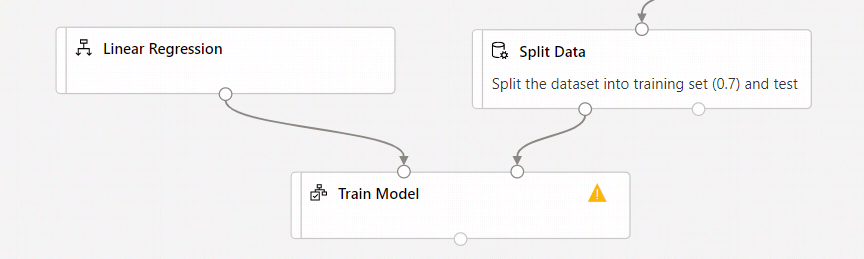
Your pipeline should look like this:

Add the Score Model component
After you train your model by using 70 percent of the data, you can use it to score the other 30 percent to see how well your model functions.
In the datasets and component palette to the left of the canvas, select Component and search for the Score Model component.
Drag the Score Model component to the pipeline canvas.
Connect the output of the Train Model component to the left input port of Score Model. Connect the test data output (right port) of the Split Data component to the right input port of Score Model.
Add the Evaluate Model component
Use the Evaluate Model component to evaluate how well your model scored the test dataset.
In the datasets and component palette to the left of the canvas, select Component and search for the Evaluate Model component.
Drag the Evaluate Model component to the pipeline canvas.
Connect the output of the Score Model component to the left input of Evaluate Model.
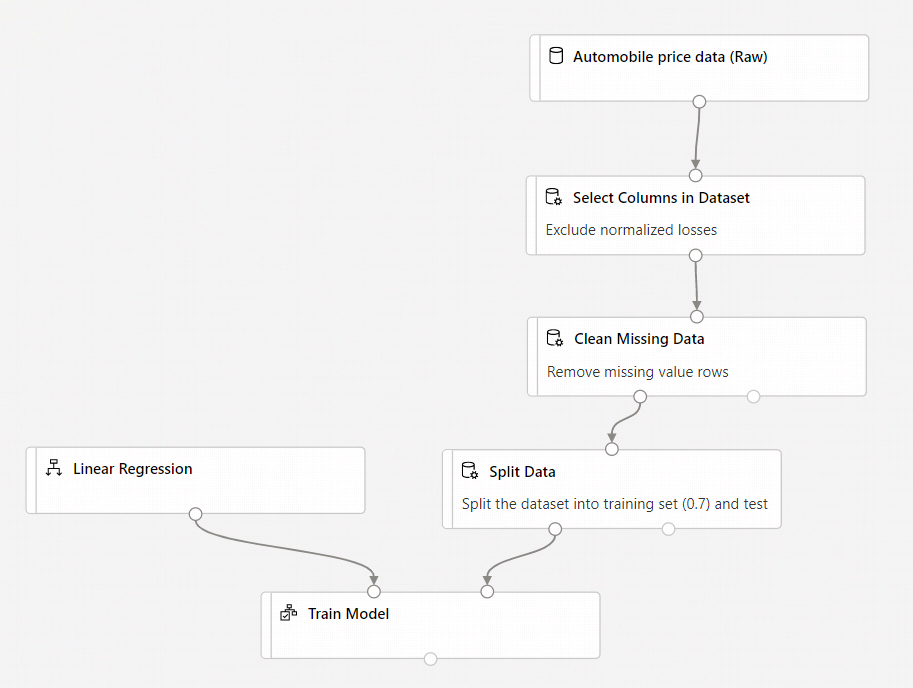
The final pipeline should look something like this:

Submit pipeline
Select Configure & Submit in the top corner to submit the pipeline.
After the step-by-step wizard appears, follow the wizard to submit the pipeline job.
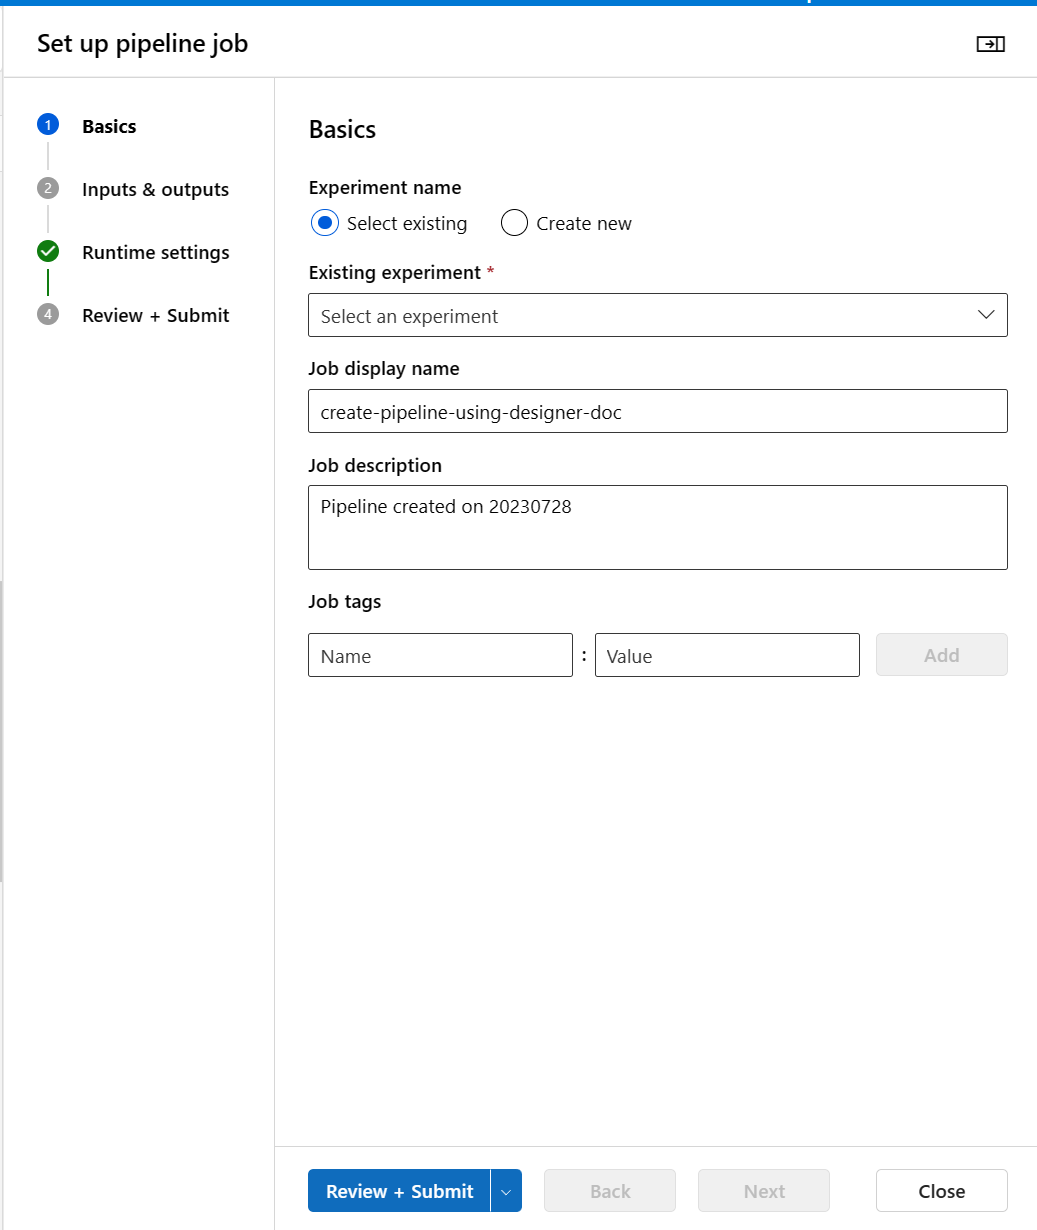
In Basics, you can configure the experiment, job display name, job description, etc.
In Inputs & Outputs, you can assign value to the inputs and outputs that are promoted to pipeline level. It's empty in this example because we didn't promote any input or output to pipeline level.
In Runtime settings, you can configure the default datastore and default compute to the pipeline. It's the default datastore and compute for all components in the pipeline. However, if you set a different compute or datastore for a component explicitly, the system respects the component-level setting. Otherwise, it uses the default.
The Review + Submit step is the last step to review all settings before submit. The wizard remembers your last configuration if you ever submit the pipeline.

After submitting the pipeline job, there is a message on the top with a link to the job detail. You can select this link to review the job details.

View scored labels
In the job detail page, you can check the pipeline job status, results, and logs.
After the job completes, you can view the results of the pipeline job. First, look at the predictions generated by the regression model.
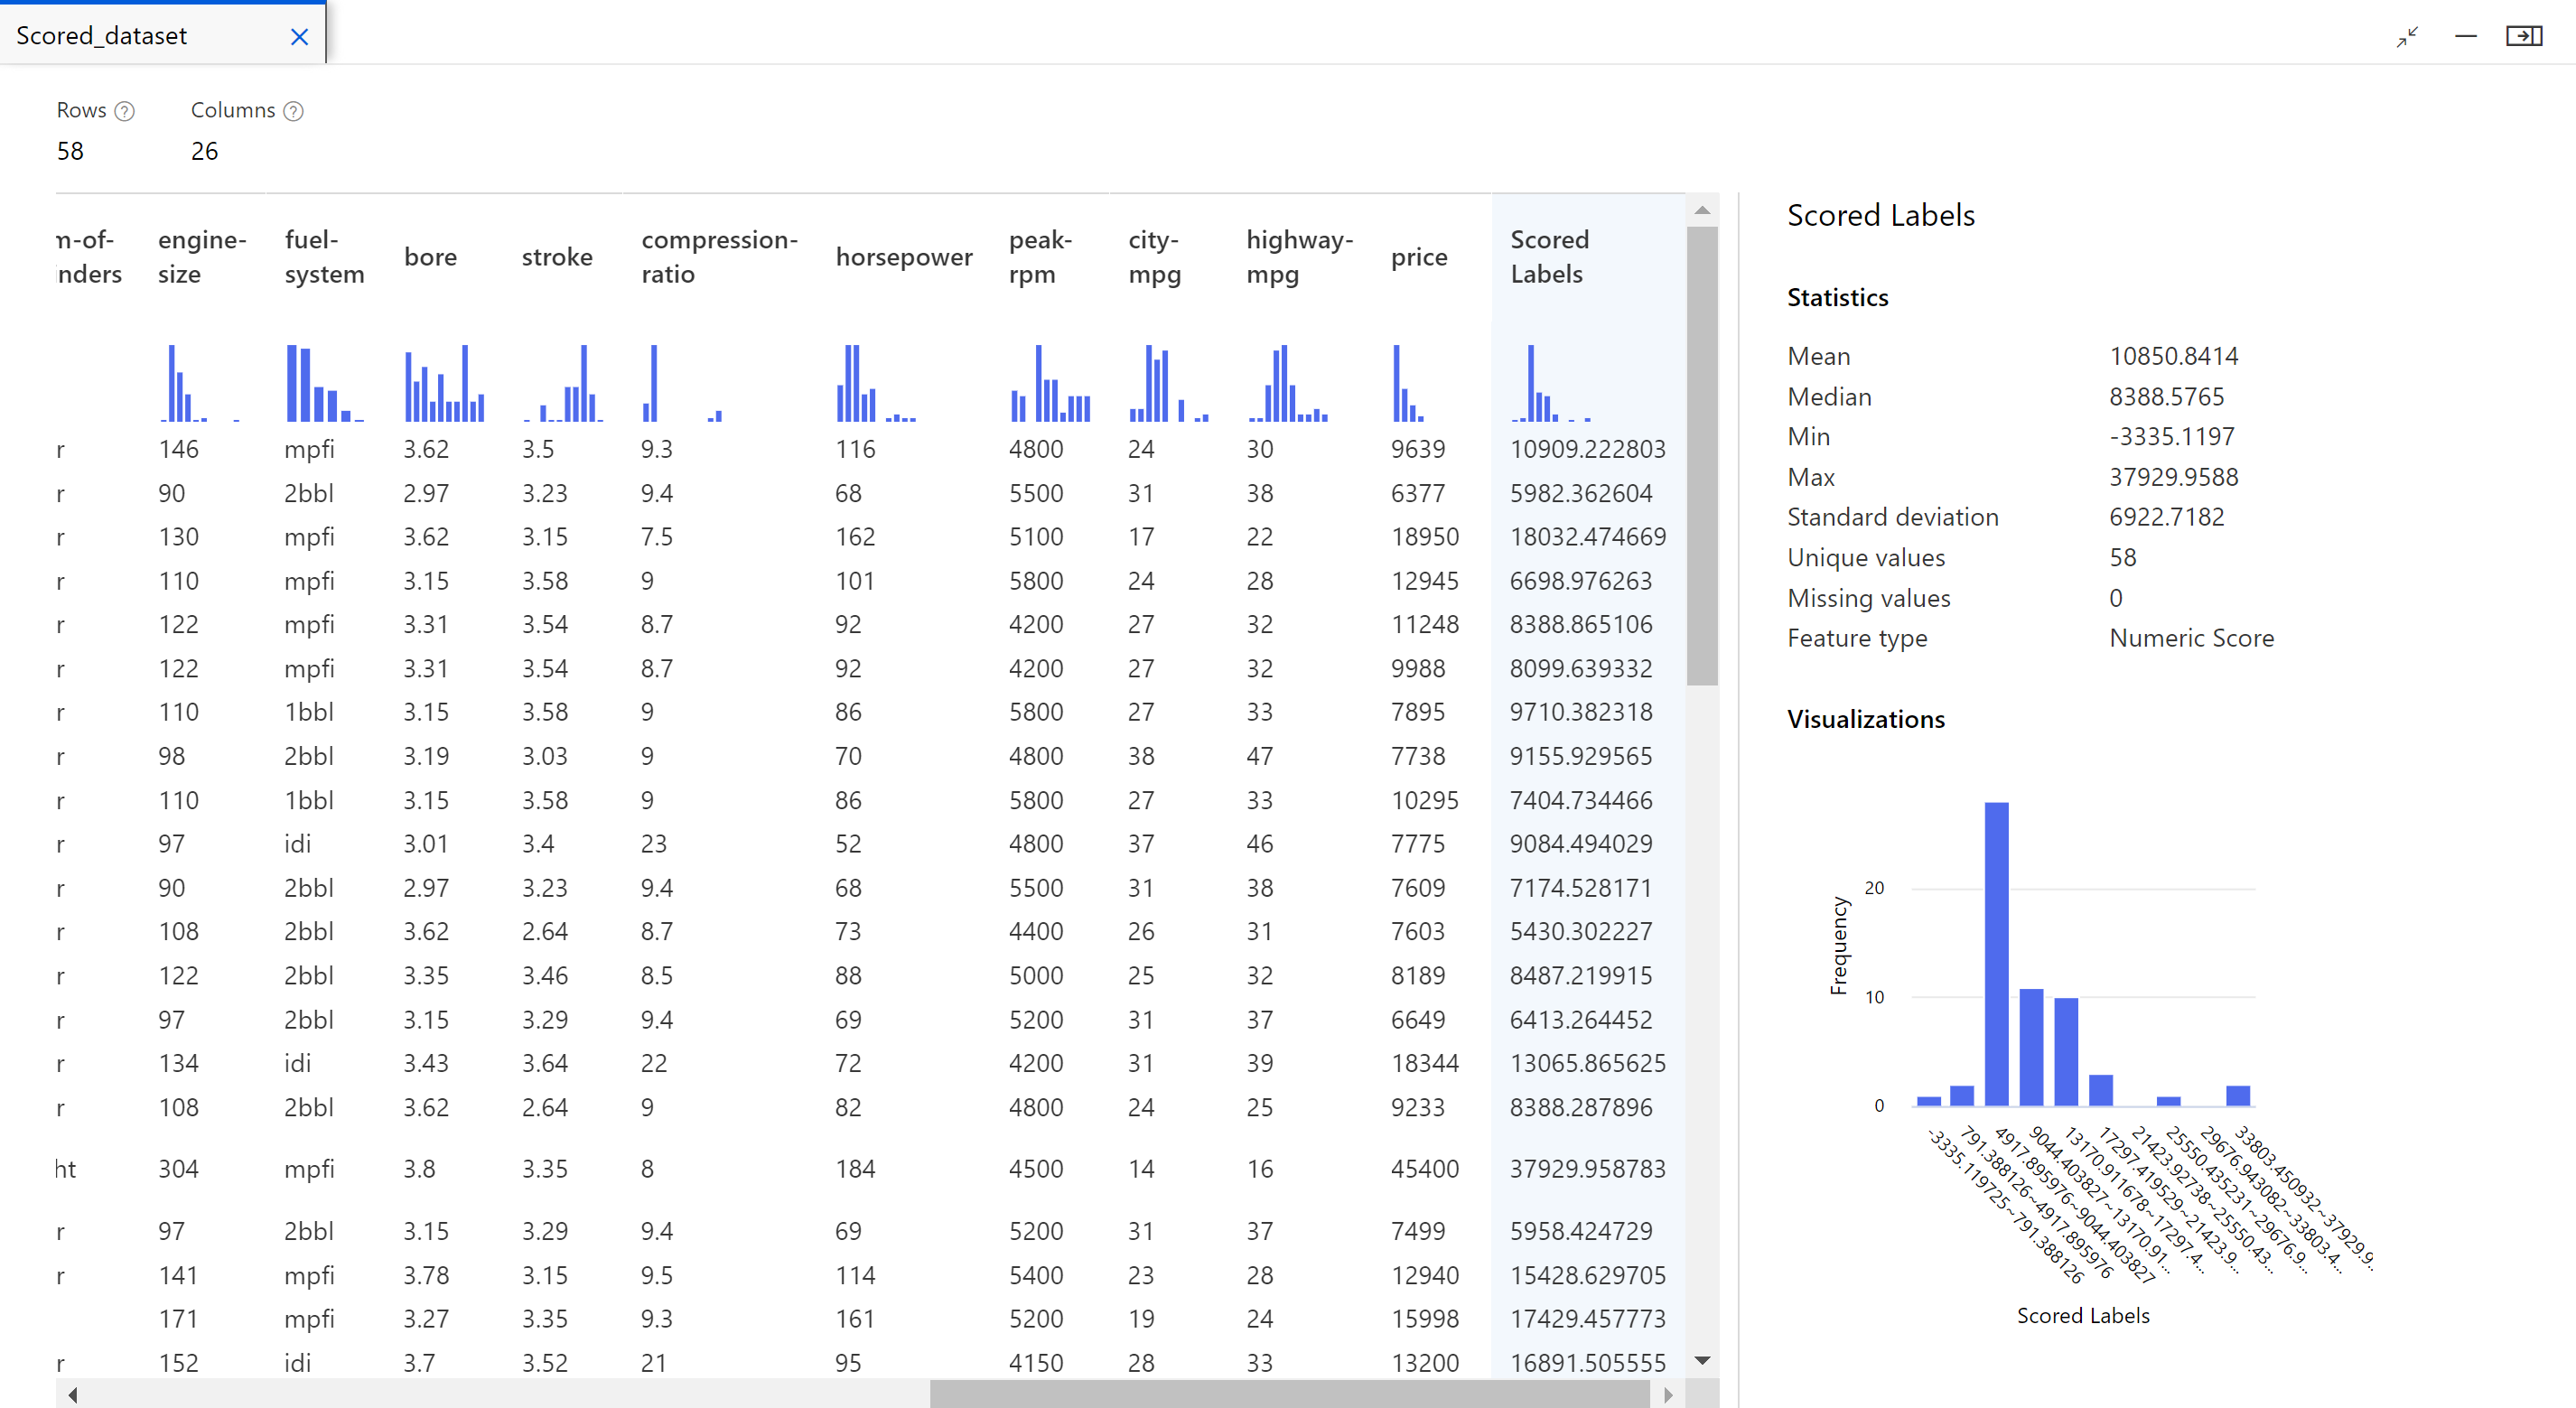
Right-click the Score Model component, and select Preview data > Scored dataset to view its output.
Here you can see the predicted prices and the actual prices from the testing data.

Evaluate models
Use the Evaluate Model to see how well the trained model performed on the test dataset.
- Right-click the Evaluate Model component and select Preview data > Evaluation results to view its output.
The following statistics are shown for your model:
- Mean Absolute Error (MAE): The average of absolute errors. An error is the difference between the predicted value and the actual value.
- Root Mean Squared Error (RMSE): The square root of the average of squared errors of predictions made on the test dataset.
- Relative Absolute Error: The average of absolute errors relative to the absolute difference between actual values and the average of all actual values.
- Relative Squared Error: The average of squared errors relative to the squared difference between the actual values and the average of all actual values.
- Coefficient of Determination: Also known as the R squared value, this statistical metric indicates how well a model fits the data.
For each of the error statistics, smaller is better. A smaller value indicates that the predictions are closer to the actual values. For the coefficient of determination, the closer its value is to one (1.0), the better the predictions.
Clean up resources
Skip this section if you want to continue on with part 2 of the tutorial, deploying models.
Important
You can use the resources that you created as prerequisites for other Azure Machine Learning tutorials and how-to articles.
Delete everything
If you don't plan to use anything that you created, delete the entire resource group so you don't incur any charges.
In the Azure portal, select Resource groups under Azure services.
Select the resource group that you created.
Select Delete resource group.
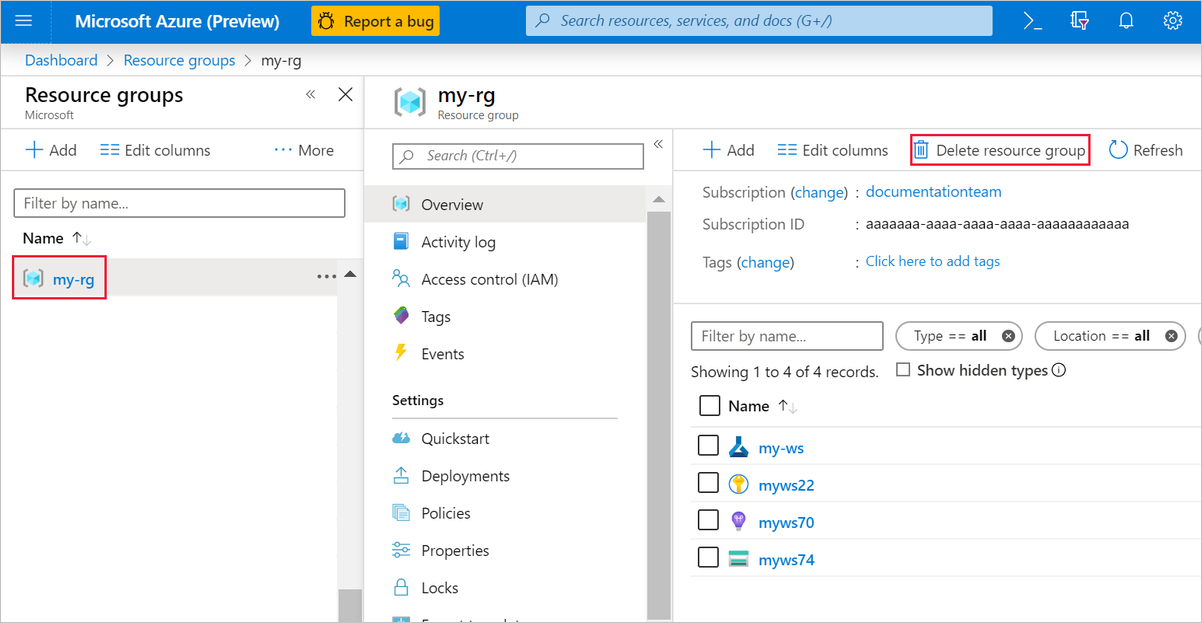
Deleting the resource group also deletes all resources that you created in the designer.
Delete individual assets
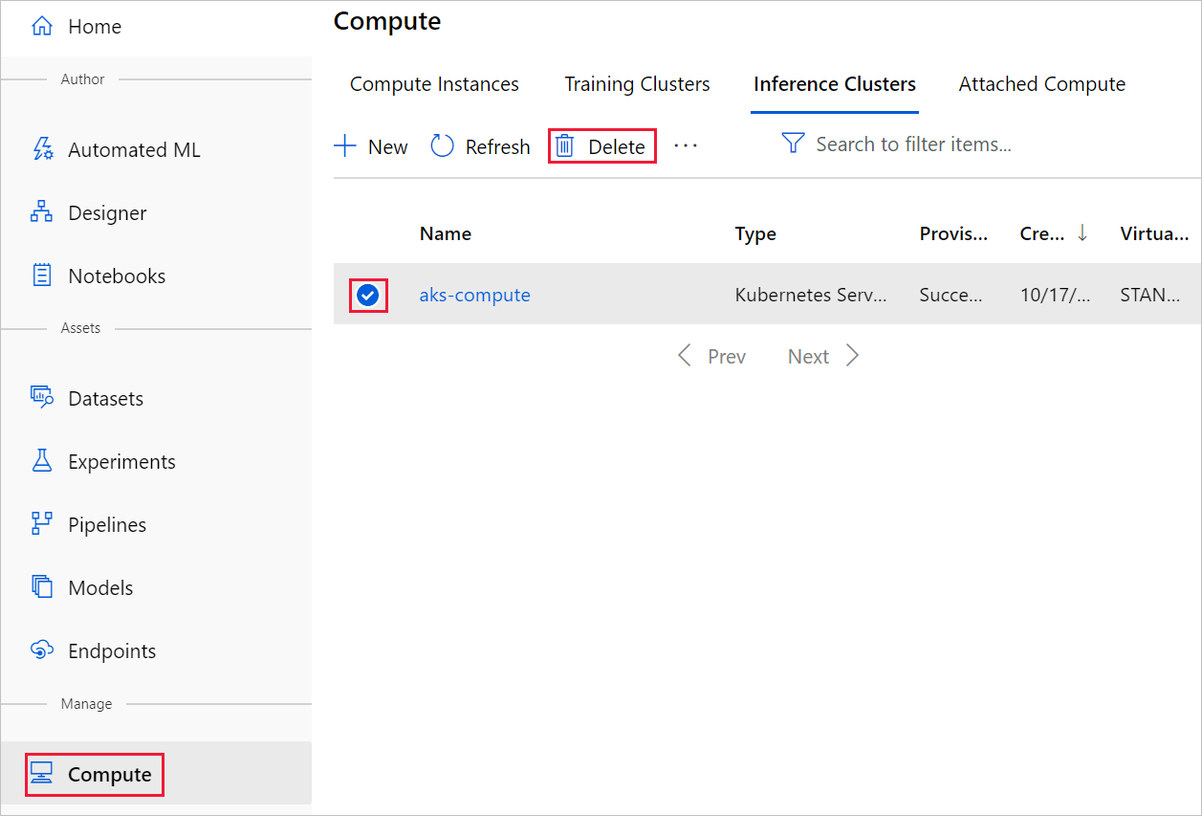
In the designer where you created your experiment, delete individual assets by selecting them and then selecting the Delete button.
The compute target that you created here automatically autoscales to zero nodes when it's not being used. This action is taken to minimize charges. If you want to delete the compute target, take these steps:
To delete a dataset, go to the storage account by using the Azure portal or Azure Storage Explorer and manually delete those assets.
Next step
In part two, you'll learn how to deploy your model as a real-time endpoint.