Note
Access to this page requires authorization. You can try signing in or changing directories.
Access to this page requires authorization. You can try changing directories.
Starting June 15th, 2026, Azure Managed Grafana support for Grafana 11 will be retired. This guide provides information about the upcoming retirement of Grafana 11 and guides you through upgrading your Azure Managed Grafana workspace to Grafana 12 by June 15, 2026.
Workspaces still running Grafana version 11 after June 15, 2026, will be automatically upgraded to Grafana 12.
Prerequisites
- An Azure account with an active subscription. Create an account.
- An existing Azure Managed Grafana instance. Create one if you haven't already.
Check the version of your Grafana workspace
To find out if your Azure Managed Grafana workspace needs to be upgraded, check the version of Grafana your workspace is running.
In the Azure portal:
Open your Azure Managed Grafana workspace.
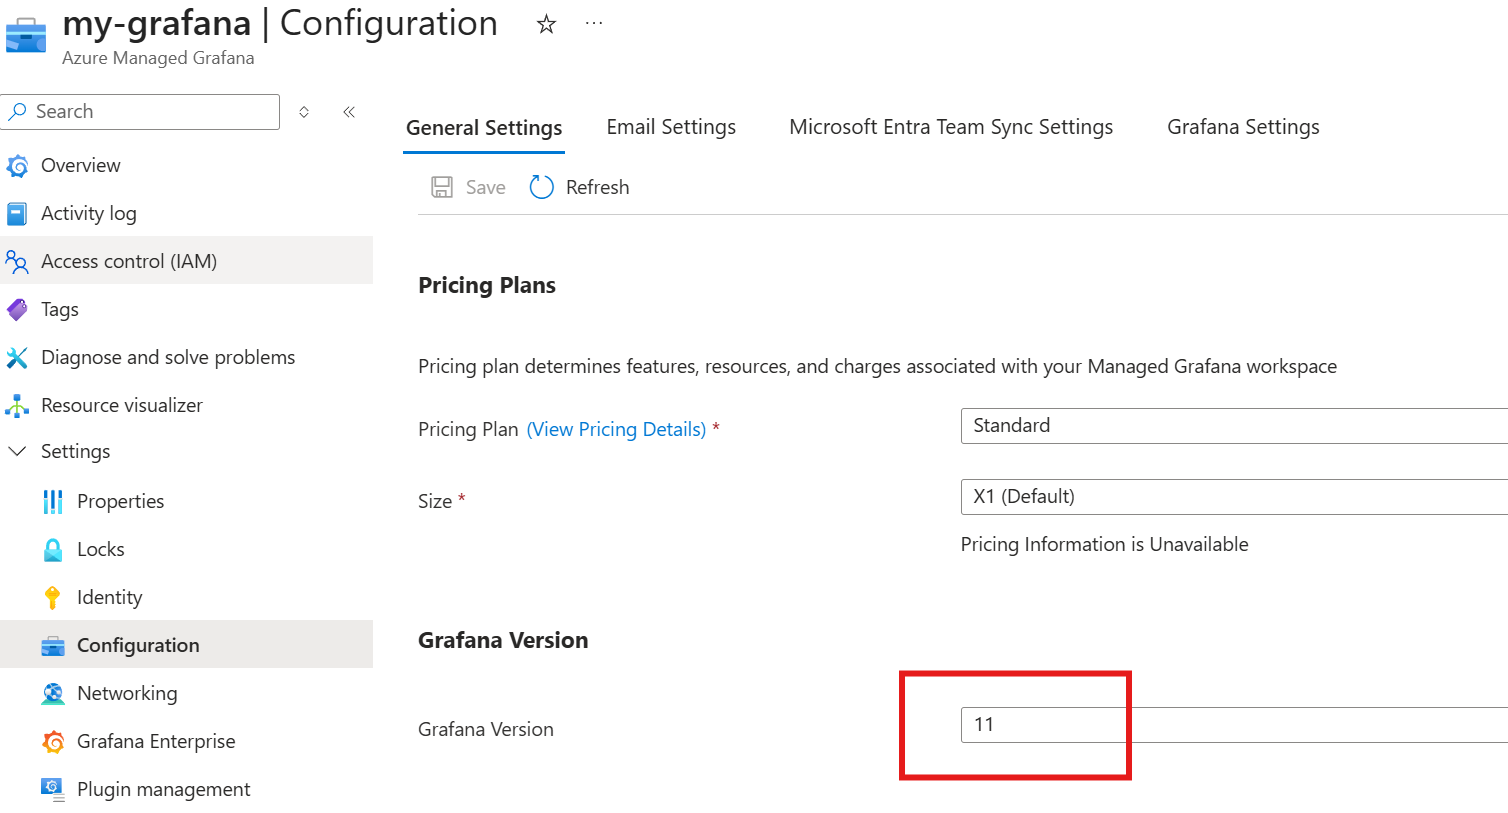
In the left menu, under Settings select Configuration.
Review the Grafana version listed under Grafana Version. If version 11 is selected in the dropdown menu, your workspace is on the Grafana version that is reaching end of life and is scheduled for retirement. We recommend that you upgrade your workspace to Grafana 12 by following the steps below. If your Grafana version is Grafana 12, no further action is necessary.
Upgrade to Grafana 12
Upgrade from Grafana 11 to Grafana 12 by following the steps below.
Important
Grafana 12 includes significant breaking changes. Make sure to review the What's new in Grafana v12.0 article thoroughly before upgrading your workspace.
Caution
Upgrading to Grafana 12 is irreversible.
In the Azure portal:
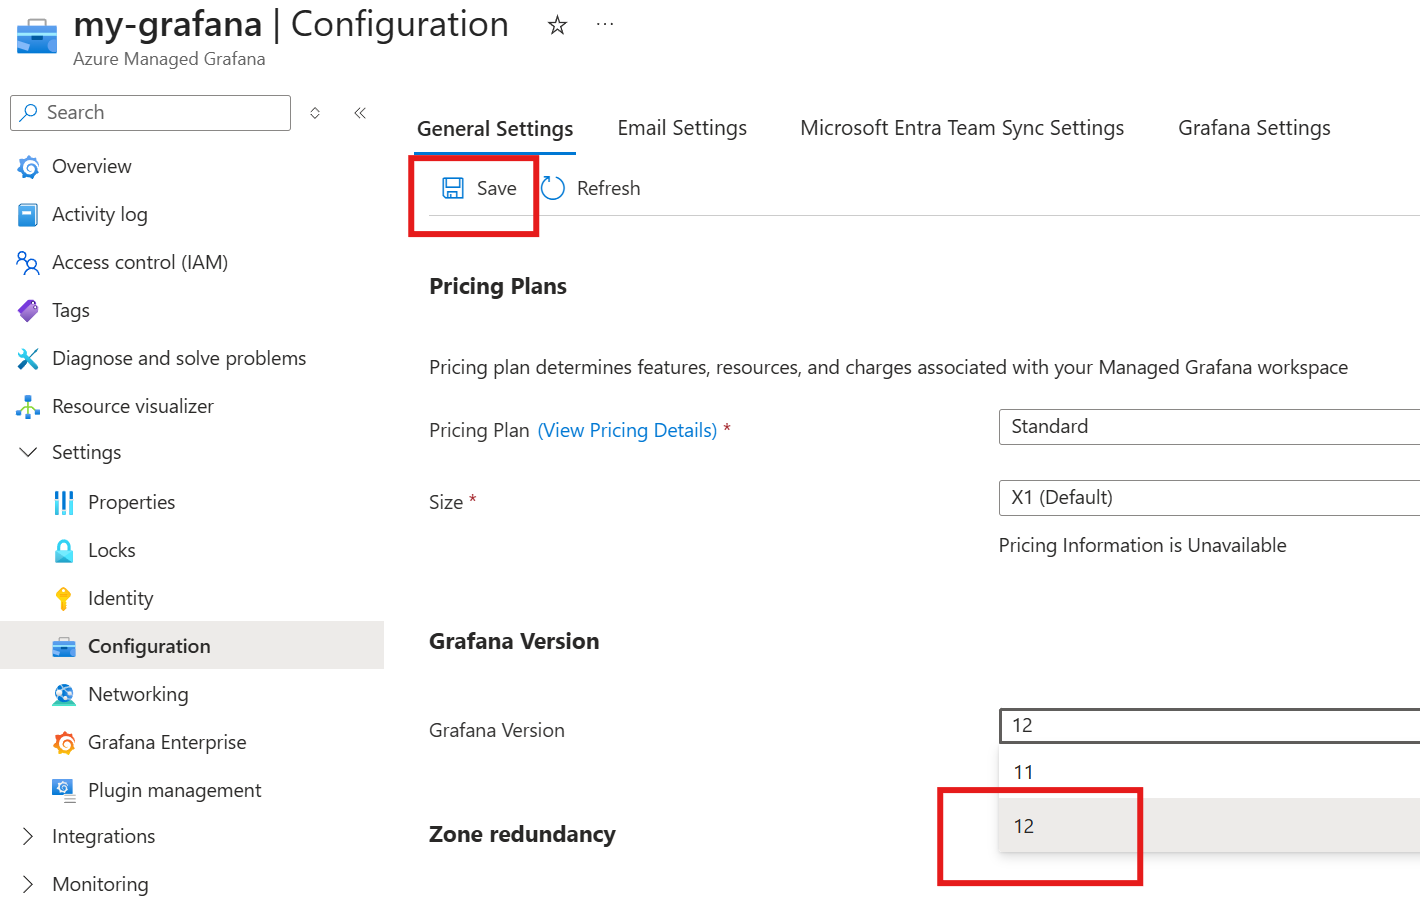
Once you have reviewed the breaking changes in Grafana 12 and are ready to proceed with the upgrade, open your workspace and select Settings > Configuration from the left menu.
Under Grafana Version, select 12.
Select Save on top to save the new settings and trigger the upgrade to Grafana version 12.
A notification appears, indicating that the upgrade is in progress. In the Overview page, Grafana’s Provisioning State is Provisioning until the upgrade is complete. After a few minutes, a notification appears, and the provisioning state becomes Succeeded.
Restore the Metrics drilldown
In Grafana 11, the Drilldown > Metrics menu is available out of the box, without installing a plugin. Grafana 12 introduces a by-design breaking change: the Metrics drilldown is now delivered by the grafana-metricsdrilldown-app plugin, which isn't installed by default. After you upgrade to Grafana 12, the Metrics entry under Drilldown is empty until you install this plugin.
If you use the Metrics drilldown and want to keep it after upgrading, install the plugin from your workspace:
- Open your Azure Managed Grafana workspace in the Azure portal.
- Select Plugin management.
- Check the box for the Grafana Metrics Drilldown plugin.
- Select Save, and then select Yes to confirm.
For more information, see How to manage Grafana plugins.
After you install the plugin, reload Grafana and confirm that Drilldown > Metrics is available.
Note
When you use the Metrics drilldown with an Azure Monitor managed service for Prometheus data source, you must select a single metric before you can filter by labels. Filtering by labels before you select a metric isn't supported and can cause plugin errors.