Note
Access to this page requires authorization. You can try signing in or changing directories.
Access to this page requires authorization. You can try changing directories.
Debug a local Service Fabric application
Important
Remote debugging is not supported on VS 2022
You can save time and money by deploying and debugging your Azure Service Fabric application in a local computer development cluster. Visual Studio 2019 or 2015 can deploy the application to the local cluster and automatically connect the debugger to all instances of your application. Visual Studio must be run as Administrator to connect the debugger.
Start a local development cluster by following the steps in Setting up your Service Fabric development environment.
Press F5 or click Debug > Start Debugging.
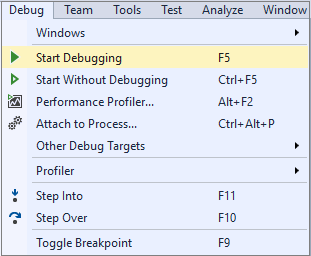
Set breakpoints in your code and step through the application by clicking commands in the Debug menu.
Note
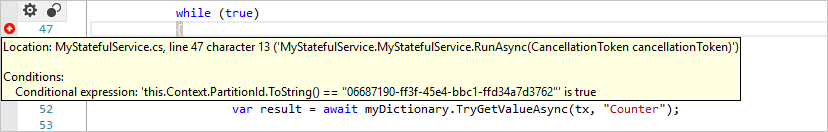
Visual Studio attaches to all instances of your application. While you're stepping through code, breakpoints may get hit by multiple processes resulting in concurrent sessions. Try disabling the breakpoints after they're hit, by making each breakpoint conditional on the thread ID or by using diagnostic events.
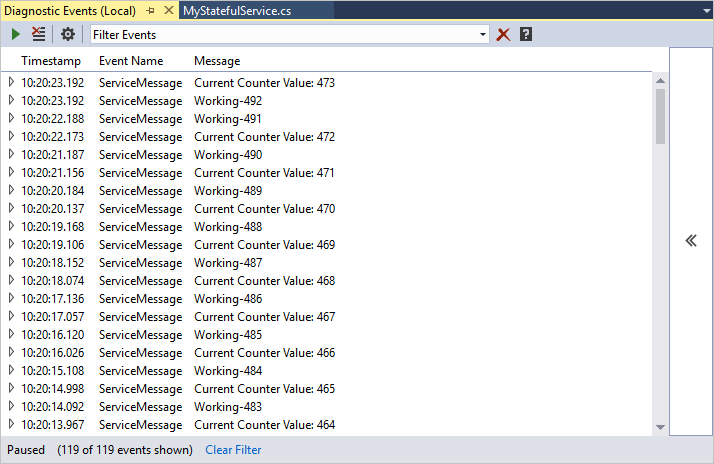
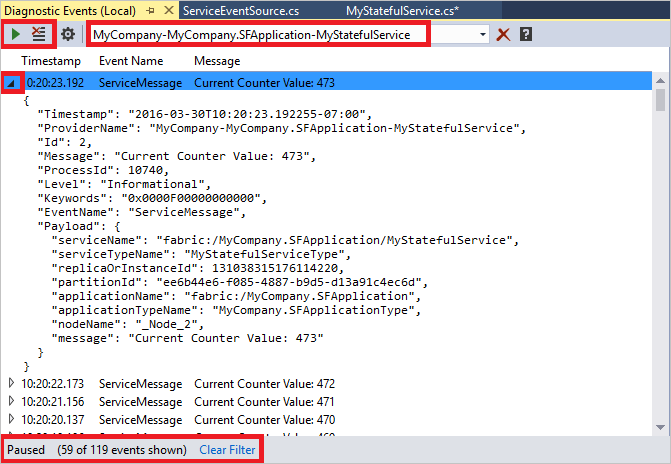
The Diagnostic Events window will automatically open so you can view diagnostic events in real time.
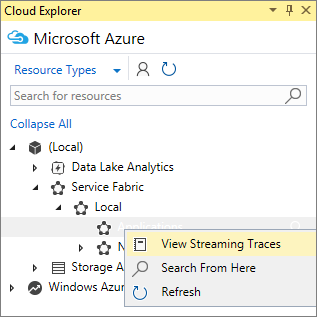
You can also open the Diagnostic Events window in Cloud Explorer. Under Service Fabric, right-click any node and choose View Streaming Traces.
If you want to filter your traces to a specific service or application, enable streaming traces on that specific service or application.
The diagnostic events can be seen in the automatically generated ServiceEventSource.cs file and are called from application code.
ServiceEventSource.Current.ServiceMessage(this, "My ServiceMessage with a parameter {0}", result.Value.ToString());The Diagnostic Events window supports filtering, pausing, and inspecting events in real time. The filter is a simple string search of the event message, including its contents.
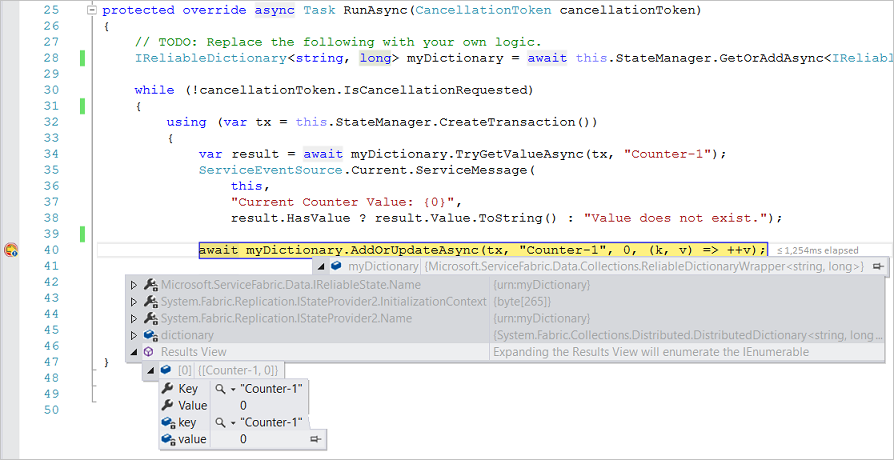
Debugging services is like debugging any other application. You'll normally set Breakpoints through Visual Studio for easy debugging. Even though Reliable Collections replicate across multiple nodes, they still implement IEnumerable. This implementation means that you can use the Results View in Visual Studio while you debug to see what you've stored inside. To do so, set a breakpoint anywhere in your code.
Running a script as part of debugging
In certain scenarios you might need to run a script as part of starting a debugging session (e.g. when not using Default Services).
In Visual Studio, you can add a file called Start-Service.ps1 in the Scripts folder of the Service Fabric Application project (.sfproj). This script will be invoked after the application has been created in the local cluster.
Debug a remote Service Fabric application
If your Service Fabric applications are running on a Service Fabric cluster in Azure, you can remotely debug these applications, directly from Visual Studio.
Note
The feature requires Service Fabric SDK 2.0 and Azure SDK for .NET 2.9.
Warning
Remote debugging is meant for dev/test scenarios and not to be used in production environments, because of the impact on the running applications.
Navigate to your cluster in Cloud Explorer. Right-click and choose Enable Debugging
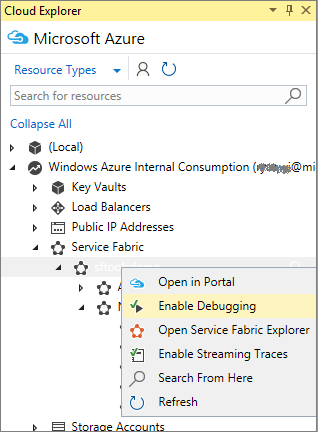
This action will kick off the process of enabling the remote debugging extension on your cluster nodes and required network configurations.
Right-click the cluster node in Cloud Explorer, and choose Attach Debugger
In the Attach to process dialog, choose the process you want to debug, and click Attach
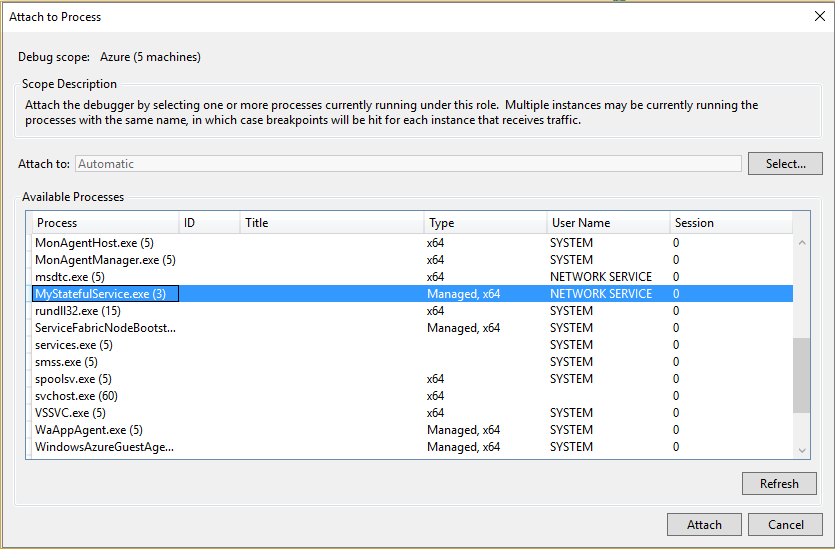
The name of the process you want to attach to, equals the name of your service project assembly name.
The debugger will attach to all nodes running the process.
In the case where you're debugging a stateless service, all instances of the service on all nodes are part of the debug session.
If you're debugging a stateful service, only the primary replica of any partition will be active and therefore caught by the debugger. If the primary replica moves during the debug session, the processing of that replica will still be part of the debug session.
To only catch relevant partitions or instances of a given service, you can use conditional breakpoints to only break a specific partition or instance.
Note
Currently we do not support debugging a Service Fabric cluster with multiple instances of the same service executable name.
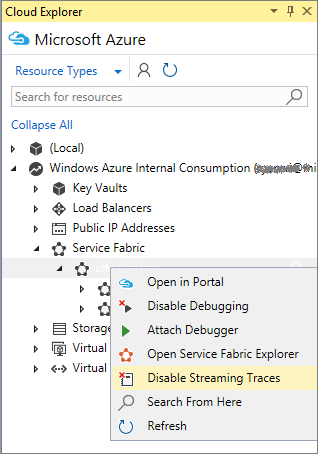
Once you finish debugging your application, you can disable the remote debugging extension by right-clicking the cluster in Cloud Explorer and choose Disable Debugging
Streaming traces from a remote cluster node
You're also able to stream traces directly from a remote cluster node to Visual Studio. This feature allows you to stream ETW trace events, produced on a Service Fabric cluster node.
Note
This feature requires Service Fabric SDK 2.0 and Azure SDK for .NET 2.9. This feature only supports clusters running in Azure.
Warning
Streaming traces is meant for dev/test scenarios and not to be used in production environments, because of the impact on the running applications. In a production scenario, you should rely on forwarding events using Azure Diagnostics.
Navigate to your cluster in Cloud Explorer. Right-click and choose Enable Streaming Traces
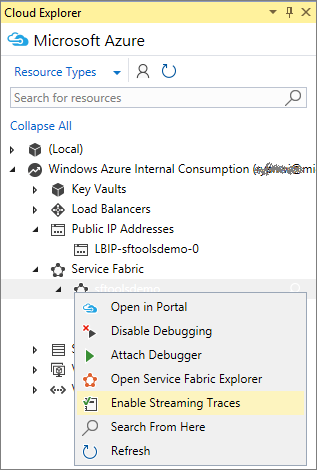
This action will kick off the process of enabling the streaming traces extension on your cluster nodes, as well as required network configurations.
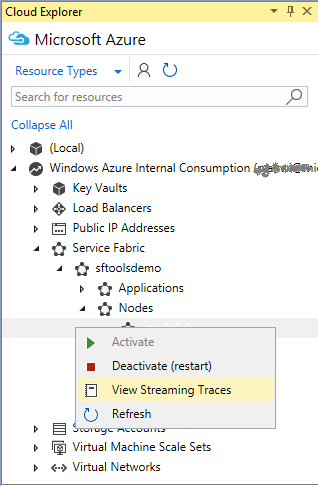
Expand the Nodes element in Cloud Explorer, right-click the node you want to stream traces from and choose View Streaming Traces
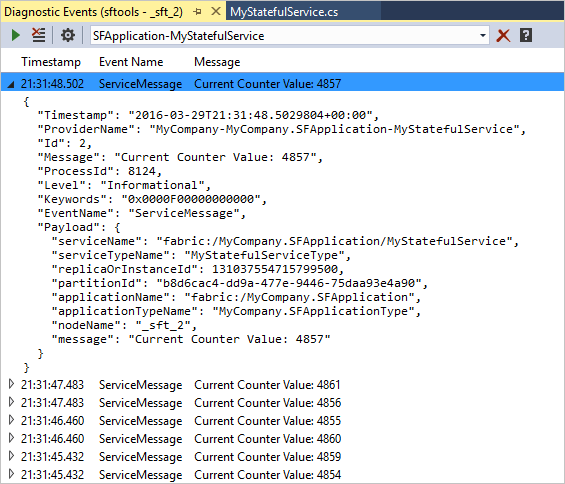
Repeat step 2 for as many nodes as you want to see traces from. Each nodes stream will show up in a dedicated window.
You are now able to see the traces emitted by Service Fabric, and your services. If you want to filter the events to only show a specific application, simply type in the name of the application in the filter.
Once you are done streaming traces from your cluster, you can disable remote streaming traces, by right-clicking the cluster in Cloud Explorer and choose Disable Streaming Traces