Note
Access to this page requires authorization. You can try signing in or changing directories.
Access to this page requires authorization. You can try changing directories.
Azure Monitor logs is our recommendation to monitor cluster level events. You can set up Log Analytics workspace through Azure Resource Manager, PowerShell, or Azure Marketplace. If you maintain an updated Resource Manager template of your deployment for future use, use the same template to set up your Azure Monitor logs environment. Deployment via Marketplace is easier if you already have a cluster deployed with diagnostics enabled. If you don't have subscription-level access in the account to which you're deploying, deploy by using PowerShell or the Resource Manager template.
Note
To set up Azure Monitor logs to monitor your cluster, you need to have diagnostics enabled to view cluster-level or platform-level events. Refer to how to set up diagnostics in Windows clusters and how to set up diagnostics in Linux clusters for more.
Note
We recommend that you use the Azure Az PowerShell module to interact with Azure. To get started, see Install Azure PowerShell. To learn how to migrate to the Az PowerShell module, see Migrate Azure PowerShell from AzureRM to Az.
Deploy a Log Analytics workspace by using Azure Marketplace
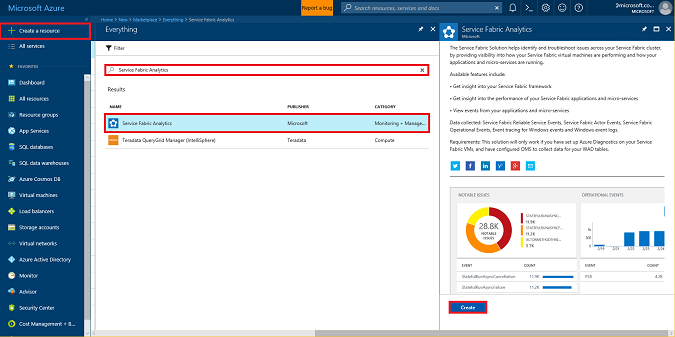
If you want to add a Log Analytics workspace after you have deployed a cluster, go to Azure Marketplace in the portal and look for Service Fabric Analytics. This is a custom solution for Service Fabric deployments that has data specific to Service Fabric. In this process, you create both the solution (the dashboard to view insights) and workspace (the aggregation of the underlying cluster data).
Select New on the left navigation menu.
Search for Service Fabric Analytics. Select the resource that appears.
Select Create.

In the Service Fabric Analytics creation window, select Select a workspace for the OMS Workspace field, and then Create a new workspace. Fill out the required entries. The only requirement is that the subscription for the Service Fabric cluster and the workspace is the same. When your entries have been validated, your workspace starts to deploy. The deployment takes only a few minutes.
When finished, select Create again at the bottom of the Service Fabric Analytics creation window. Make sure that the new workspace shows up under OMS Workspace. This action adds the solution to the workspace you created.
If you're using Windows, continue with the following steps to connect Azure Monitor logs to the storage account where your cluster events are stored.
Note
The Service Fabric Analytics solution is only supported for Windows clusters. For Linux clusters, check out our article on how to set up Azure Monitor logs for Linux clusters.
Connect the Log Analytics workspace to your cluster
The workspace needs to be connected to the diagnostics data coming from your cluster. Go to the resource group in which you created the Service Fabric Analytics solution. Select ServiceFabric<nameOfWorkspace> and go to its overview page. From there, you can change solution settings, workspace settings, and access the Log Analytics workspace.
On the left navigation menu, select Overview tab, under Connect a Data Source Tab select Storage accounts logs.
On the Storage account logs page, select Add at the top to add your cluster's logs to the workspace.
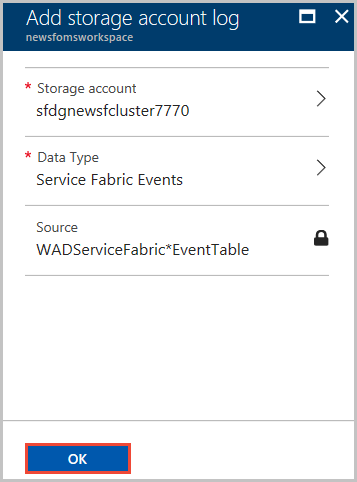
Select Storage account to add the appropriate account created in your cluster. If you used the default name, the storage account is sfdg<resourceGroupName>. You can also confirm this with the Azure Resource Manager template used to deploy your cluster, by checking the value used for applicationDiagnosticsStorageAccountName. If the name doesn't show up, scroll down and select Load more. Select the storage account name.
Specify the Data Type. Set it to Service Fabric Events.
Ensure that the Source is automatically set to WADServiceFabric*EventTable.
Select OK to connect your workspace to your cluster's logs.

The account now shows up as part of your storage account logs in your workspace's data sources.
You've added the Service Fabric Analytics solution in a Log Analytics workspace that's now correctly connected to your cluster's platform and application log table. You can add additional sources to the workspace in the same way.
Deploy Azure Monitor logs with Azure Resource Manager
When you deploy a cluster by using a Resource Manager template, the template creates a new Log Analytics workspace, adds the Service Fabric solution to the workspace, and configures it to read data from the appropriate storage tables.
You can use and modify this sample template to meet your requirements. This template does the following
- Creates a five-node Service Fabric cluster
- Creates a Log Analytics workspace and Service Fabric solution
- Configures the Log Analytics agent to collect and send two sample performance counters to the workspace
- Configures WAD to collect Service Fabric and sends them to Azure storage tables (WADServiceFabric*EventTable)
- Configures the Log Analytics workspace to read the events from these tables
You can deploy the template as a Resource Manager upgrade to your cluster by using the New-AzResourceGroupDeployment API in the Azure PowerShell module. An example command would be:
New-AzResourceGroupDeployment -ResourceGroupName "<resourceGroupName>" -TemplateFile "<templatefile>.json"
Azure Resource Manager detects that this command is an update to an existing resource. It only processes the changes between the template driving the existing deployment and the new template provided.
Deploy Azure Monitor logs with Azure PowerShell
You can also deploy your log analytics resource via PowerShell by using the New-AzOperationalInsightsWorkspace command. To use this method, make sure you have installed Azure PowerShell. Use this script to create a new Log Analytics workspace and add the Service Fabric solution to it:
$SubID = "<subscription ID>"
$ResourceGroup = "<Resource group name>"
$Location = "<Resource group location>"
$WorkspaceName = "<Log Analytics workspace name>"
$solution = "ServiceFabric"

# Sign in to Azure and access the correct subscription
Connect-AzAccount -Environment AzureChinaCloud
Select-AzSubscription -SubscriptionId $SubID

# Create the resource group if needed
try {
    Get-AzResourceGroup -Name $ResourceGroup -ErrorAction Stop
} catch {
    New-AzResourceGroup -Name $ResourceGroup -Location $Location
}

New-AzOperationalInsightsWorkspace -Location $Location -Name $WorkspaceName -Sku Standard -ResourceGroupName $ResourceGroup
Set-AzOperationalInsightsIntelligencePack -ResourceGroupName $ResourceGroup -WorkspaceName $WorkspaceName -IntelligencePackName $solution -Enabled $true
When you finish, follow the steps in the preceding section to connect Azure Monitor logs to the appropriate storage account.
You can also add other solutions or make other modifications to your Log Analytics workspace by using PowerShell. To learn more, see Manage Azure Monitor logs using PowerShell.
Next steps
- Deploy the Log Analytics agent onto your nodes to gather performance counters and collect docker stats and logs for your containers
- Get familiarized with the log search and querying features offered as part of Azure Monitor logs
- Use View Designer to create custom views in Azure Monitor logs