Note
Access to this page requires authorization. You can try signing in or changing directories.
Access to this page requires authorization. You can try changing directories.
There are two ways you can monitor your cloud tiering policy: the server endpoint properties blade and Azure Monitor.
Monitoring via server endpoint
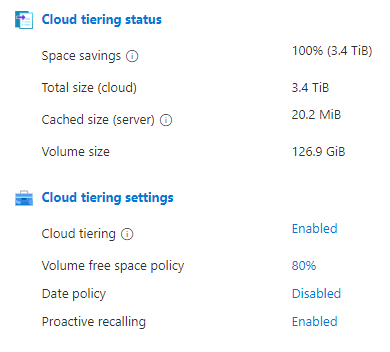
Sign in to the Azure portal and search for Storage Sync Services. Select the appropriate Storage Sync Service and Sync Group. Then select the server endpoint you'd like to monitor. Under Properties, you'll see the following.

Space savings is the amount of space saved by enabling cloud tiering. If your local volume size is large enough to hold all of your data, you will have 0% space savings. If you have 0% or a low percent of space savings, it could indicate that cloud tiering isn't beneficial with your current local cache size.
Total size (cloud) is the size of your files that were synced to the cloud.
Cached size (server) is the total size of files on your server, both downloaded and tiered. Sometimes, the cached size may be bigger than the total size of your files in the cloud. Variables such as the cluster size of the volume on the server can cause this. If cached size is larger than you want, consider increasing your volume free space policy.
Effective volume free space policy is used by Azure File Sync to determine how much free space to leave on the volume your server endpoint is on. When there are multiple server endpoints on the same volume, the highest volume free space policy amongst the server endpoints becomes the effective volume policy for all the server endpoints on that volume. For example, if there are two server endpoints on the same volume, one with 30% volume free space and another with 50% volume free space, the effective volume free space policy for both server endpoints will be 50%. To view the effective free space policy for a volume, select the percentage listed under Cloud tiering settings > Volume free space policy.
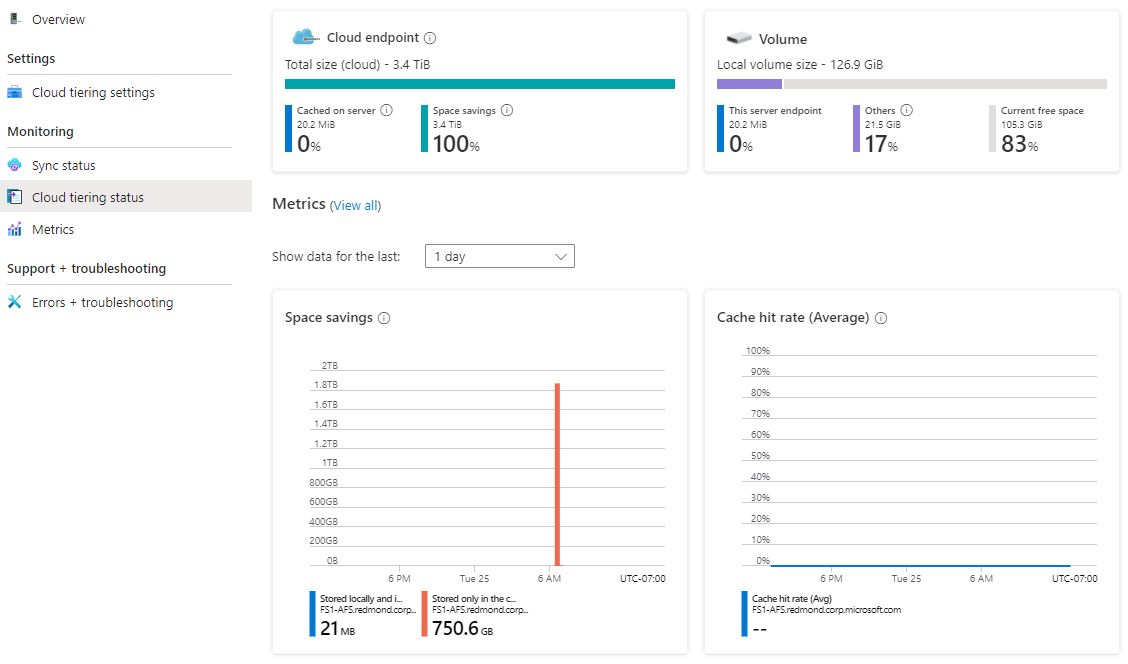
You can drill down further by selecting Monitoring > Cloud tiering status.

Current free space is the volume free space currently available on your on-premises server. If you have high egress but more volume free space available before your volume free space policy kicks in, consider disabling your date policy. Another issue might be that out of the currently tiered files, the most recently accessed file is larger than your volume free space remaining before the policy kicks in. In this case, consider increasing your local volume size.
Cache hit rate is the percentage of files that you open in your local cache. The cache hit rate is calculated by files opened directly from cache/total number of files open. A cache hit rate of 100% means that all the files that you opened in the last hour were already in your local cache. If your goal is to reduce egress, this would indicate that your current policy is working well.
Note
Workloads with random access patterns typically have lower cache hit rates.
Monitoring via Azure Monitor
Go to the Storage Sync Service and select Metrics on the side navigation.
There are nine different metrics you can use to monitor cloud tiering:
- Cache data size by last access time
- This is the total size of data, in bytes, categorized by the time it was last accessed.
- Cloud Tiering Cache Hit Rate
- This is the percentage of data (in bytes) served directly from the cache and can be used to reflect the efficiency of caching.
- Cloud Tiering Low Disk Space Mode
- This is a boolean value that indicates whether a server is in low disk space mode (1 = yes and 0 = no).
- Cloud Tiering Recall Size
- This is the total size of the data recalled in bytes and can be used to identify how much data is being recalled.
- Cloud Tiering Recall Size By Application
- This is the total size of data recalled in bytes by an application and can be used to identify what's recalling the data.
- Cloud Tiering Recall Success Rate
- This is the percentage of successful data recall operations and indicates how reliably data is being retrieved.
- Cloud Tiering Recall Throughput
- This measures how quickly the data is being recalled in bytes and should be used if you have concerns about performance.
- Cloud Tiering Size of Data Tiered
- This measures the total size of data tiered to Azure File share, in bytes, and can be used to track tiering activity over time.
- Cloud Tiering Size of Data Tiered by last maintenance job
- This measures the total size of data tiered to Azure File share, in bytes, during the most recent maintenance job and is useful for diagnosing emergency tiering events.
To be more specific on what you want your graphs to display, consider using Add Filter and Apply Splitting.
For details on the different types of metrics for Azure File Sync and how to use them, see Monitor Azure File Sync.
For details on how to use metrics, see Analyze metrics with Azure Monitor metrics explorer.
To change your cloud tiering policy, see Choose cloud tiering policies.