Note
Access to this page requires authorization. You can try signing in or changing directories.
Access to this page requires authorization. You can try changing directories.
When you have critical applications and business processes relying on Azure resources, you want to monitor those resources for their availability and performance.
This article describes the monitoring data generated by Azure Virtual WAN. Virtual WAN uses Azure Monitor. If you're unfamiliar with the features of Azure Monitor common to all Azure services that use it, read Monitoring Azure resources with Azure Monitor.
Prerequisites
You have a virtual WAN deployed and configured. For help with deploying a virtual WAN:
- Creating a site-to-site connection
- Creating a User VPN (point-to-site) connection
- Creating an ExpressRoute connection
- Installing Azure Firewall in a Virtual hub
Analyzing metrics
Metrics in Azure Monitor are numerical values that describe some aspect of a system at a particular time. Metrics are collected every minute, and are useful for alerting because they can be sampled frequently. An alert can be fired quickly with relatively simple logic.
For a list of the platform metrics collected for Virtual WAN, see Monitoring Virtual WAN data reference metrics.
View metrics for Virtual WAN
The following steps help you locate and view metrics:
In the portal, navigate to the virtual hub.
Select VPN (Site to site) to locate a site-to-site gateway, ExpressRoute to locate an ExpressRoute gateway, or User VPN (Point to site) to locate a point-to-site gateway.
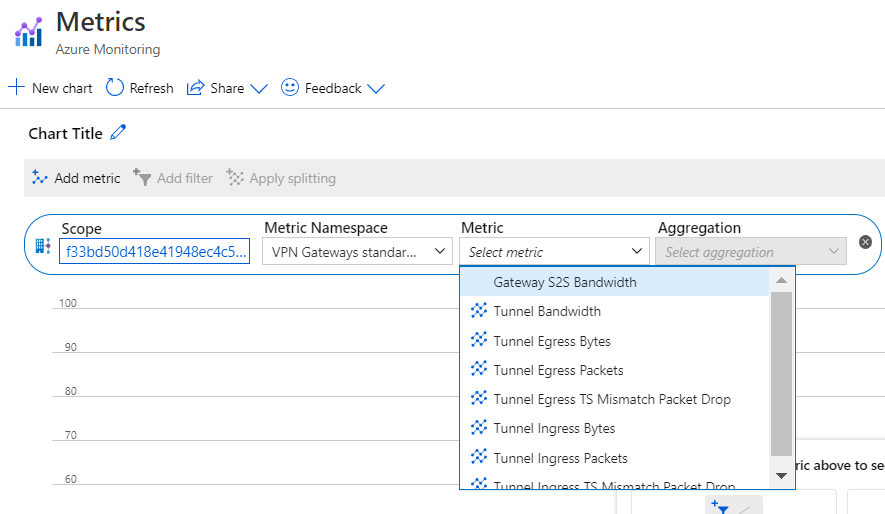
Select Metrics.

On the Metrics page, you can view the metrics that you're interested in.
To see metrics for the virtual hub router, you can select Metrics from the virtual hub Overview page.


PowerShell steps
You can view metrics for Virtual WAN by using PowerShell. To query, use the following example PowerShell commands.
$MetricInformation = Get-AzMetric -ResourceId "/subscriptions/<SubscriptionID>/resourceGroups/<ResourceGroupName>/providers/Microsoft.Network/VirtualHubs/<VirtualHubName>" -MetricName "VirtualHubDataProcessed" -TimeGrain 00:05:00 -StartTime 2022-2-20T01:00:00Z -EndTime 2022-2-20T01:30:00Z -AggregationType Sum

$MetricInformation.Data
- Resource ID. Your virtual hub's Resource ID can be found on the Azure portal. Navigate to the virtual hub page within vWAN and select JSON View under Essentials.
- Metric Name. Refers to the name of the metric you're querying, which in this case is called
VirtualHubDataProcessed. This metric shows all the data that the virtual hub router processed in the selected time period of the hub. - Time Grain. Refers to the frequency at which you want to see the aggregation. In the current command, you see a selected aggregated unit per 5 mins. You can select - 5M/15M/30M/1H/6H/12H and 1D.
- Start Time and End Time. This time is based on UTC. Ensure that you're entering UTC values when inputting these parameters. If these parameters aren't used, the past one hour's worth of data is shown by default.
- Sum Aggregation Type. The sum aggregation type shows you the total number of bytes that traversed the virtual hub router during a selected time period. For example, if you set the Time granularity to 5 minutes, each data point corresponds to the number of bytes sent in that five-minute interval. To convert this value to Gbps, you can divide this number by 37500000000. Based on the virtual hub's capacity, the hub router can support between 3 Gbps and 50 Gbps. The Max and Min aggregation types aren't meaningful at this time.
Analyzing logs
Data in Azure Monitor Logs is stored in tables where each table has its own set of unique properties. Resource Logs aren't collected and stored until you create a diagnostic setting and route them to one or more locations.
For a list of supported logs in Virtual WAN, see Monitoring Virtual WAN data reference logs. All resource logs in Azure Monitor have the same fields followed by service-specific fields. The common schema is outlined in Azure Monitor resource log schema.
Create diagnostic setting to view logs
The following steps help you create, edit, and view diagnostic settings:
In the portal, navigate to your Virtual WAN resource, then select Hubs in the Connectivity group.
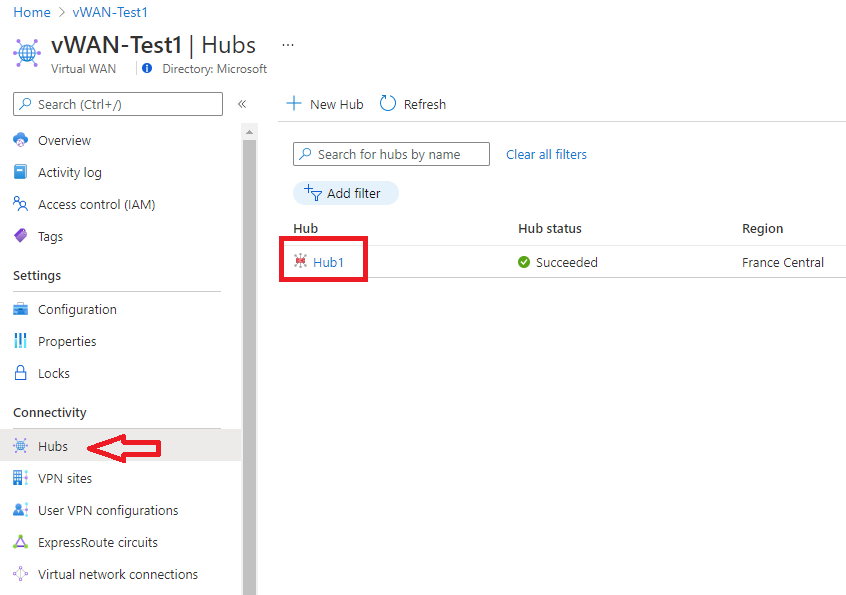
Under the Connectivity group on the left, select the gateway for which you want to examine diagnostics:
On the right part of the page, select Monitor Gateway and then Logs.
In this page, you can create a new diagnostic setting (+Add diagnostic setting) or edit an existing one (Edit setting). You can choose to send the diagnostic logs to Log Analytics (as shown in the following example), stream to an event hub, send to a 3rd-party solution, or archive to a storage account.
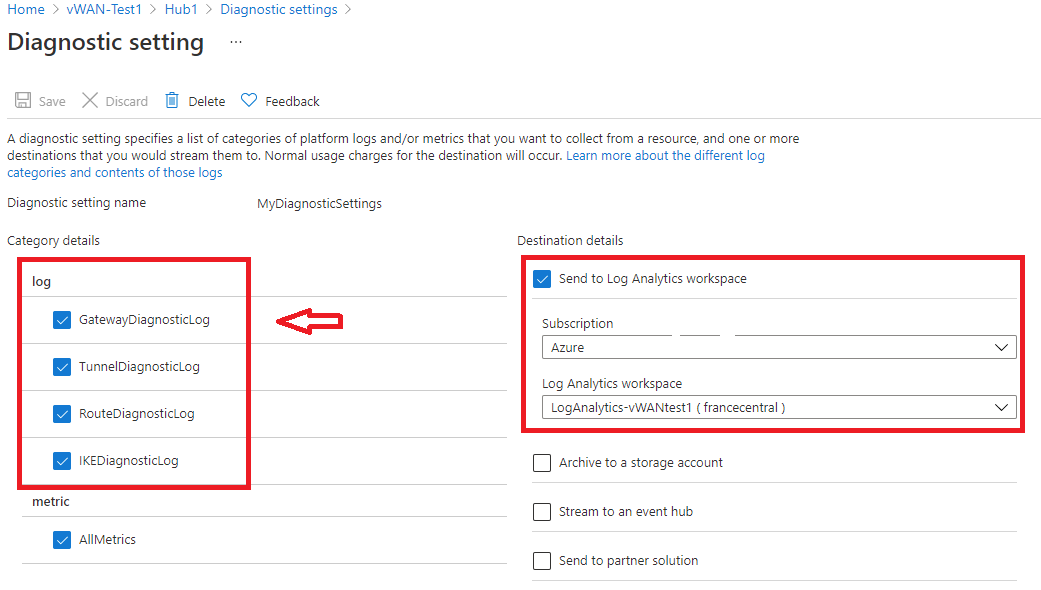
After clicking Save, you should start seeing logs appear in this log analytics workspace within a few hours.
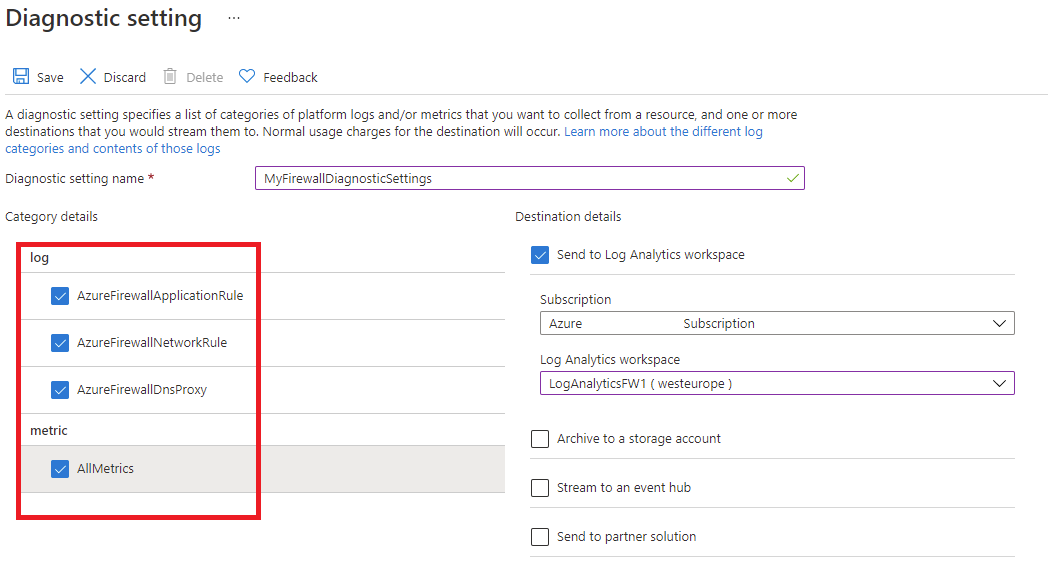
To monitor a secured hub (with Azure Firewall), then diagnostics and logging configuration must be done from accessing the Diagnostic Setting tab:


Important
Enabling these settings requires additional Azure services (storage account, event hub, or Log Analytics), which may increase your cost. To calculate an estimated cost, visit the Azure pricing calculator.
Alerts
Azure Monitor alerts proactively notify you when important conditions are found in your monitoring data. They allow you to identify and address issues in your system before your customers notice them. You can set alerts on metrics, logs, and the activity log. Different types of alerts have benefits and drawbacks.
Virtual WAN Insights
Some services in Azure have a special focused prebuilt monitoring dashboard in the Azure portal that provides a starting point for monitoring your service. These special dashboards are called "Insights".
Virtual WAN uses Network Insights to provide users and operators with the ability to view the state and status of a virtual WAN, presented via an autodiscovered topological map. Resource state and status overlays on the map give you a snapshot view of the overall health of the virtual WAN. You can navigate resources on the map via one-click access to the resource configuration pages of the Virtual WAN portal. For more information, see Azure Monitor Network Insights for Virtual WAN.
Related content
- See Azure Virtual WAN monitoring data reference for a reference of the metrics, logs, and other important values created for Virtual WAN.
- See Monitoring Azure resources with Azure Monitor for general details on monitoring Azure resources.