Ask Learn
Preview
Ask Learn is an AI assistant that can answer questions, clarify concepts, and define terms using trusted Microsoft documentation.
Please sign in to use Ask Learn.
Sign inThis browser is no longer supported.
Upgrade to Microsoft Edge to take advantage of the latest features, security updates, and technical support.
Note
Access to this page requires authorization. You can try signing in or changing directories.
Access to this page requires authorization. You can try changing directories.
The name URL ping test is a bit of a misnomer. These tests don't use the Internet Control Message Protocol (ICMP) to check your site's availability. Instead, they use more advanced HTTP request functionality to validate whether an endpoint is responding. They measure the performance associated with that response. They also add the ability to set custom success criteria, coupled with more advanced features like parsing dependent requests and allowing for retries.
To create an availability test, you need to use an existing Application Insights resource or create an Application Insights resource.
Important
On September 30th, 2026, URL ping tests will be retired. Transition to standard tests before then.
Note
URL ping tests are categorized as classic tests. You can find them under Add Classic Test on the Availability pane. For more advanced features, see Standard tests.
Important
URL ping test rely on the DNS infrastructure of the public internet to resolve the domain names of the tested endpoints. If you're using private DNS, you must ensure that the public domain name servers can resolve every domain name of your test. When that's not possible, you can use custom TrackAvailability tests instead.
To create your first availability request:
In your Application Insights resource, open the Availability pane and select Add Classic Test.

Name your test and select URL ping for SKU.
Enter the URL that you want to test.
Adjust the settings to your needs by using the following table. Select Create.
| Setting | Description |
|---|---|
| URL | The URL can be any webpage that you want to test, but it must be visible from the public internet. The URL can include a query string. For example, you can exercise your database a little. If the URL resolves to a redirect, you can follow it up to 10 redirects. |
| Parse dependent requests | The test requests images, scripts, style files, and other files that are part of the webpage under test. The recorded response time includes the time taken to get these files. The test fails if any of these resources can't be successfully downloaded within the timeout for the whole test. If the option isn't enabled, the test only requests the file at the URL that you specified. Enabling this option results in a stricter check. The test might fail for cases that aren't noticeable from manually browsing through the site. |
| Enable retries | When the test fails, it's retried after a short interval. A failure is reported only if three successive attempts fail. Subsequent tests are then performed at the usual test frequency. Retry is temporarily suspended until the next success. This rule is applied independently at each test location. We recommend this option. On average, about 80 percent of failures disappear on retry. |
| Test frequency | This setting determines how often the test is run from each test location. With a default frequency of five minutes and five test locations, your site is tested every minute on average. |
| Test locations | The values for this setting are the places from which servers send web requests to your URL. We recommend a minimum of 5 test locations to ensure that you can distinguish problems in your website from network issues. You can select up to 16 locations. |
If your URL isn't visible from the public internet, you can choose to selectively open your firewall to allow only the test transactions through. To learn more about the firewall exceptions for availability test agents, consult the IP address guide.
Note
We strongly recommend testing from multiple locations with a minimum of five locations. This approach helps prevent false alarms that can result from transient issues with a specific location. We've also found that the optimal configuration is to have the number of test locations be equal to the alert location threshold + 2.
| Setting | Description |
|---|---|
| Test timeout | Decrease this value to be alerted about slow responses. The test is counted as a failure if the responses from your site haven't been received within this period. If you selected Parse dependent requests, all the images, style files, scripts, and other dependent resources must have been received within this period. |
| HTTP response | The returned status code that's counted as a success. The code that indicates that a normal webpage has been returned is 200. |
| Content match | We test that an exact case-sensitive match for a string occurs in every response. It must be a plain string, without wildcards (like "Welcome!"). Don't forget that if your page content changes, you might have to update it. Content match supports only English characters. |
| Setting | Description |
|---|---|
| Near real time (preview) | We recommend using alerts that work in near real time. You configure this type of alert after you create your availability test. |
| Alert location threshold | The optimal relationship between alert location threshold and the number of test locations is alert location threshold = number of test locations - 2, with a minimum of five test locations. |
You can use the following population tags for the geolocation attribute when you're deploying an availability URL ping test by using Azure Resource Manager.
| Display name | Population name |
|---|---|
| USGov Virginia | usgov-va-azr |
| USGov Arizona | usgov-phx-azr |
| USGov Texas | usgov-tx-azr |
| USDoD East | usgov-ddeast-azr |
| USDoD Central | usgov-ddcentral-azr |
| Display name | Population name |
|---|---|
| China East | mc-cne-azr |
| China East 2 | mc-cne2-azr |
| China North | mc-cnn-azr |
| China North 2 | mc-cnn2-azr |
| Display name | Population name |
|---|---|
| Australia East | emea-au-syd-edge |
| Brazil South | latam-br-gru-edge |
| Central US | us-fl-mia-edge |
| East Asia | apac-hk-hkn-azr |
| East US | us-va-ash-azr |
| France South (Formerly France Central) | emea-ch-zrh-edge |
| France Central | emea-fr-pra-edge |
| Japan East | apac-jp-kaw-edge |
| North Europe | emea-gb-db3-azr |
| North Central US | us-il-ch1-azr |
| South Central US | us-tx-sn1-azr |
| Southeast Asia | apac-sg-sin-azr |
| UK West | emea-se-sto-edge |
| West Europe | emea-nl-ams-azr |
| West US | us-ca-sjc-azr |
| UK South | emea-ru-msa-edge |
You can visualize availability test results with both line and scatterplot views.
After a few minutes, select Refresh to see your test results.

The scatterplot view shows samples of the test results that have diagnostic test-step details in them. The test engine stores diagnostic details for tests that have failures. For successful tests, diagnostic details are stored for a subset of the executions. Hover over any of the green or red dots to see the test name and location.
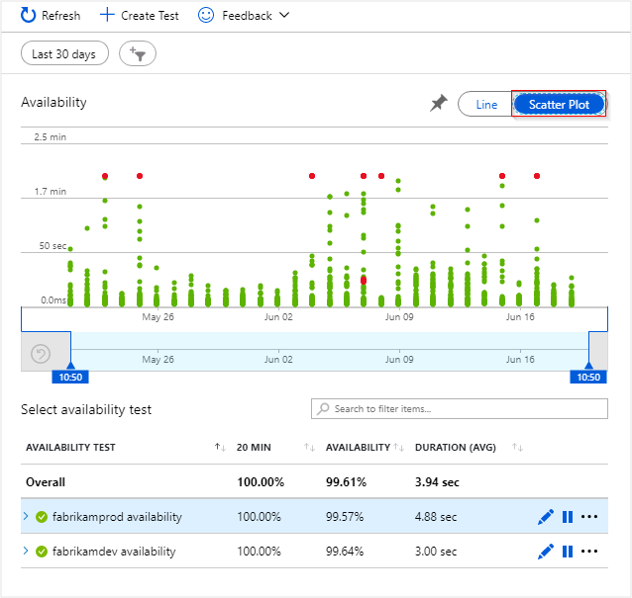
Select a particular test or location, or reduce the time period to see more results around the period of interest. Use Search Explorer to see results from all executions, or use analytics queries to run custom reports on this data.
To edit, temporarily disable, or delete a test, select the ellipsis (...) next to a test name. Configuration changes might take up to 20 minutes to propagate to all test agents after a change is made.
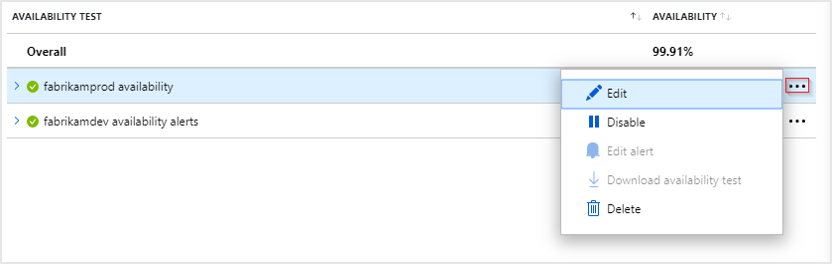
You might want to disable availability tests or the alert rules associated with them while you're performing maintenance on your service.
Select a red dot.
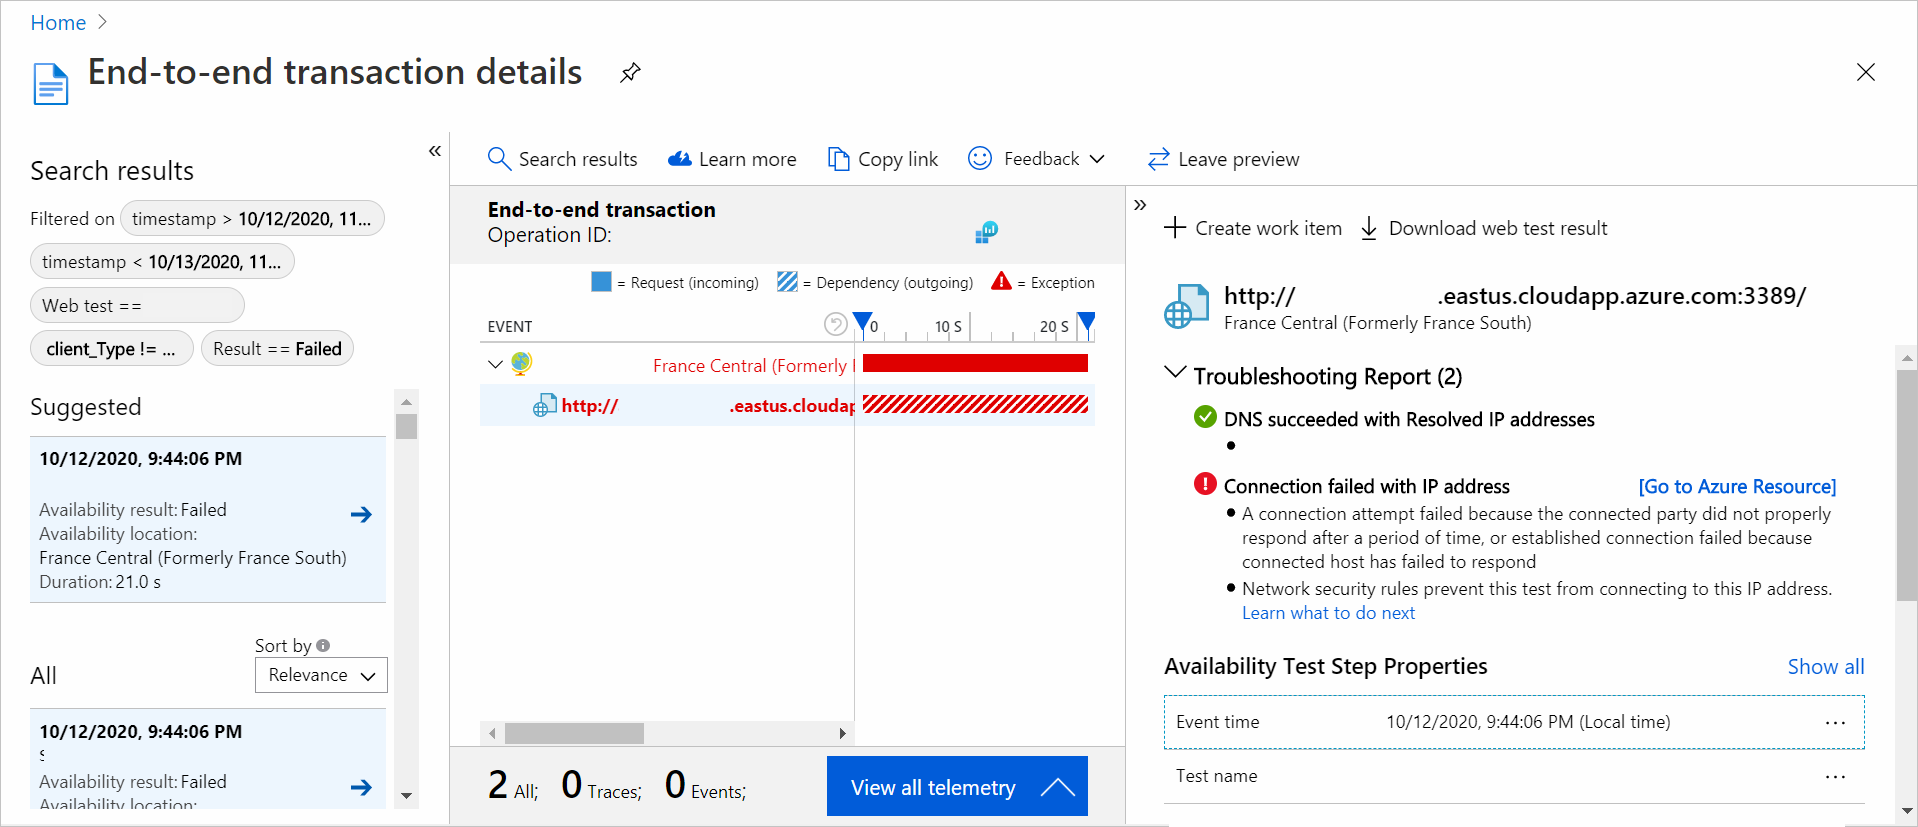
From an availability test result, you can see the transaction details across all components. You can then:
To learn more about end-to-end transaction diagnostics, see the transaction diagnostics documentation.
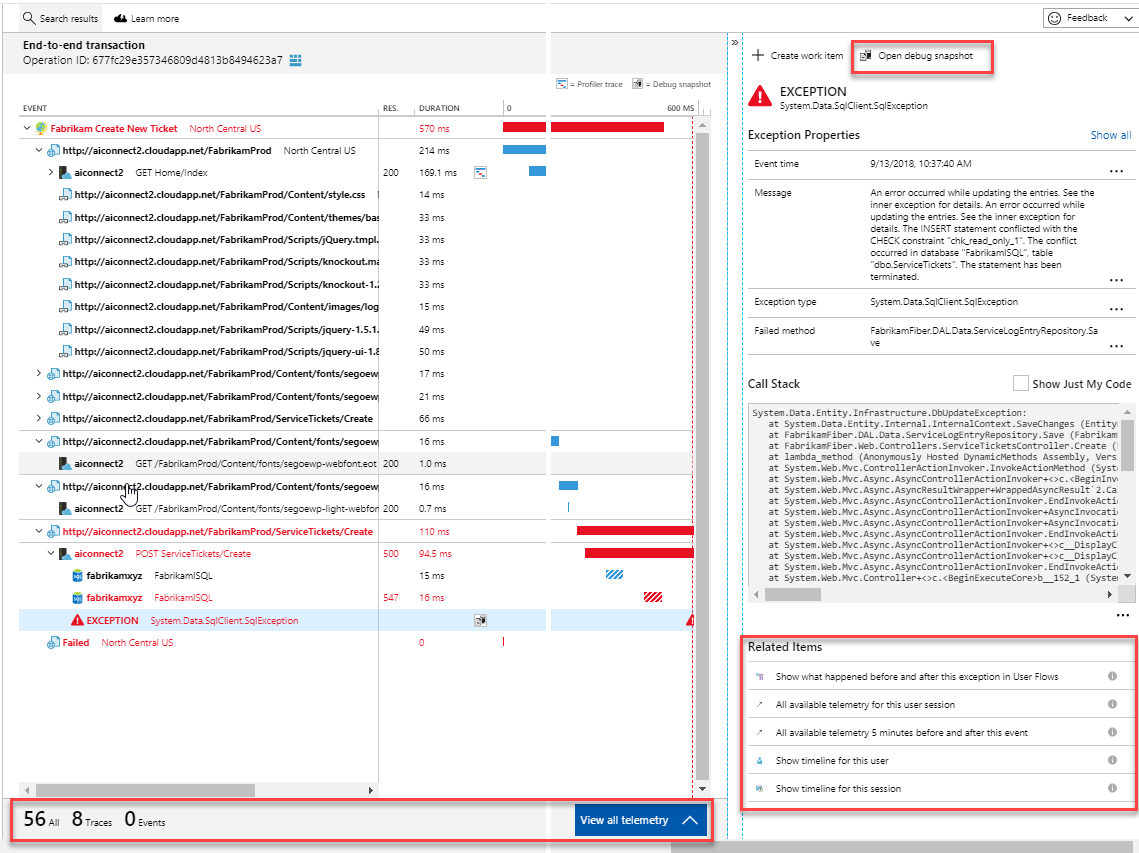
Select the exception row to see the details of the server-side exception that caused the synthetic availability test to fail. You can also get the debug snapshot for richer code-level diagnostics.
In addition to the raw results, you can view two key availability metrics in Metrics Explorer:
Ask Learn is an AI assistant that can answer questions, clarify concepts, and define terms using trusted Microsoft documentation.
Please sign in to use Ask Learn.
Sign in