Note
Access to this page requires authorization. You can try signing in or changing directories.
Access to this page requires authorization. You can try changing directories.
Caution
The OpenCensus Python SDK is retired. We recommend the OpenTelemetry-based Python offering and provide migration guidance.
Azure Monitor supports distributed tracing, metric collection, and logging of Python applications.
Microsoft's supported solution for tracking and exporting data for your Python applications is through the OpenCensus Python SDK via the Azure Monitor exporters.
Microsoft doesn't recommend using any other telemetry SDKs for Python as a telemetry solution because they're unsupported.
OpenCensus is converging into OpenTelemetry. We continue to recommend OpenCensus while OpenTelemetry gradually matures.
You need an Azure subscription. If you don't have an Azure subscription, create a free account before you begin.
Note
On March 31, 2025, support for instrumentation key ingestion will end. Instrumentation key ingestion will continue to work, but we'll no longer provide updates or support for the feature. Transition to connection strings to take advantage of new capabilities.
OpenCensus is a set of open-source libraries to allow collection of distributed tracing, metrics, and logging telemetry. By using Azure Monitor exporters, you can send this collected telemetry to Application Insights. This article walks you through the process of setting up OpenCensus and Azure Monitor exporters for Python to send your monitoring data to Azure Monitor.
Install the OpenCensus Azure Monitor exporters:
python -m pip install opencensus-ext-azure
The SDK uses three Azure Monitor exporters to send different types of telemetry to Azure Monitor. They're trace, metrics, and logs. For more information on these telemetry types, see the Data platform overview. Use the following instructions to send these telemetry types via the three exporters.
OpenCensus maps the following exporters to the types of telemetry that you see in Azure Monitor.
| Pillar of observability | Telemetry type in Azure Monitor | Explanation |
|---|---|---|
| Logs | Traces, exceptions, customEvents | Log telemetry, exception telemetry, event telemetry |
| Metrics | customMetrics, performanceCounters | Custom metrics performance counters |
| Tracing | Requests dependencies | Incoming requests, outgoing requests |
First, let's generate some local log data.
import logging

logger = logging.getLogger(__name__)

def main():
    """Generate random log data."""
    for num in range(5):
        logger.warning(f"Log Entry - {num}")

if __name__ == "__main__":
    main()
A log entry is emitted for each number in the range.
Log Entry - 0
Log Entry - 1
Log Entry - 2
Log Entry - 3
Log Entry - 4
We want to see this log data to Azure Monitor. You can specify it in an environment variable,
APPLICATIONINSIGHTS_CONNECTION_STRING. You may also pass the connection_string directly into theAzureLogHandler, but connection strings shouldn't be added to version control.APPLICATIONINSIGHTS_CONNECTION_STRING=<appinsights-connection-string>We recommend using the connection string to instantiate the exporters that are used to send telemetry to Application Insights. Modify your code from the previous step based on the following code sample:
import logging
from opencensus.ext.azure.log_exporter import AzureLogHandler

logger = logging.getLogger(__name__)
logger.addHandler(AzureLogHandler())

# Alternatively manually pass in the connection_string
# logger.addHandler(AzureLogHandler(connection_string=<appinsights-connection-string>))

"""Generate random log data."""
for num in range(5):
    logger.warning(f"Log Entry - {num}")
The exporter sends log data to Azure Monitor. You can find the data under
traces.In this context,
tracesisn't the same astracing. Here,tracesrefers to the type of telemetry that you see in Azure Monitor when you utilizeAzureLogHandler. Buttracingrefers to a concept in OpenCensus and relates to distributed tracing.Note
The root logger is configured with the level of
warning. That means any logs that you send that have less severity are ignored, and in turn, won't be sent to Azure Monitor. For more information, see Logging documentation.You can also add custom properties to your log messages in the
extrakeyword argument by using thecustom_dimensionsfield. These properties appear as key-value pairs incustomDimensionsin Azure Monitor.Note
For this feature to work, you need to pass a dictionary to the
custom_dimensionsfield. If you pass arguments of any other type, the logger ignores them.import logging from opencensus.ext.azure.log_exporter import AzureLogHandler logger = logging.getLogger(__name__) logger.addHandler(AzureLogHandler()) # Alternatively manually pass in the connection_string # logger.addHandler(AzureLogHandler(connection_string=<appinsights-connection-string>)) properties = {'custom_dimensions': {'key_1': 'value_1', 'key_2': 'value_2'}} # Use properties in logging statements logger.warning('action', extra=properties)
Note
As part of using Application Insights instrumentation, we collect and send diagnostic data to Microsoft. This data helps us run and improve Application Insights. You have the option to disable non-essential data collection. To learn more, see Statsbeat in Application Insights.
You can configure logging explicitly in your application code like the preceding for your Django applications, or you can specify it in Django's logging configuration. This code can go into whatever file you use for Django site's settings configuration, typically settings.py.
For information on how to configure Django settings, see Django settings. For more information on how to configure logging, see Django logging.
LOGGING = {
    "handlers": {
        "azure": {
            "level": "DEBUG",
            "class": "opencensus.ext.azure.log_exporter.AzureLogHandler",
            "connection_string": "<appinsights-connection-string>",
        },
        "console": {
            "level": "DEBUG",
            "class": "logging.StreamHandler",
            "stream": sys.stdout,
        },
      },
    "loggers": {
        "logger_name": {"handlers": ["azure", "console"]},
    },
}
Be sure you use the logger with the same name as the one specified in your configuration.
# views.py

import logging
from django.shortcuts import request

logger = logging.getLogger("logger_name")
logger.warning("this will be tracked")
OpenCensus Python doesn't automatically track and send exception telemetry. It's sent through AzureLogHandler by using exceptions through the Python logging library. You can add custom properties like you do with normal logging.
import logging

from opencensus.ext.azure.log_exporter import AzureLogHandler

logger = logging.getLogger(__name__)
logger.addHandler(AzureLogHandler())
# Alternatively, manually pass in the connection_string
# logger.addHandler(AzureLogHandler(connection_string=<appinsights-connection-string>))

properties = {'custom_dimensions': {'key_1': 'value_1', 'key_2': 'value_2'}}

# Use properties in exception logs
try:
    result = 1 / 0  # generate a ZeroDivisionError
except Exception:
    logger.exception('Captured an exception.', extra=properties)
Because you must log exceptions explicitly, it's up to you how to log unhandled exceptions. OpenCensus doesn't place restrictions on how to do this logging, but you must explicitly log exception telemetry.
You can send customEvent telemetry in exactly the same way that you send trace telemetry, except by using AzureEventHandler instead.
import logging
from opencensus.ext.azure.log_exporter import AzureEventHandler

logger = logging.getLogger(__name__)
logger.addHandler(AzureEventHandler())
# Alternatively manually pass in the connection_string
# logger.addHandler(AzureEventHandler(connection_string=<appinsights-connection-string>))

logger.setLevel(logging.INFO)
logger.info('Hello, World!')
For information on sampling in OpenCensus, see Sampling in OpenCensus.
For information on how to enrich your logs with trace context data, see OpenCensus Python logs integration.
For information on how to modify tracked telemetry before it's sent to Azure Monitor, see OpenCensus Python telemetry processors.
OpenCensus.stats supports four aggregation methods but provides partial support for Azure Monitor:
- Count: The count of the number of measurement points. The value is cumulative, can only increase, and resets to 0 on restart.
- Sum: A sum up of the measurement points. The value is cumulative, can only increase, and resets to 0 on restart.
- LastValue: Keeps the last recorded value and drops everything else.
- Distribution: The Azure exporter doesn't support the histogram distribution of the measurement points.
First, let's generate some local metric data. We create a metric to track the number of times the user selects the Enter key.
from datetime import datetime
from opencensus.stats import aggregation as aggregation_module
from opencensus.stats import measure as measure_module
from opencensus.stats import stats as stats_module
from opencensus.stats import view as view_module
from opencensus.tags import tag_map as tag_map_module

stats = stats_module.stats
view_manager = stats.view_manager
stats_recorder = stats.stats_recorder

prompt_measure = measure_module.MeasureInt("prompts",
                                           "number of prompts",
                                           "prompts")
prompt_view = view_module.View("prompt view",
                               "number of prompts",
                               [],
                               prompt_measure,
                               aggregation_module.CountAggregation())
view_manager.register_view(prompt_view)
mmap = stats_recorder.new_measurement_map()
tmap = tag_map_module.TagMap()

def main():
    for _ in range(4):
        mmap.measure_int_put(prompt_measure, 1)
        mmap.record(tmap)
        metrics = list(mmap.measure_to_view_map.get_metrics(datetime.utcnow()))
        print(metrics[0].time_series[0].points[0])

if __name__ == "__main__":
    main()
Metrics are created to track many times. With each entry, the value is incremented and the metric information appears in the console. The information includes the current value and the current time stamp when the metric was updated.
Point(value=ValueLong(5), timestamp=2019-10-09 20:58:04.930426)
Point(value=ValueLong(6), timestamp=2019-10-09 20:58:05.170167)
Point(value=ValueLong(7), timestamp=2019-10-09 20:58:05.438614)
Point(value=ValueLong(7), timestamp=2019-10-09 20:58:05.834216)
Entering values is helpful for demonstration purposes, but we want to emit the metric data to Azure Monitor. Pass your connection string directly into the exporter. Or you can specify it in an environment variable,
APPLICATIONINSIGHTS_CONNECTION_STRING. We recommend using the connection string to instantiate the exporters that are used to send telemetry to Application Insights. Modify your code from the previous step based on the following code sample:from datetime import datetime from opencensus.ext.azure import metrics_exporter from opencensus.stats import aggregation as aggregation_module from opencensus.stats import measure as measure_module from opencensus.stats import stats as stats_module from opencensus.stats import view as view_module from opencensus.tags import tag_map as tag_map_module stats = stats_module.stats view_manager = stats.view_manager stats_recorder = stats.stats_recorder prompt_measure = measure_module.MeasureInt("prompts", "number of prompts", "prompts") prompt_view = view_module.View("prompt view", "number of prompts", [], prompt_measure, aggregation_module.CountAggregation()) view_manager.register_view(prompt_view) mmap = stats_recorder.new_measurement_map() tmap = tag_map_module.TagMap() exporter = metrics_exporter.new_metrics_exporter() # Alternatively manually pass in the connection_string # exporter = metrics_exporter.new_metrics_exporter(connection_string='<appinsights-connection-string>') view_manager.register_exporter(exporter) def main(): for _ in range(10): input("Press enter.") mmap.measure_int_put(prompt_measure, 1) mmap.record(tmap) metrics = list(mmap.measure_to_view_map.get_metrics(datetime.utcnow())) print(metrics[0].time_series[0].points[0]) if __name__ == "__main__": main()The exporter sends metric data to Azure Monitor at a fixed interval. You must set this value to 60 seconds as Application Insights backend assumes aggregation of metrics points on a 60-second time interval. We're tracking a single metric, so this metric data, with whatever value and time stamp it contains, is sent every interval. The data is cumulative, can only increase, and resets to 0 on restart.
You can find the data under
customMetrics, but thecustomMetricspropertiesvalueCount,valueSum,valueMin,valueMax, andvalueStdDevaren't effectively used.
The OpenCensus Python SDK allows you to add custom dimensions to your metrics telemetry by using tags, which are like a dictionary of key-value pairs.
Insert the tags that you want to use into the tag map. The tag map acts like a sort of "pool" of all available tags you can use.
...
tmap = tag_map_module.TagMap()
tmap.insert("url", "http://example.com")
...
For a specific
View, specify the tags you want to use when you're recording metrics with that view via the tag key.... prompt_view = view_module.View("prompt view", "number of prompts", ["url"], # <-- A sequence of tag keys used to specify which tag key/value to use from the tag map prompt_measure, aggregation_module.CountAggregation()) ...Be sure to use the tag map when you're recording in the measurement map. The tag keys that are specified in the
Viewmust be found in the tag map used to record.... mmap = stats_recorder.new_measurement_map() mmap.measure_int_put(prompt_measure, 1) mmap.record(tmap) # <-- pass the tag map in here ...Under the
customMetricstable, all metric records emitted by usingprompt_viewhave custom dimensions{"url":"http://example.com"}.To produce tags with different values by using the same keys, create new tag maps for them.
...
tmap = tag_map_module.TagMap()
tmap2 = tag_map_module.TagMap()
tmap.insert("url", "http://example.com")
tmap2.insert("url", "https://www.wikipedia.org/wiki/")
...
By default, the metrics exporter sends a set of performance counters to Azure Monitor. You can disable this capability by setting the enable_standard_metrics flag to False in the constructor of the metrics exporter.
...
exporter = metrics_exporter.new_metrics_exporter(
  enable_standard_metrics=False,
  )
...
The following performance counters are currently sent:
- Available Memory (bytes)
- CPU Processor Time (percentage)
- Incoming Request Rate (per second)
- Incoming Request Average Execution Time (milliseconds)
- Process CPU Usage (percentage)
- Process Private Bytes (bytes)
You should be able to see these metrics in performanceCounters. For more information, see Performance counters.
For information on how to modify tracked telemetry before it's sent to Azure Monitor, see OpenCensus Python telemetry processors.
Note
In OpenCensus, tracing refers to distributed tracing. The AzureExporter parameter sends requests and dependency telemetry to Azure Monitor.
First, let's generate some trace data locally. In Python IDLE, or your editor of choice, enter the following code:
from opencensus.trace.samplers import ProbabilitySampler
from opencensus.trace.tracer import Tracer

tracer = Tracer(sampler=ProbabilitySampler(1.0))

def main():
    with tracer.span(name="test") as span:
        for value in range(5):
            print(value)


if __name__ == "__main__":
    main()
With each entry, the value is printed to the shell. The OpenCensus Python module generates a corresponding piece of
SpanData. The OpenCensus project defines a trace as a tree of spans.0 [SpanData(name='test', context=SpanContext(trace_id=8aa41bc469f1a705aed1bdb20c342603, span_id=None, trace_options=TraceOptions(enabled=True), tracestate=None), span_id='15ac5123ac1f6847', parent_span_id=None, attributes=BoundedDict({}, maxlen=32), start_time='2019-06-27T18:21:22.805429Z', end_time='2019-06-27T18:21:44.933405Z', child_span_count=0, stack_trace=None, annotations=BoundedList([], maxlen=32), message_events=BoundedList([], maxlen=128), links=BoundedList([], maxlen=32), status=None, same_process_as_parent_span=None, span_kind=0)] 1 [SpanData(name='test', context=SpanContext(trace_id=8aa41bc469f1a705aed1bdb20c342603, span_id=None, trace_options=TraceOptions(enabled=True), tracestate=None), span_id='2e512f846ba342de', parent_span_id=None, attributes=BoundedDict({}, maxlen=32), start_time='2019-06-27T18:21:44.933405Z', end_time='2019-06-27T18:21:46.156787Z', child_span_count=0, stack_trace=None, annotations=BoundedList([], maxlen=32), message_events=BoundedList([], maxlen=128), links=BoundedList([], maxlen=32), status=None, same_process_as_parent_span=None, span_kind=0)] 2 [SpanData(name='test', context=SpanContext(trace_id=8aa41bc469f1a705aed1bdb20c342603, span_id=None, trace_options=TraceOptions(enabled=True), tracestate=None), span_id='f3f9f9ee6db4740a', parent_span_id=None, attributes=BoundedDict({}, maxlen=32), start_time='2019-06-27T18:21:46.157732Z', end_time='2019-06-27T18:21:47.269583Z', child_span_count=0, stack_trace=None, annotations=BoundedList([], maxlen=32), message_events=BoundedList([], maxlen=128), links=BoundedList([], maxlen=32), status=None, same_process_as_parent_span=None, span_kind=0)]Viewing the output is helpful for demonstration purposes, but we want to emit
SpanDatato Azure Monitor. Pass your connection string directly into the exporter. Or you can specify it in an environment variable,APPLICATIONINSIGHTS_CONNECTION_STRING. We recommend using the connection string to instantiate the exporters that are used to send telemetry to Application Insights. Modify your code from the previous step based on the following code sample:from opencensus.ext.azure.trace_exporter import AzureExporter from opencensus.trace.samplers import ProbabilitySampler from opencensus.trace.tracer import Tracer tracer = Tracer( exporter=AzureExporter(), sampler=ProbabilitySampler(1.0), ) # Alternatively manually pass in the connection_string # exporter = AzureExporter( # connection_string='<appinsights-connection-string>', # ... # ) def main(): with tracer.span(name="test") as span: for value in range(5): print(value) if __name__ == "__main__": main()Now when you run the Python script, only the value is being printed in the shell. The created
SpanDatais sent to Azure Monitor. You can find the emitted span data underdependencies.For more information about outgoing requests, see OpenCensus Python dependencies. For more information on incoming requests, see OpenCensus Python requests.
For information on sampling in OpenCensus, see Sampling in OpenCensus.
For more information on telemetry correlation in your trace data, see OpenCensus Python telemetry correlation.
For more information on how to modify tracked telemetry before it's sent to Azure Monitor, see OpenCensus Python telemetry processors.
As shown, there are three different Azure Monitor exporters that support OpenCensus. Each one sends different types of telemetry to Azure Monitor. To see what types of telemetry each exporter sends, see the following table.
Each exporter accepts the same arguments for configuration, passed through the constructors. You can see information about each one here:
| Exporter telemetry | Description |
|---|---|
connection_string |
The connection string used to connect to your Azure Monitor resource. Takes priority over instrumentation_key. |
credential |
Credential class used by Azure Active Directory authentication. See the "Authentication" section that follows. |
enable_standard_metrics |
Used for AzureMetricsExporter. Signals the exporter to send performance counter metrics automatically to Azure Monitor. Defaults to True. |
export_interval |
Used to specify the frequency in seconds of exporting. Defaults to 15s. For metrics, you MUST set it to 60 seconds or else your metric aggregations don't make sense in the metrics explorer. |
grace_period |
Used to specify the timeout for shutdown of exporters in seconds. Defaults to 5s. |
instrumentation_key |
The instrumentation key used to connect to your Azure Monitor resource. |
logging_sampling_rate |
Used for AzureLogHandler and AzureEventHandler. Provides a sampling rate [0,1.0] for exporting logs/events. Defaults to 1.0. |
max_batch_size |
Specifies the maximum size of telemetry that's exported at once. |
proxies |
Specifies a sequence of proxies to use for sending data to Azure Monitor. For more information, see proxies. |
storage_path |
A path to where the local storage folder exists (unsent telemetry). As of opencensus-ext-azure v1.0.3, the default path is the OS temp directory + opencensus-python + your-ikey. Prior to v1.0.3, the default path is $USER + .opencensus + .azure + python-file-name. |
timeout |
Specifies the networking timeout to send telemetry to the ingestion service in seconds. Defaults to 10s. |
To capture custom telemetry in Azure Functions environments, use the OpenCensus Python Azure Functions extension. For more information, see the Azure Functions Python developer guide.
Note
The authentication feature is available starting from opencensus-ext-azure v1.1b0.
Each of the Azure Monitor exporters supports configuration of securely sending telemetry payloads via OAuth authentication with Azure Active Directory. For more information, see the Authentication documentation.
You can view the telemetry data that was sent from your application through the Logs (Analytics) tab.
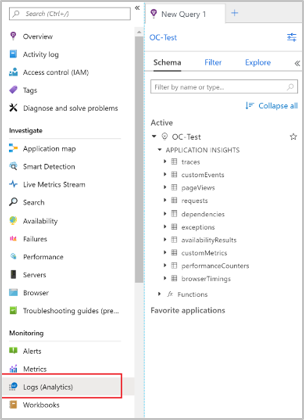
In the list under Active:
- For telemetry sent with the Azure Monitor trace exporter, incoming requests appear under
requests. Outgoing or in-process requests appear underdependencies. - For telemetry sent with the Azure Monitor metrics exporter, sent metrics appear under
customMetrics. - For telemetry sent with the Azure Monitor logs exporter, logs appear under
traces. Exceptions appear underexceptions.
For more information about how to use queries and logs, see Logs in Azure Monitor.
Note
Microsoft Entra authentication is only available for Python v2.7, v3.6, and v3.7. Support for Microsoft Entra ID in the Application Insights OpenCensus Python SDK is included starting with beta version opencensus-ext-azure 1.1b0.
Note
OpenCensus Python SDK is deprecated, but Microsoft supports it until retirement on September 30, 2024. We now recommend the OpenTelemetry-based Python offering and provide migration guidance.
Construct the appropriate credentials and pass them into the constructor of the Azure Monitor exporter. Make sure your connection string is set up with the instrumentation key and ingestion endpoint of your resource.
The OpenCensus Azure Monitor exporters support these authentication types. We recommend using managed identities in production environments.
from azure.identity import ManagedIdentityCredential

from opencensus.ext.azure.trace_exporter import AzureExporter
from opencensus.trace.samplers import ProbabilitySampler
from opencensus.trace.tracer import Tracer

credential = ManagedIdentityCredential()
tracer = Tracer(
    exporter=AzureExporter(credential=credential, connection_string="InstrumentationKey=<your-instrumentation-key>;IngestionEndpoint=<your-ingestion-endpoint>"),
    sampler=ProbabilitySampler(1.0)
)
...
from azure.identity import ManagedIdentityCredential

from opencensus.ext.azure.trace_exporter import AzureExporter
from opencensus.trace.samplers import ProbabilitySampler
from opencensus.trace.tracer import Tracer

credential = ManagedIdentityCredential(client_id="<client-id>")
tracer = Tracer(
    exporter=AzureExporter(credential=credential, connection_string="InstrumentationKey=<your-instrumentation-key>;IngestionEndpoint=<your-ingestion-endpoint>"),
    sampler=ProbabilitySampler(1.0)
)
...
- OpenCensus Python on GitHub
- Customization
- Azure Monitor exporters on GitHub
- OpenCensus integrations
- Azure Monitor sample applications
Application Insights SDKs and agents send telemetry to get ingested as REST calls to our ingestion endpoints. You can test connectivity from your web server or application host machine to the ingestion service endpoints by using raw REST clients from PowerShell or curl commands. See Troubleshoot missing application telemetry in Azure Monitor Application Insights.
For the latest release notes, see Python Azure Monitor Exporter
Our Service Updates also summarize major Application Insights improvements.
- To enable usage experiences, enable web or browser user monitoring
- Track incoming requests.
- Track outgoing requests.
- Check out the Application map.
- Learn how to do End-to-end performance monitoring.
- Availability overview: Create tests to make sure your site is visible on the web.
- Smart diagnostics: These tests run automatically, so you don't have to do anything to set them up. They tell you if your app has an unusual rate of failed requests.
- Metric alerts: Set alerts to warn you if a metric crosses a threshold. You can set them on custom metrics that you code into your app.