Note
Access to this page requires authorization. You can try signing in or changing directories.
Access to this page requires authorization. You can try changing directories.

This article describes how to set up and use the Container Monitoring solution in Azure Monitor, which helps you view and manage your Docker and Windows container hosts in a single location. Docker is a software virtualization system used to create containers that automate software deployment to their IT infrastructure.
Important
The Container Monitoring solution is being phased out. To monitor your Kubernetes environments, we recommend transitioning to Azure Monitor Container insights.
Note
This article was recently updated to use the term Azure Monitor logs instead of Log Analytics. Log data is still stored in a Log Analytics workspace and is still collected and analyzed by the same Log Analytics service. We are updating the terminology to better reflect the role of logs in Azure Monitor. See Azure Monitor terminology changes for details.
The solution shows which containers are running, what container image they’re running, and where containers are running. You can view detailed audit information showing commands used with containers. And, you can troubleshoot containers by viewing and searching centralized logs without having to remotely view Docker or Windows hosts. You can find containers that may be noisy and consuming excess resources on a host. And, you can view centralized CPU, memory, storage, and network usage and performance information for containers. On computers running Windows, you can centralize and compare logs from Windows Server, Hyper-V, and Docker containers. The solution supports the following container orchestrators:
- Docker Swarm
- DC/OS
- Service Fabric
We recommend using Azure Monitor Container insights for monitoring your Kubernetes and Red Hat OpenShift:
- AKS (Configure Container insights for AKS)
- Red Hat OpenShift (Configure Container insights using Azure Arc)
If you have containers deployed in Azure Service Fabric, we recommend enabling both the Service Fabric solution and this solution to include monitoring of cluster events. Before enabling the Service Fabric solution, review Using the Service Fabric solution to understand what it provides and how to use it.
If you are interested in monitoring the performance of your workloads deployed to Kubernetes environments hosted on Azure Kubernetes Service (AKS), see Monitor Azure Kubernetes Service. The Container Monitoring solution does not support monitoring that platform.
The following diagram shows the relationships between various container hosts and agents with Azure Monitor.

Before starting, review the following details to verify you meet the prerequisites.
The following table outlines the Docker orchestration and operating system monitoring support of container inventory, performance, and logs with Azure Monitor.
| Docker Orchestration | ACS | Linux | Windows | Container Inventory |
Image Inventory |
Node Inventory |
Container Performance |
Container Event |
Event Log |
Container Log |
|---|---|---|---|---|---|---|---|---|---|---|
| Kubernetes | • | • | • | • | • | • | • | • | • | • |
| Mesosphere DC/OS |
• | • | • | • | • | • | • | • | • | |
| Docker Swarm |
• | • | • | • | • | • | • | • | • | |
| Service Fabric |
• | • | • | • | • | • | • | • | • | |
| Red Hat Open Shift |
• | • | • | • | • | • | • | |||
| Windows Server (standalone) |
• | • | • | • | • | • | • | |||
| Linux Server (standalone) |
• | • | • | • | • | • | • |
- Docker 1.11 to 1.13
- Docker CE and EE v17.06
- Ubuntu 14.04 LTS and 16.04 LTS
- CoreOS(stable)
- Amazon Linux 2016.09.0
- openSUSE 13.2
- openSUSE LEAP 42.2
- CentOS 7.2 and 7.3
- SLES 12
- RHEL 7.2 and 7.3
- Red Hat OpenShift Container Platform (OCP) 3.4 and 3.5
- ACS Mesosphere DC/OS 1.7.3 to 1.8.8
- ACS Kubernetes 1.4.5 to 1.6
- Kubernetes events, Kubernetes inventory, and container processes are only supported with version 1.4.1-45 and later of the Log Analytics agent for Linux
- ACS Docker Swarm
Note
As part of the ongoing transition from Microsoft Operations Management Suite to Azure Monitor, the Operations Management Suite Agent for Windows or Linux will be referred to as the Log Analytics agent for Windows and Log Analytics agent for Linux.
- Windows Server 2016
- Windows 10 Anniversary Edition (Professional or Enterprise)
- Docker 1.12 and 1.13
- Docker 17.03.0 and later
Use the following information to install and configure the solution.
Add the Container Monitoring solution to your Log Analytics workspace from Azure Marketplace or by using the process described in Add monitoring solutions from the Solutions Gallery.
Install and use Docker with a Log Analytics agent. Based on your operating system and Docker orchestrator, you can use the following methods to configure your agent.
- For standalone hosts:
- On supported Linux operating systems, install and run Docker and then install and configure the Log Analytics agent for Linux.
- On CoreOS, you cannot run the Log Analytics agent for Linux. Instead, you run a containerized version of the Log Analytics agent for Linux. Review Linux container hosts including CoreOS or Azure Government Linux container hosts including CoreOS if you are working with containers in Azure Government Cloud.
- On Windows Server 2016 and Windows 10, install the Docker Engine and client then connect an agent to gather information and send it to Azure Monitor. Review Install and configure Windows container hosts if you have a Windows environment.
- For Docker multi-host orchestration:
- If you have a Red Hat OpenShift environment, review Configure a Log Analytics agent for Red Hat OpenShift.
- If you have a Kubernetes cluster using the Azure Container Service:
- Review Configure a Log Analytics Linux agent for Kubernetes.
- Review Configure a Log Analytics Windows agent for Kubernetes.
- Review Use Helm to deploy Log Analytics agent on Linux Kubernetes.
- If you have an Azure Container Service DC/OS cluster, learn more at Monitor an Azure Container Service DC/OS cluster with Azure Monitor.
- If you have a Docker Swarm mode environment, learn more at Configure a Log Analytics agent for Docker Swarm.
- If you have a Service Fabric cluster, learn more at Monitor containers with Azure Monitor.
- For standalone hosts:
Review the Docker Engine on Windows article for additional information about how to install and configure your Docker Engines on computers running Windows.
Important
Docker must be running before you install the Log Analytics agent for Linux on your container hosts. If you've already installed the agent before installing Docker, you need to reinstall the Log Analytics agent for Linux. For more information about Docker, see the Docker website.
After you've installed Docker, use the following settings for your container host to configure the agent for use with Docker. First you need your Log Analytics workspace ID and key, which you can find in the Azure portal. In your workspace, click Quick Start > Computers to view your Workspace ID and Primary Key. Copy and paste both into your favorite editor.
For all Linux container hosts except CoreOS:
- For more information and steps on how to install the Log Analytics agent for Linux, see Log Analytics agent overview.
For all Linux container hosts including CoreOS:
Start the container that you want to monitor. Modify and use the following example:
sudo docker run --privileged -d -v /var/run/docker.sock:/var/run/docker.sock -v /var/lib/docker/containers:/var/lib/docker/containers -e WSID="your workspace id" -e KEY="your key" -h=`hostname` -p 127.0.0.1:25225:25225 --name="omsagent" --restart=always mcr.microsoft.com/azuremonitor/containerinsights/ciprod:microsoft-oms-latest
For all Azure Government Linux container hosts including CoreOS:
Start the container that you want to monitor. Modify and use the following example:
sudo docker run --privileged -d -v /var/run/docker.sock:/var/run/docker.sock -v /var/log:/var/log -v /var/lib/docker/containers:/var/lib/docker/containers -e WSID="your workspace id" -e KEY="your key" -e DOMAIN="opinsights.azure.us" -p 127.0.0.1:25225:25225 -p 127.0.0.1:25224:25224/udp --name="omsagent" -h=`hostname` --restart=always mcr.microsoft.com/azuremonitor/containerinsights/ciprod:microsoft-oms-latest
Switching from using an installed Linux agent to one in a container
If you previously used the directly-installed agent and want to instead use an agent running in a container, you must first remove the Log Analytics agent for Linux. See Uninstalling the Log Analytics agent for Linux to understand how to successfully uninstall the agent.
You can run the Log Analytics agent as a global service on Docker Swarm. Use the following information to create a Log Analytics agent service. You need to provide your Log Analytics Workspace ID and Primary Key.
Run the following on the master node.
sudo docker service create --name omsagent --mode global --mount type=bind,source=/var/run/docker.sock,destination=/var/run/docker.sock --mount type=bind,source=/var/lib/docker/containers,destination=/var/lib/docker/containers -e WSID="<WORKSPACE ID>" -e KEY="<PRIMARY KEY>" -p 25225:25225 -p 25224:25224/udp --restart-condition=on-failure mcr.microsoft.com/azuremonitor/containerinsights/ciprod:microsoft-oms-latest
For Docker Swarm, once the secret for Workspace ID and Primary Key is created, use the following information to create your secret information.
Run the following on the master node.
echo "WSID" | docker secret create WSID -
echo "KEY" | docker secret create KEY -
Verify that secrets were created properly.
keiko@swarmm-master-13957614-0:/run# sudo docker secret lsID NAME CREATED UPDATED j2fj153zxy91j8zbcitnjxjiv WSID 43 minutes ago 43 minutes ago l9rh3n987g9c45zffuxdxetd9 KEY 38 minutes ago 38 minutes agoRun the following command to mount the secrets to the containerized Log Analytics agent.
sudo docker service create --name omsagent --mode global --mount type=bind,source=/var/run/docker.sock,destination=/var/run/docker.sock --mount type=bind,source=/var/lib/docker/containers,destination=/var/lib/docker/containers --secret source=WSID,target=WSID --secret source=KEY,target=KEY -p 25225:25225 -p 25224:25224/udp --restart-condition=on-failure mcr.microsoft.com/azuremonitor/containerinsights/ciprod:microsoft-oms-latest
There are three ways to add the Log Analytics agent to Red Hat OpenShift to start collecting container monitoring data.
- Install the Log Analytics agent for Linux directly on each OpenShift node
- Enable Log Analytics VM Extension on each OpenShift node residing in Azure
- Install the Log Analytics agent as an OpenShift daemon-set
In this section we cover the steps required to install the Log Analytics agent as an OpenShift daemon-set.
Sign on to the OpenShift master node and copy the yaml file ocp-omsagent.yaml from GitHub to your master node and modify the value with your Log Analytics Workspace ID and with your Primary Key.
Run the following commands to create a project for Azure Monitor and set the user account.
oc adm new-project omslogging --node-selector='zone=default'
oc project omslogging
oc create serviceaccount omsagent
oc adm policy add-cluster-role-to-user cluster-reader   system:serviceaccount:omslogging:omsagent
oc adm policy add-scc-to-user privileged system:serviceaccount:omslogging:omsagent
To deploy the daemon-set, run the following:
oc create -f ocp-omsagent.yamlTo verify it is configured and working correctly, type the following:
oc describe daemonset omsagentand the output should resemble:
[ocpadmin@khm-0 ~]$ oc describe ds oms
Name:           oms
Image(s):       mcr.microsoft.com/azuremonitor/containerinsights/ciprod:microsoft-oms-latest
Selector:       name=omsagent
Node-Selector:  zone=default
Labels:         agentVersion=1.4.0-12
                dockerProviderVersion=10.0.0-25
                name=omsagent
Desired Number of Nodes Scheduled: 3
Current Number of Nodes Scheduled: 3
Number of Nodes Misscheduled: 0
Pods Status:    3 Running / 0 Waiting / 0 Succeeded / 0 Failed
No events.
If you want to use secrets to secure your Log Analytics Workspace ID and Primary Key when using the Log Analytics agent daemon-set yaml file, perform the following steps.
Sign on to the OpenShift master node and copy the yaml file ocp-ds-omsagent.yaml and secret generating script ocp-secretgen.sh from GitHub. This script will generate the secrets yaml file for Log Analytics Workspace ID and Primary Key to secure your secrete information.
Run the following commands to create a project for Azure Monitor and set the user account. The secret generating script asks for your Log Analytics Workspace ID
<WSID>and Primary Key<KEY>and upon completion, it creates the ocp-secret.yaml file.oc adm new-project omslogging --node-selector='zone=default' oc project omslogging oc create serviceaccount omsagent oc adm policy add-cluster-role-to-user cluster-reader system:serviceaccount:omslogging:omsagent oc adm policy add-scc-to-user privileged system:serviceaccount:omslogging:omsagentDeploy the secret file by running the following:
oc create -f ocp-secret.yamlVerify deployment by running the following:
oc describe secret omsagent-secretand the output should resemble:
[ocpadmin@khocp-master-0 ~]$ oc describe secret omsagent-secret
Name:           omsagent-secret
Namespace:      omslogging
Labels:         <none>
Annotations:    <none>
Type:   Opaque
Data
====
KEY:    89 bytes
WSID:   37 bytes
Deploy the Log Analytics agent daemon-set yaml file by running the following:
oc create -f ocp-ds-omsagent.yamlVerify deployment by running the following:
oc describe ds omsand the output should resemble:
[ocpadmin@khocp-master-0 ~]$ oc describe ds oms
Name:           oms
Image(s):       mcr.microsoft.com/azuremonitor/containerinsights/ciprod:microsoft-oms-latest
Selector:       name=omsagent
Node-Selector:  zone=default
Labels:         agentVersion=1.4.0-12
                dockerProviderVersion=10.0.0-25
                name=omsagent
Desired Number of Nodes Scheduled: 3
Current Number of Nodes Scheduled: 3
Number of Nodes Misscheduled: 0
Pods Status:    3 Running / 0 Waiting / 0 Succeeded / 0 Failed
No events.
For Kubernetes, you use a script to generate the secrets yaml file for your Workspace ID and Primary Key to install the Log Analytics agent for Linux. At the Log Analytics Docker Kubernetes GitHub page, there are files that you can use with or without your secret information.
- The Default Log Analytics agent for Linux DaemonSet does not have secret information (omsagent.yaml)
- The Log Analytics agent for Linux DaemonSet yaml file uses secret information (omsagent-ds-secrets.yaml) with secret generation scripts to generate the secrets yaml (omsagentsecret.yaml) file.
You can choose to create omsagent DaemonSets with or without secrets.
Default OMSagent DaemonSet yaml file without secrets
For the default Log Analytics agent DaemonSet yaml file, replace the
<WSID>and<KEY>to your WSID and KEY. Copy the file to your master node and run the following:sudo kubectl create -f omsagent.yaml
Default OMSagent DaemonSet yaml file with secrets
To use Log Analytics agent DaemonSet using secret information, create the secrets first.
Copy the script and secret template file and make sure they are on the same directory.
- Secret generating script - secret-gen.sh
- secret template - secret-template.yaml
Run the script, like the following example. The script asks for the Log Analytics Workspace ID and Primary Key and after you enter them, the script creates a secret yaml file so you can run it.
#> sudo bash ./secret-gen.shCreate the secrets pod by running the following:
sudo kubectl create -f omsagentsecret.yamlTo verify, run the following:
keiko@ubuntu16-13db:~# sudo kubectl get secretsOutput should resemble:
NAME                  TYPE                                  DATA      AGE
default-token-gvl91   kubernetes.io/service-account-token   3         50d
omsagent-secret       Opaque                                2         1d
keiko@ubuntu16-13db:~# sudo kubectl describe secrets omsagent-secretOutput should resemble:
Name:           omsagent-secret
Namespace:      default
Labels:         <none>
Annotations:    <none>

Type:   Opaque

Data
====
WSID:   36 bytes
KEY:    88 bytes
Create your omsagent daemon-set by running
sudo kubectl create -f omsagent-ds-secrets.yaml
Verify that the Log Analytics agent DaemonSet is running, similar to the following:
keiko@ubuntu16-13db:~# sudo kubectl get ds omsagentNAME DESIRED CURRENT NODE-SELECTOR AGE omsagent 3 3 <none> 1h
For Kubernetes, use a script to generate the secrets yaml file for Workspace ID and Primary Key for the Log Analytics agent for Linux. Use the following example information with the omsagent yaml file to secure your secret information.
keiko@ubuntu16-13db:~# sudo kubectl describe secrets omsagent-secret
Name:           omsagent-secret
Namespace:      default
Labels:         <none>
Annotations:    <none>

Type:   Opaque

Data
====
WSID:   36 bytes
KEY:    88 bytes
For Windows Kubernetes, you use a script to generate the secrets yaml file for your Workspace ID and Primary Key to install the Log Analytics agent. At the Log Analytics Docker Kubernetes GitHub page, there are files that you can use with your secret information. You need to install the Log Analytics agent separately for the master and agent nodes.
To use Log Analytics agent DaemonSet using secret information on the Master node, sign in and create the secrets first.
Copy the script and secret template file and make sure they are on the same directory.
- Secret generating script - secret-gen.sh
- secret template - secret-template.yaml
Run the script, like the following example. The script asks for the Log Analytics Workspace ID and Primary Key and after you enter them, the script creates a secret yaml file so you can run it.
#> sudo bash ./secret-gen.shCreate your omsagent daemon-set by running
kubectl create -f omsagentsecret.yamlTo check, run the following:
root@ubuntu16-13db:~# kubectl get secretsOutput should resemble:
NAME                  TYPE                                  DATA      AGE
default-token-gvl91   kubernetes.io/service-account-token   3         50d
omsagent-secret       Opaque                                2         1d
root@ubuntu16-13db:~# kubectl describe secrets omsagent-secret
Name:           omsagent-secret
Namespace:      default
Labels:         <none>
Annotations:    <none>

Type:   Opaque

Data
====
WSID:   36 bytes
KEY:    88 bytes
Create your omsagent daemon-set by running
kubectl create -f ws-omsagent-de-secrets.yaml
Verify that the Log Analytics agent DaemonSet is running, similar to the following:
root@ubuntu16-13db:~# kubectl get deployment omsagent
NAME       DESIRED   CURRENT   NODE-SELECTOR   AGE
omsagent   1         1         <none>          1h
To install the agent on the Worker Node, which are running Windows, follow the steps in the section install and configure Windows container hosts.
To use helm to deploy Log Analytics agent on your Linux Kubernetes environment, perform the following steps.
Create your omsagent daemon-set by running
helm install --name omsagent --set omsagent.secret.wsid=<WSID>,omsagent.secret.key=<KEY> stable/msomsThe results will look similar to the following:
NAME:   omsagent
LAST DEPLOYED: Tue Sep 19 20:37:46 2017
NAMESPACE: default
STATUS: DEPLOYED

RESOURCES:
==> v1/Secret
NAME            TYPE    DATA  AGE
omsagent-msoms  Opaque  3     3s

==> v1beta1/DaemonSet
NAME            DESIRED  CURRENT  READY  UP-TO-DATE  AVAILABLE  NODE-SELECTOR  AGE
omsagent-msoms  3        3        3      3           3          <none>         3s
You can check the status of the omsagent by running:
helm status "omsagent"and the output will look similar to the following:keiko@k8s-master-3814F33-0:~$ helm status omsagent LAST DEPLOYED: Tue Sep 19 20:37:46 2017 NAMESPACE: default STATUS: DEPLOYED RESOURCES: ==> v1/Secret NAME TYPE DATA AGE omsagent-msoms Opaque 3 17m ==> v1beta1/DaemonSet NAME DESIRED CURRENT READY UP-TO-DATE AVAILABLE NODE-SELECTOR AGE omsagent-msoms 3 3 3 3 3 <none> 17mFor further information, please visit Container Solution Helm Chart.
Use the information in section to install and configure Windows container hosts.
Before you install agents on computers running Windows, you need to configure the Docker service. The configuration allows the Windows agent or the Azure Monitor virtual machine extension to use the Docker TCP socket so that the agents can access the Docker daemon remotely and to capture data for monitoring.
Perform the following PowerShell commands to enable TCP pipe and named pipe for Windows Server:
Stop-Service docker
dockerd --unregister-service
dockerd --register-service -H npipe:// -H 0.0.0.0:2375
Start-Service docker
For more information about the Docker daemon configuration used with Windows Containers, see Docker Engine on Windows.
To enable Windows and Hyper-V container monitoring, install the Microsoft Monitoring Agent (MMA) on Windows computers that are container hosts. For computers running Windows in your on-premises environment, see Connect Windows computers to Azure Monitor. For virtual machines running in Azure, connect them to Azure Monitor using the virtual machine extension.
You can monitor Windows containers running on Service Fabric. However, only virtual machines running in Azure and computers running Windows in your on-premises environment are currently supported for Service Fabric.
You can verify that the Container Monitoring solution is set correctly for Windows. To check whether the management pack was download properly, look for ContainerManagement.xxx. The files should be in the C:\Program Files\Microsoft Monitoring Agent\Agent\Health Service State\Management Packs folder.
From the Azure portal, navigate to the Solutions Gallery and add the Container Monitoring Solution. If you are using Windows agents, then the following management pack is installed on each computer with an agent when you add this solution. No configuration or maintenance is required for the management pack.
- ContainerManagement.xxx installed in C:\Program Files\Microsoft Monitoring Agent\Agent\Health Service State\Management Packs
The Container Monitoring solution collects various performance metrics and log data from container hosts and containers using agents that you enable.
Data is collected every three minutes by the following agent types.
The following table shows examples of records collected by the Container Monitoring solution and the data types that appear in log search results.
| Data type | Data type in Log Search | Fields |
|---|---|---|
| Performance for hosts and containers | Perf |
Computer, ObjectName, CounterName (%Processor Time, Disk Reads MB, Disk Writes MB, Memory Usage MB, Network Receive Bytes, Network Send Bytes, Processor Usage sec, Network), CounterValue,TimeGenerated, CounterPath, SourceSystem |
| Container inventory | ContainerInventory |
TimeGenerated, Computer, container name, ContainerHostname, Image, ImageTag, ContainerState, ExitCode, EnvironmentVar, Command, CreatedTime, StartedTime, FinishedTime, SourceSystem, ContainerID, ImageID |
| Container image inventory | ContainerImageInventory |
TimeGenerated, Computer, Image, ImageTag, ImageSize, VirtualSize, Running, Paused, Stopped, Failed, SourceSystem, ImageID, TotalContainer |
| Container log | ContainerLog |
TimeGenerated, Computer, image ID, container name, LogEntrySource, LogEntry, SourceSystem, ContainerID |
| Container service log | ContainerServiceLog |
TimeGenerated, Computer, TimeOfCommand, Image, Command, SourceSystem, ContainerID |
| Container node inventory | ContainerNodeInventory_CL |
TimeGenerated, Computer, ClassName_s, DockerVersion_s, OperatingSystem_s, Volume_s, Network_s, NodeRole_s, OrchestratorType_s, InstanceID_g, SourceSystem |
| Kubernetes inventory | KubePodInventory_CL |
TimeGenerated, Computer, PodLabel_deployment_s, PodLabel_deploymentconfig_s, PodLabel_docker_registry_s, Name_s, Namespace_s, PodStatus_s, PodIp_s, PodUid_g, PodCreationTimeStamp_t, SourceSystem |
| Container process | ContainerProcess_CL |
TimeGenerated, Computer, Pod_s, Namespace_s, ClassName_s, InstanceID_s, Uid_s, PID_s, PPID_s, C_s, STIME_s, Tty_s, TIME_s, Cmd_s, Id_s, Name_s, SourceSystem |
| Kubernetes events | KubeEvents_CL |
TimeGenerated, Computer, Name_s, ObjectKind_s, Namespace_s, Reason_s, Type_s, SourceComponent_s, SourceSystem, Message |
Labels appended to PodLabel data types are your own custom labels. The appended PodLabel labels shown in the table are examples. So, PodLabel_deployment_s, PodLabel_deploymentconfig_s, PodLabel_docker_registry_s will differ in your environment's data set and generically resemble PodLabel_yourlabel_s.
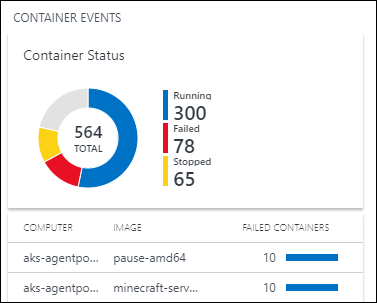
After you have the solution enabled in the Azure portal, the Containers tile shows summary information about your container hosts and the containers running in hosts.

The tile shows an overview of how many containers you have in the environment and whether they're failed, running, or stopped.
Click the Containers tile. From there you'll see views organized by:
- Container Events - Shows container status and computers with failed containers.
- Container Logs - Shows a chart of container log files generated over time and a list of computers with the highest number of log files.
- Kubernetes Events - Shows a chart of Kubernetes events generated over time and a list of the reasons why pods generated the events. This data set is used only in Linux environments.
- Kubernetes Namespace Inventory - Shows the number of namespaces and pods and shows their hierarchy. This data set is used only in Linux environments.
- Container Node Inventory - Shows the number of orchestration types used on container nodes/hosts. The computer nodes/hosts are also listed by the number of containers. This data set is used only in Linux environments.
- Container Images Inventory - Shows the total number of container images used and number of image types. The number of images are also listed by the image tag.
- Containers Status - Shows the total number of container nodes/host computers that have running containers. Computers are also listed by the number of running hosts.
- Container Process - Shows a line chart of container processes running over time. Containers are also listed by running command/process within containers. This data set is used only in Linux environments.
- Container CPU Performance - Shows a line chart of the average CPU utilization over time for computer nodes/hosts. Also lists the computer nodes/hosts based on average CPU utilization.
- Container Memory Performance - Shows a line chart of memory usage over time. Also lists computer memory utilization based on instance name.
- Computer Performance - Shows line charts of the percent of CPU performance over time, percent of memory usage over time, and megabytes of free disk space over time. You can hover over any line in a chart to view more details.
Each area of the dashboard is a visual representation of a search that is run on collected data.


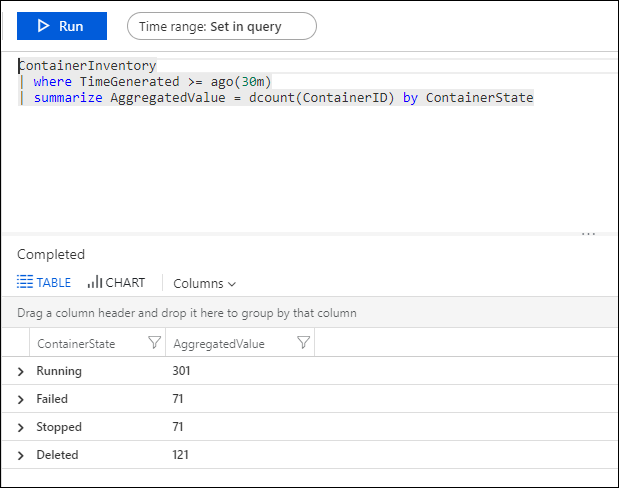
In the Container Status area, click the top area, as shown below.

Log Analytics opens, displaying information about the state of your containers.

From here, you can edit the search query to modify it to find the specific information you're interested in. For more information about log queries, see Log queries in Azure Monitor.
Log Analytics marks a container as Failed if it has exited with a non-zero exit code. You can see an overview of the errors and failures in the environment in the Failed Containers area.
- Click the Container Status area.
- Log Analytics opens and displays the state of your containers, similar to the following.
- Expand the Failed line and click + to add its criteria to the query. Then comment out the Summarize line in the query.
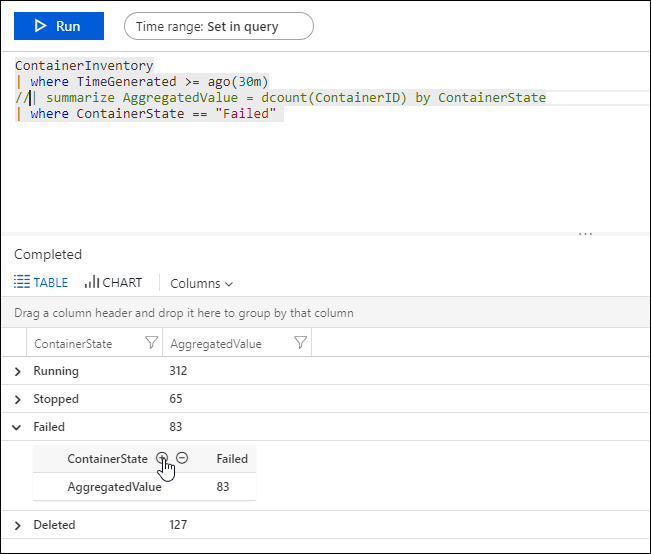
- Run the query and then expand a line in the results to view the image ID.
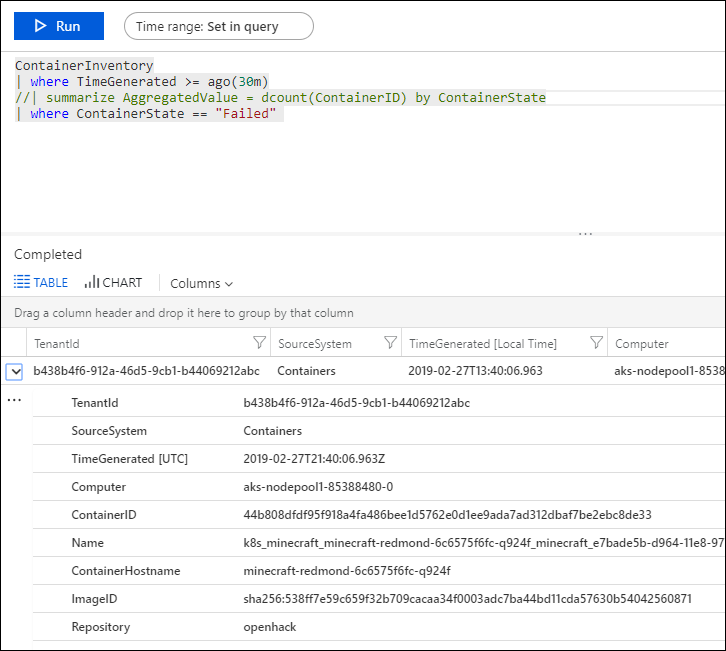
- Type the following in the log query.
ContainerImageInventory | where ImageID == <ImageID>to see details about the image such as image size and number of stopped and failed images.


When you're troubleshooting a specific error, it can help to see where it is occurring in your environment. The following log types will help you create queries to return the information you want.
- ContainerImageInventory – Use this type when you're trying to find information organized by image and to view image information such as image IDs or sizes.
- ContainerInventory – Use this type when you want information about container location, what their names are, and what images they're running.
- ContainerLog – Use this type when you want to find specific error log information and entries.
- ContainerNodeInventory_CL Use this type when you want the information about host/node where containers are residing. It provides you Docker version, orchestration type, storage, and network information.
- ContainerProcess_CL Use this type to quickly see the process running within the container.
- ContainerServiceLog – Use this type when you're trying to find audit trail information for the Docker daemon, such as start, stop, delete, or pull commands.
- KubeEvents_CL Use this type to see the Kubernetes events.
- KubePodInventory_CL Use this type when you want to understand the cluster hierarchy information.
Choose an image that you know has failed recently and find the error logs for it. Start by finding a container name that is running that image with a ContainerInventory search. For example, search for
ContainerInventory | where Image == "ubuntu" and ContainerState == "Failed"
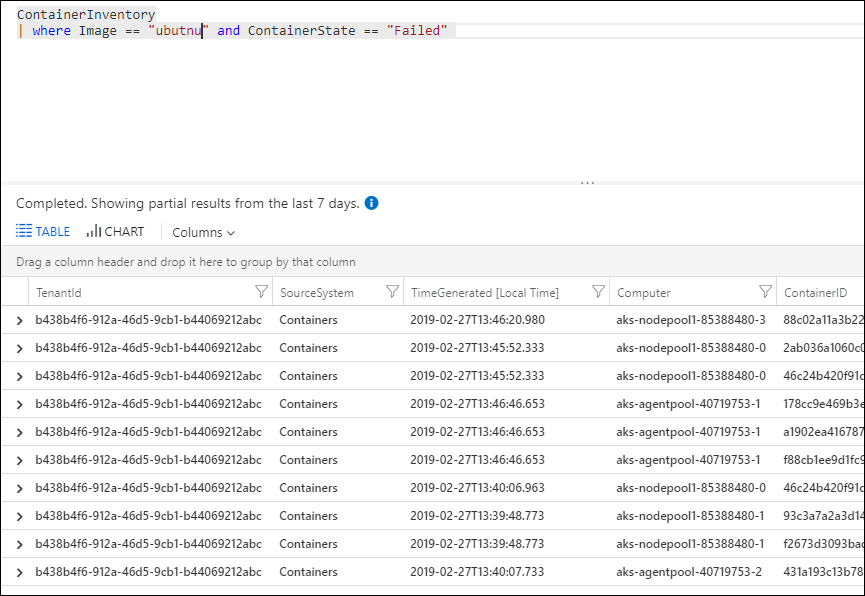
Expand any row in the results to view details for that container.

It's often useful to build queries starting with an example or two and then modifying them to fit your environment. As a starting point, you can experiment with the SAMPLE QUERIES area on the far right of the solution page, to help you build more advanced queries.

Saving queries is a standard feature in Azure Monitor. By saving them, you'll have those that you've found useful handy for future use.
After you create a query that you find useful, save it by clicking Favorites at the top of the Log Search page. Then you can easily access it later from the My Dashboard page.
To remove the Container Monitoring Solution, follow the instructions for removing solutions using one of the following: Azure portal, PowerShell, or Azure CLI
Query logs to view detailed container data records.