本文介绍如何创建和删除 Azure Monitor 工作区。 配置适用于 Prometheus 的 Azure Monitor 托管服务时,可以选择现有的 Azure Monitor 工作区或创建新的工作区。
注释
创建 Azure Monitor 工作区时,<azure-monitor-workspace-name> 形式的资源组中默认自动创建 MA_<azure-monitor-workspace-name>_<location>_managed 形式的数据收集规则和数据收集终结点。 如果有任何对资源或资源组名称有限制的 Azure 策略,请创建豁免,使这些资源不参与评估。
创建 Azure Monitor 工作区
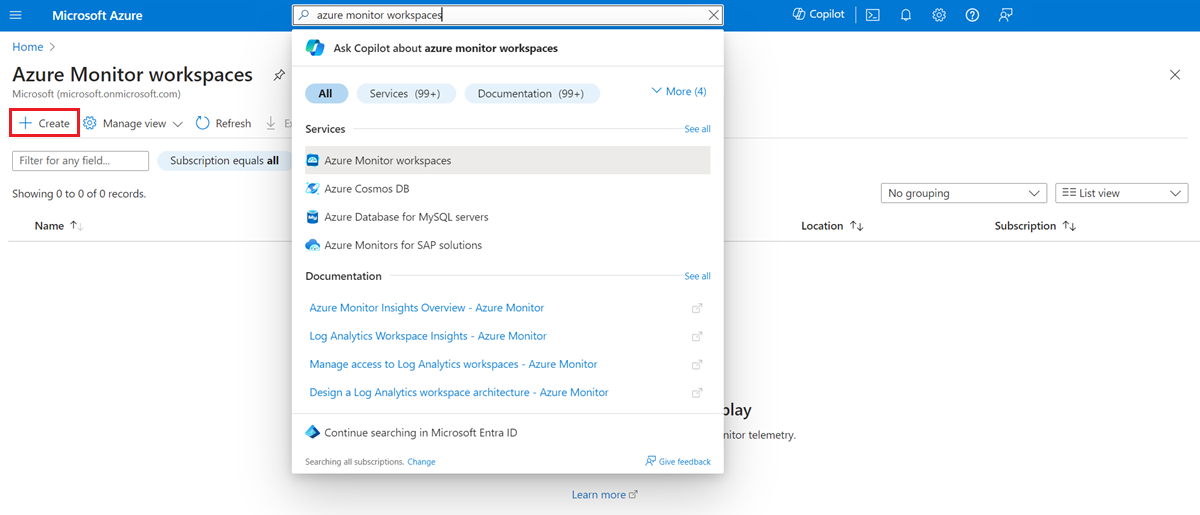
在 Azure 门户中打开“Azure Monitor 工作区”菜单。
选择 创建。
在“创建 Azure Monitor 工作区”页上,选择“订阅”和“资源组”以创建工作区。
提供工作区的名称和区域。
选择“查看 + 创建”以创建工作区。
通过 Azure CLI 使用以下命令创建 Azure Monitor 工作区。
az monitor account create --name <azure-monitor-workspace-name> --resource-group <resource-group-name> --location <location>
有关更多详细信息,请访问“适用于 Azure Monitor 工作区的 Azure CLI”
若要创建 Azure Monitor 工作区,请使用以下资源管理器模板之一和任何 标准部署选项。
{
    "$schema": "http://schema.management.azure.com/schemas/2019-04-01/deploymentTemplate.json#",
    "contentVersion": "1.0.0.0",
    "parameters": {
        "name": {
            "type": "string"
        },
        "location": {
            "type": "string",
            "defaultValue": ""
        }
    },
    "resources": [
        {
            "type": "microsoft.monitor/accounts",
            "apiVersion": "2021-06-03-preview",
            "name": "[parameters('name')]",
            "location": "[if(empty(parameters('location')), resourceGroup().location, parameters('location'))]"
        }
    ]
}
注释
$schema ARM 模板 (schema.management.azure.com) 中的值是 ARM 模板架构引用,而不是部署终结点。 对于由世纪互联运营的 Microsoft Azure,你无需进行更改。 若要部署到由世纪互联运营的Microsoft Azure,请在部署之前设置活动云:
az cloud set --name AzureChinaCloud
Azure Monitor 工作区已在世纪互联运营的 Microsoft Azure 中提供。 有关由世纪互联运营的 Microsoft Azure 中的网络终结点要求,请参阅监视 Kubernetes 集群的网络防火墙要求和Azure Monitor 终结点访问和防火墙配置。
@description('Specify the name of the workspace.')
param workspaceName string

@description('Specify the location for the workspace.')
param location string = resourceGroup().location

resource workspace 'microsoft.monitor/accounts@2021-06-03-preview' = {
  name: workspaceName
  location: location
}
创建 Azure Monitor 工作区时,会创建新的资源组。 资源组名称采用以下格式:MA_<azure-monitor-workspace-name>_<location>_managed,其中已标记化元素采用小写。 资源组包含一个数据收集终结点,以及一套与工作区同名的数据收集规则。 删除工作区时,会自动删除资源组及其资源。
若要将适用于 Prometheus 的 Azure Monitor 托管服务连接到 Azure Monitor 工作区,请参阅从 AKS 群集收集 Prometheus 指标
小窍门
建议为 Azure Monitor 工作区启用建议的警报,以监视引入限制和配额。 若要启用建议的警报,请参阅 此处。
访问模式
与 Log Analytics 工作区类似,Azure Monitor 工作区提供资源上下文访问模式,以便为查询工作区中的数据的用户启用更精细的 Azure RBAC 资源权限。 这具有以下优势:
- 用户不需要知道要查询哪些工作区来查询其查询范围限定为的指标
- 用户不需要直接访问存储其资源的指标的工作区
详细了解 如何管理工作区访问模式,请点击此处。
删除 Azure Monitor 工作区
删除 Azure Monitor 工作区时,与 Log Analytics 工作区不同的是,不会执行软删除操作。 工作区中的数据会立即删除,并且没有恢复选项。
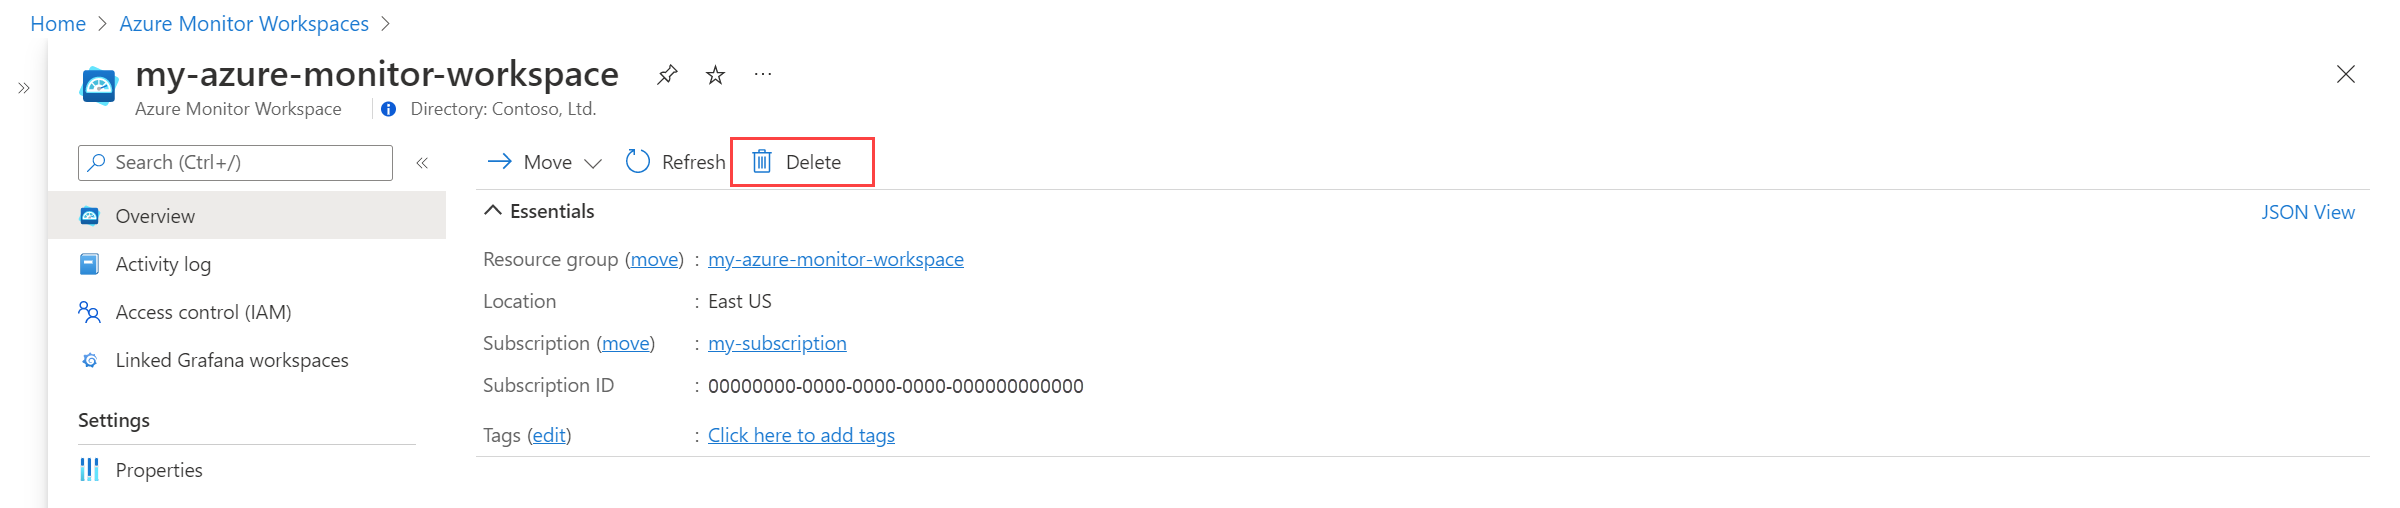
在 Azure 门户中打开“Azure Monitor 工作区”菜单。
选择工作区。
选择 删除。
若要删除 AzureMonitor 工作区,请使用 az resource delete
例如:
az monitor account delete --name <azure-monitor-workspace-name> --resource-group <resource-group-name>
有关更多详细信息,请访问“适用于 Azure Monitor 工作区的 Azure CLI”
链接 Grafana 工作区
将 Azure Monitor 工作区连接到 Azure 托管 Grafana 工作区,以允许 Grafana 在 Grafana 仪表板中使用 Azure Monitor 工作区数据。 Azure Monitor 工作区可以连接到多个 Grafana 工作区,而 Grafana 工作区可以连接到多个 Azure Monitor 工作区。 Azure 托管 Grafana 和 Azure Monitor 工作区可能位于不同区域。
若要将自我管理的 Grafana 实例链接到 Azure Monitor 工作区,请参阅将 Grafana 连接到 Azure Monitor Prometheus 指标
注释
将 Azure Monitor 工作区作为数据源添加到 Grafana 时,它将以 Prometheus_<azure monitor workspace query endpoint> 的形式列出。
- 在 Azure 门户中打开“Azure Monitor 工作区”菜单。
- 选择工作区。
- 选择“链接的 Grafana 工作区”。
- 选择 Grafana 工作区。
通过更新你所监视的 Azure Kubernetes 服务群集,在 Azure Monitor 工作区和 Grafana 工作区之间创建链接。
如果群集已配置为将数据发送到适用于 Prometheus 的 Azure Monitor 托管服务,则必须先使用以下命令禁用它:
az aks update --disable-azure-monitor-metrics -g <cluster-resource-group> -n <cluster-name>
然后,使用以下命令启用或重新启用:
az aks update --enable-azure-monitor-metrics -n <cluster-name> -g <cluster-resource-group> --azure-monitor-workspace-resource-id
<azure-monitor-workspace-name-resource-id> --grafana-resource-id <grafana-workspace-name-resource-id>
输出
"azureMonitorProfile": {
    "metrics": {
        "enabled": true,
        "kubeStateMetrics": {
            "metricAnnotationsAllowList": "",
            "metricLabelsAllowlist": ""
        }
    }
}
后续步骤

