本文提供了与使用 Microsoft Azure 中的 Application Insights 代码优化相关的故障排除步骤和信息。
故障排除清单
步骤 1:确保应用已连接到 Application Insights 资源
创建 Application Insights 资源并验证它是否已连接到正确的应用。
步骤 2:验证是否已启用 .NET Profiler
步骤 3:验证 .NET Profiler 是否正在收集性能概况
若要确保将概要文件上传到 Application Insights 资源,请执行以下步骤:
在 Azure 门户中,搜索并选择“Application Insights”。
从 Application Insights 资源列表中,选择你的资源的名称。
在 Application Insights 资源的左侧菜单中,选择“ 调查”,然后选择“ 性能”。
在 Application Insights 资源的“性能”页面上,选择“Profiler”:
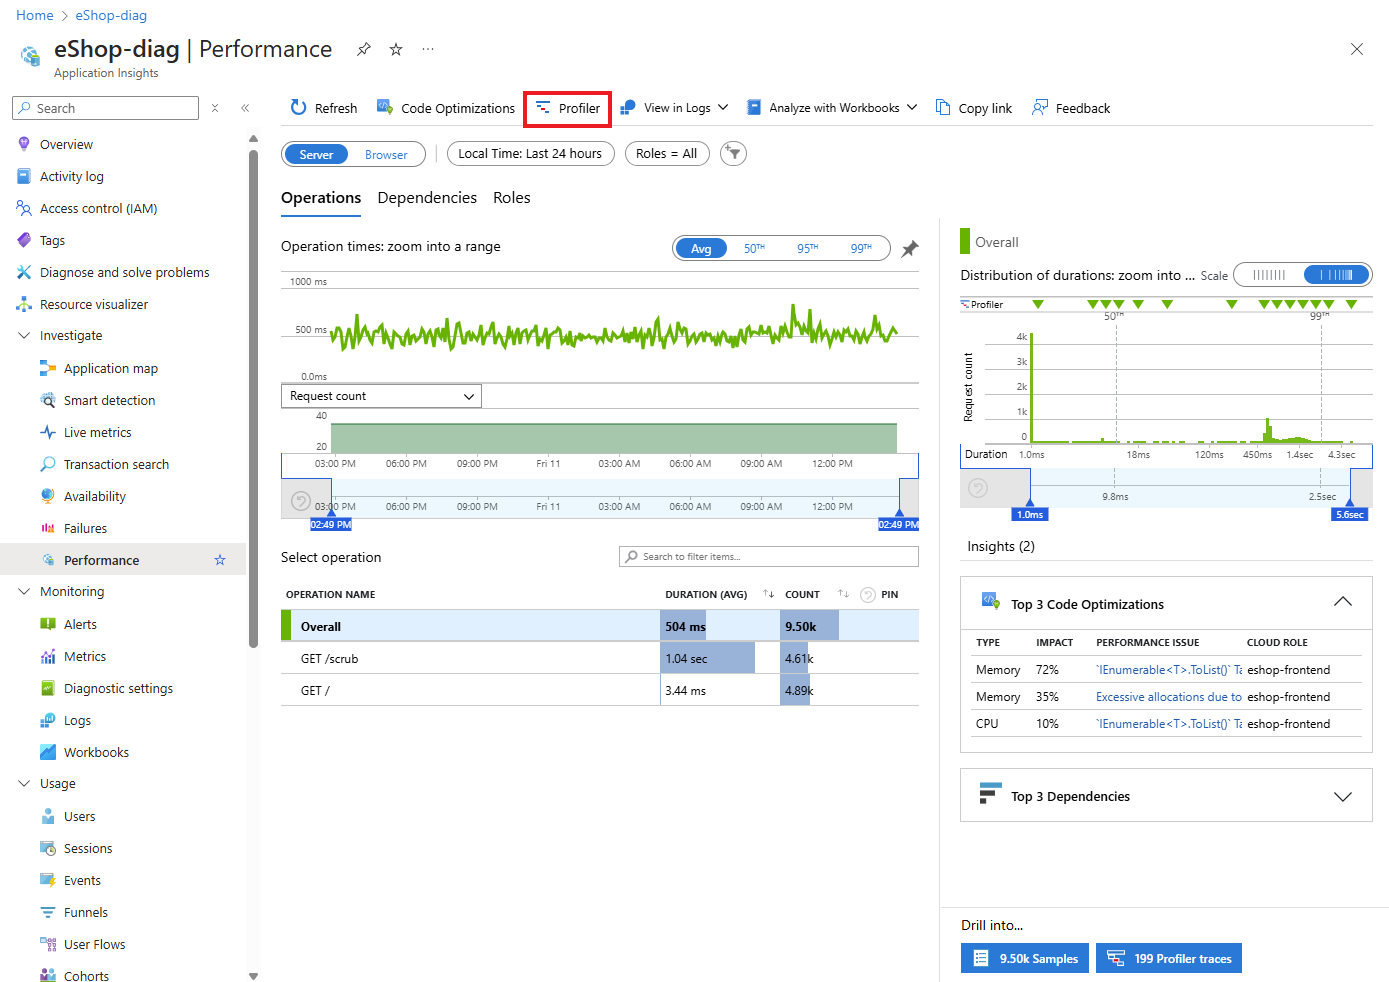
在 Application Insights Profiler 页上,查看 “最近分析会话 ”部分。
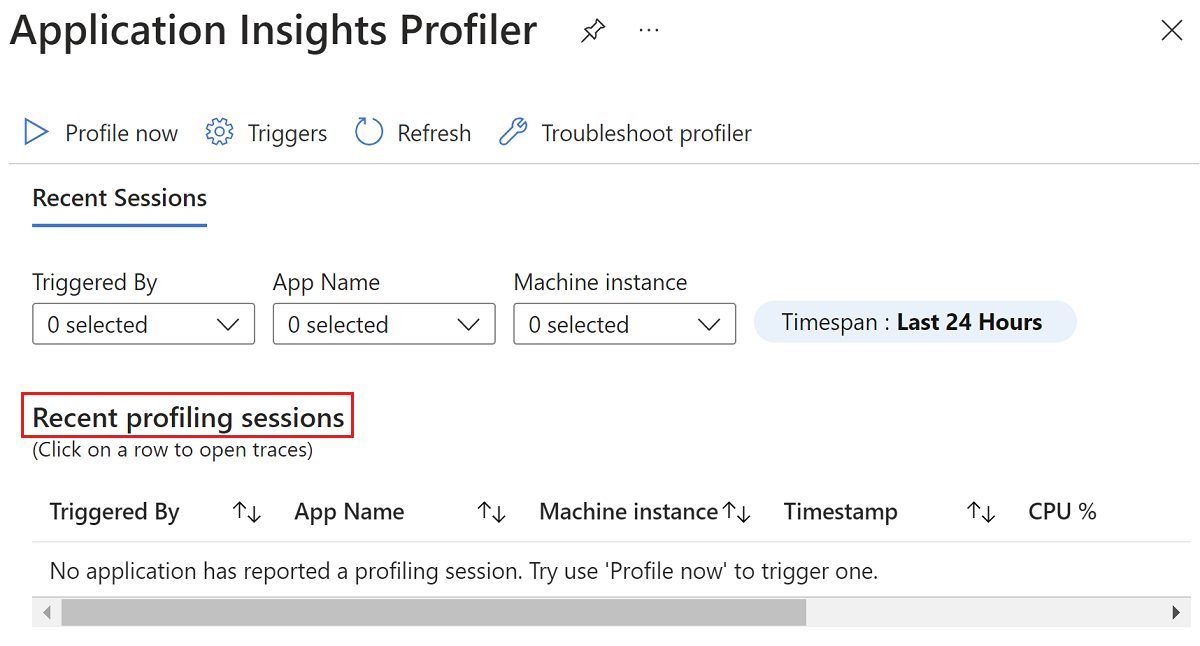
注释
如果未看到任何性能分析会话,请参阅对 Application Insights Profiler 进行故障排除。

步骤 4:定期检查分析器
成功完成前面的步骤后,请继续检查 Profiler 页以获取见解。 与此同时,该服务将继续分析您的个人资料,并在检测到代码中的任何问题时立即提供信息或见解。
启用 .NET Profiler 后,可能需要几个小时才能生成配置文件并由服务进行分析。 如果服务在你的代码中没有检测到任何问题,则会显示一条消息,确认没有发现任何见解。