可以为运行在容器中的 .NET 应用程序启用 Application Insights Profiler,几乎无需修改代码。 若要在容器实例上启用 .NET Profiler,需要:
- 添加对
Microsoft.ApplicationInsights.Profiler.AspNetCoreNuGet 包的引用。 - 更新代码以启用用于 .NET 的 Profiler。
- 设置 Application Insights 连接字符串。
在本文中,你会了解可以执行以下操作的各种方式:
- 在项目中安装 NuGet 包。
- 设置 环境变量。
- 了解有关生产部署的安全注意事项,例如保护 Application Insights 连接字符串。
先决条件
- Application Insights 资源。 记下连接字符串。
- Docker Desktop,用于生成 Docker 映像。
- 已安装 .NET 6 SDK。
设置环境
克隆并使用以下示例项目:
git clone https://github.com/microsoft/ApplicationInsights-Profiler-AspNetCore.git转到容器应用示例:
cd ApplicationInsights-Profiler-AspNetCore

cd examples/EnableServiceProfilerForContainerAppNet6
此示例是通过调用以下 CLI 命令创建的基本功能项目:
dotnet new mvc -n EnableServiceProfilerForContainerApp文件存在
Controllers/WeatherForecastController.cs延迟来模拟瓶颈。[HttpGet(Name = "GetWeatherForecast")] public IEnumerable<WeatherForecast> Get() { SimulateDelay(); ... // Other existing code. } private void SimulateDelay() { // Delay for 500ms to 2s to simulate a bottleneck. Thread.Sleep((new Random()).Next(500, 2000)); }添加用于收集 .NET Profiler 跟踪的 NuGet 包:
dotnet add package Microsoft.ApplicationInsights.Profiler.AspNetCore启用 Application Insights 和 .NET Profiler。
在
builder.Services.AddApplicationInsightsTelemetry()中的builder.Services.AddServiceProfiler()方法后面添加WebApplication.CreateBuilder()和Program.cs:var builder = WebApplication.CreateBuilder(args); builder.Services.AddApplicationInsightsTelemetry(); // Add this line of code to enable Application Insights. builder.Services.AddServiceProfiler(); // Add this line of code to enable Profiler builder.Services.AddControllersWithViews(); var app = builder.Build();有关自定义设置,请参阅 “自定义 Application Insights Profiler”。
拉取最新的 ASP.NET Core 构建/运行时映像
转到 .NET Core 6.0 示例目录:
cd examples/EnableServiceProfilerForContainerAppNet6拉取最新的 ASP.NET Core 映像:
docker pull mcr.microsoft.com/dotnet/sdk:6.0
docker pull mcr.microsoft.com/dotnet/aspnet:6.0
添加 Application Insights 密钥
在 Azure 门户中,打开 Application Insights 资源。 在“概述”页中,记下 Application Insights 连接字符串。
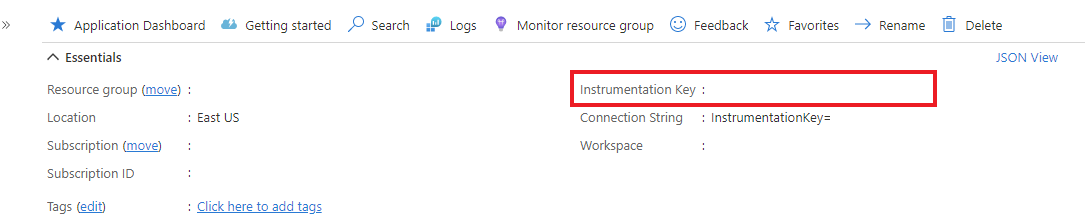
打开
appsettings.json并将您的 Application Insights 连接字符串添加到此代码部分:{ "ApplicationInsights": { "InstrumentationKey": "Your connection string" } }

生成并运行 Docker 映像
查看 Docker 文件。
生成示例映像:
docker build -t profilerapp .运行容器:
docker run -d -p 8080:80 --name testapp profilerapp
通过浏览器查看容器
若要命中终结点,有两个选项:
在浏览器中,访问
http://localhost:8080/weatherforecast。使用 curl:
curl http://localhost:8080/weatherforecast
检查日志
(可选)检查本地日志,查看探查会话是否已完成:
docker logs testapp
在本地日志中,请注意以下事件:
Starting application insights profiler with connection string: your-connection string # Double check the connection string
Service Profiler session started.               # Profiler started.
Finished calling trace uploader. Exit code: 0   # Uploader is called with exit code 0.
Service Profiler session finished.              # A profiling session is completed.
故障排除
如果在应用程序中无法查找跟踪,建议按照本故障排除指南中的步骤操作。
查看 .NET Profiler 跟踪
等待 2 到 5 分钟,以便可以将事件聚合到 Application Insights。
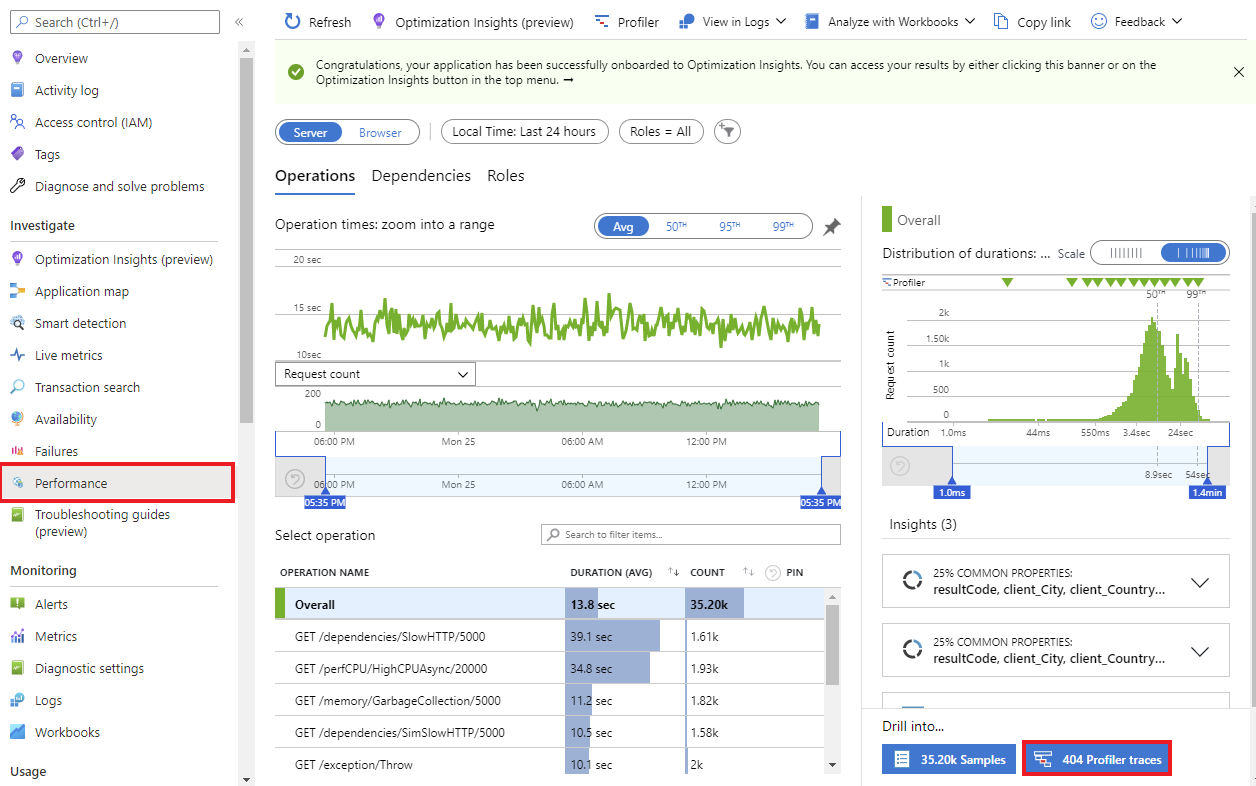
在 Azure 门户中,打开 Application Insights 资源。 在左侧菜单中,选择“ 调查>性能”。
跟踪过程完成后,将显示“Profiler 跟踪”按钮。

清理资源
运行以下命令停止示例项目:
docker rm -f testapp