图形可视化效果Graph visualizations
工作簿支持根据日志中的数据可视化任意图形,以显示监视实体之间的关系。Workbooks support visualizing arbitrary graphs based on data from logs to show the relationships between monitoring entities.
下图显示了通过各种端口从一台计算机流入/流出外部计算机的数据。The graph below show data flowing in/out of a computer via various ports to/from external computers. 这些数据按类型(计算机、端口与外部 IP)以不同的颜色显示,边缘大小对应于不同计算机之间的流动数据量。It is colored by type (computer vs. port vs. external IP) and the edge sizes correspond to the amount of data flowing in-between. 基础数据来自针对 VM 连接的 KQL 查询。The underlying data comes from KQL query targeting VM connections.
添加图形Adding a graph
单击“编辑”工具栏项,将工作簿切换到编辑模式。Switch the workbook to edit mode by clicking on the Edit toolbar item.
使用“添加查询”链接将日志查询控件添加到工作簿。Use the Add query link to add a log query control to the workbook.
选择“日志”作为查询类型,并选择资源类型(例如 Application Insights)以及目标资源。Select the query type as Log, resource type (for example, Application Insights) and the resources to target.
使用查询编辑器输入用于分析的 KQL。Use the Query editor to enter the KQL for your analysis.
let data = dependencies | summarize Calls = count() by App = appName, Request = operation_Name, Dependency = name | extend RequestId = strcat(App, '::', Request); let links = data | summarize Calls = sum(Calls) by App, RequestId | project SourceId = App, TargetId = RequestId, Calls, Kind = 'App -> Request' | union (data | project SourceId = RequestId, TargetId = Dependency, Calls, Kind = 'Request -> Dependency'); let nodes = data | summarize Calls = sum(Calls) by App | project Id = App, Name = App, Calls, Kind = 'App' | union (data | summarize Calls = sum(Calls) by RequestId, Request | project Id = RequestId, Name = Request, Calls, Kind = 'Request') | union (data | summarize Calls = sum(Calls) by Dependency | project Id = Dependency, Name = Dependency, Calls, Kind = 'Dependency'); nodes | union (links)
将可视化效果设置为“图形”Set the visualization to Graph
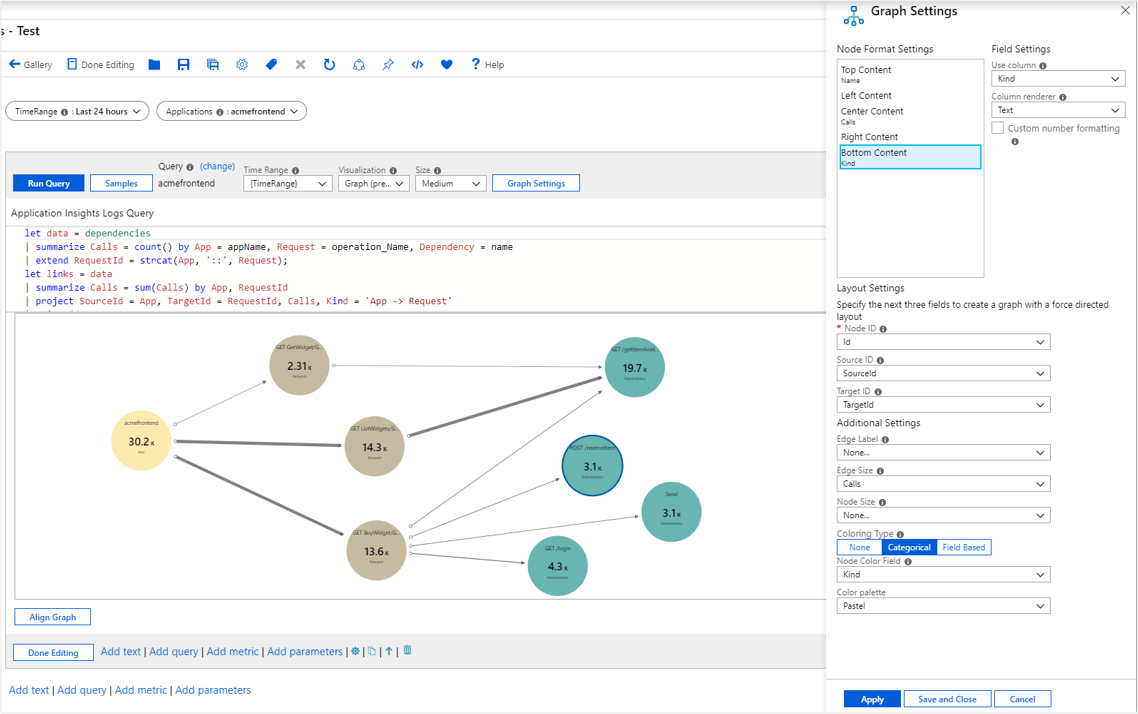
选择“图形设置”按钮打开“设置”窗格Select the Graph Settings button to open the settings pane
在底部的“布局字段”中,设置:In Layout Fields at the bottom, set:
- 节点 ID:
Id
Node Id:Id
- 源 ID:
SourceId
Source Id:SourceId
- 目标 ID:
TargetId
Target Id:TargetId
- 边缘标签:
None
Edge Label:None
- 边缘大小:
Calls
Edge Size:Calls
- 节点大小:
None
Node Size:None
- 着色类型:
Categorical
Coloring Type:Categorical
- 节点颜色字段:
Kind
Node Color Field:Kind
- 调色板:
Pastel
Color palette:Pastel
- 节点 ID:
在顶部的“节点格式设置”中,设置:In Node Format Settings at the top, set:
- 使内容靠上 - 使用列:
Name
,列呈现器:Text
Top Content- Use Column:Name
, Column Renderer:Text
- 使内容居中 - 使用列:
Calls
,列呈现器:Big Number
,调色板:None
Center Content- Use Column:Calls
, Column Renderer:Big Number
, Color Palette:None
- 使内容靠下 - 使用列:
Kind
,列呈现器:Text
Bottom Content- Use Column:Kind
, Column Renderer:Text
- 使内容靠上 - 使用列:
选择窗格底部的“保存并关闭”按钮。Select the Save and Close button at the bottom of the pane.
图形设置Graph settings
设置Setting | 说明Explanation |
---|---|
Node Id |
选择提供图形上节点的唯一 ID 的列。Selects a column that provides the unique ID of nodes on the graph. 列的值可以是字符串或数字。Value of the column can be string or a number. |
Source Id |
选择为图形上的边缘提供源节点 ID 的列。Selects a column that provides the IDs of source nodes for edges on the graph. 值必须映射到节点 ID 列中的值。Values must map to a value in the Node Id column. |
Target Id |
选择为图形上的边缘提供目标节点 ID 的列。Selects a column that provides the IDs of target nodes for edges on the graph. 值必须映射到节点 ID 列中的值。Values must map to a value in the Node Id column. |
Edge Label |
选择在图形上提供边缘标签的列。Selects a column that provides edge labels on the graph. |
Edge Size |
选择提供指标宽度所基于的指标的列。Selects a column that provides the metric on which the edge widths will be based on. |
Node Size |
选择提供节点区域所基于的指标的列。Selects a column that provides the metric on which the node areas will be based on. |
Coloring Type |
用于选择节点着色方案。Used to choose the node coloring scheme. |
节点着色类型Node coloring types
着色类型Coloring Type | 说明Explanation |
---|---|
None |
所有节点都具有相同的颜色。All nodes have the same color. |
Categorical |
根据结果集中某列的值或类别为节点分配颜色。Nodes are assigned colors based on the value or category from a column in the result set. 在上述示例中,着色基于结果集的列“Kind”。In the example above, the coloring is based on the column Kind of the result set. 支持的调色板为 Default 、Pastel 和 Cool tone 。Supported palettes are Default , Pastel , and Cool tone . |
Field Based |
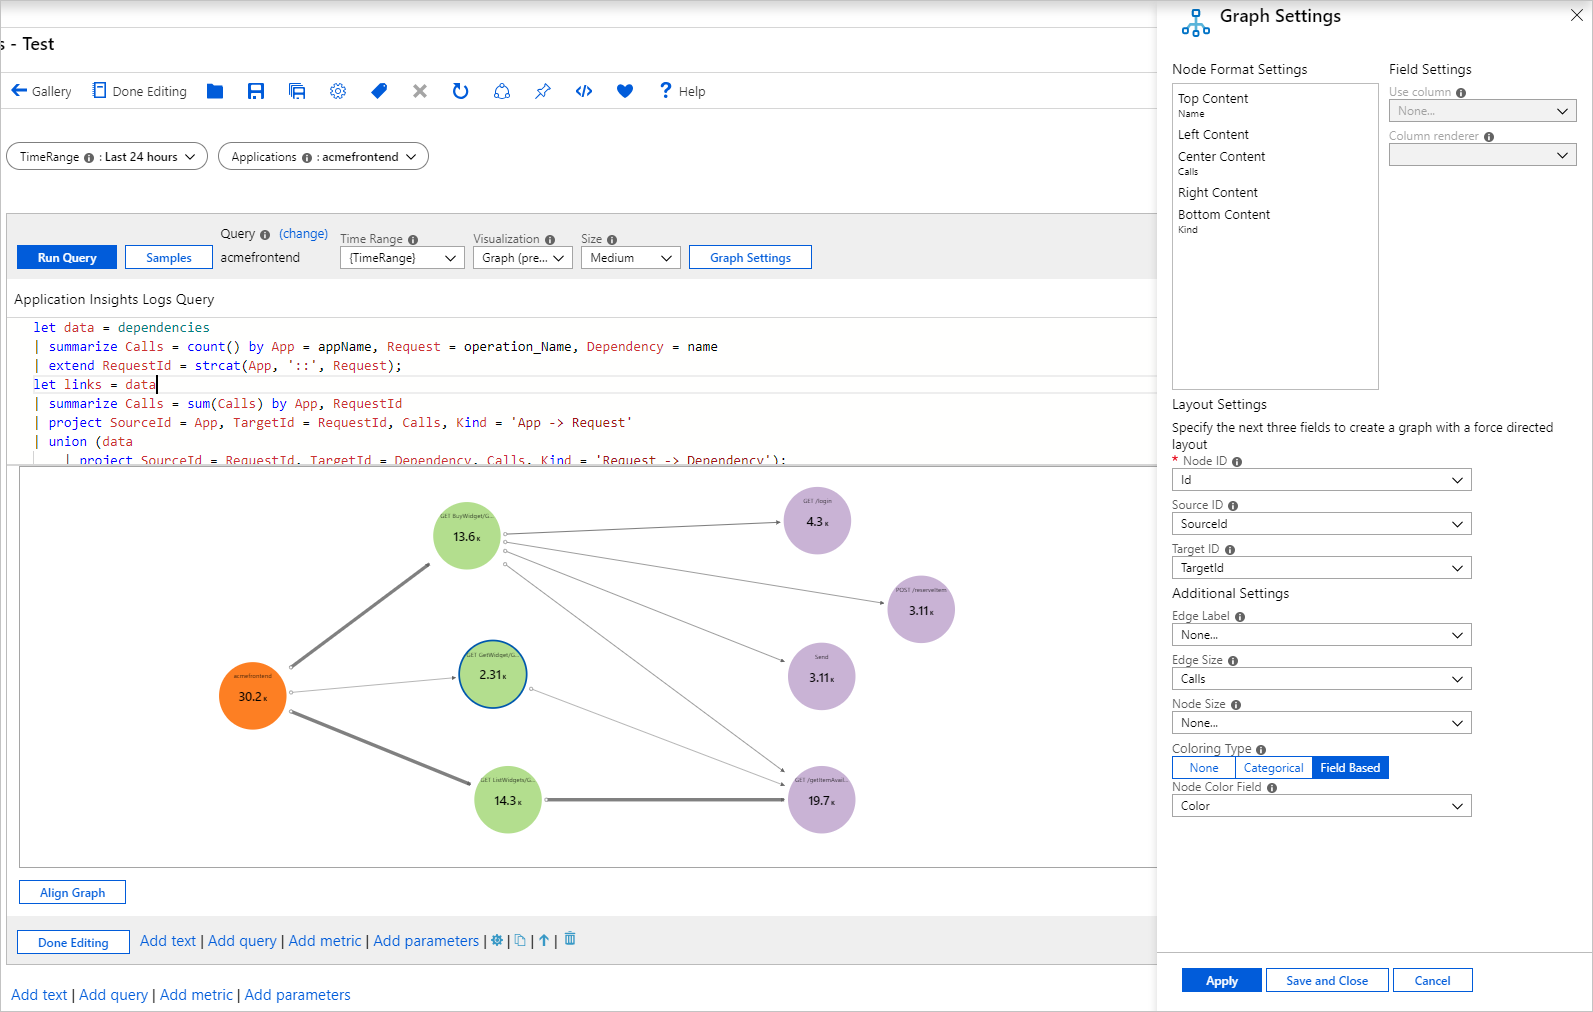
在此类型中,列提供要用于节点的特定 RGB 值。In this type, a column provides specific RGB values to use for the node. 提供最大灵活性,但通常需要做更多工作才能实现。Provides the most flexibility but usually requires more work to enable. |
节点格式设置Node format settings
图形创建者可以指定节点不同部分(顶部、左侧、中心、右侧和底部)的内容。Graphs authors can specify what content goes to the different parts of a node: top, left, center, right, and bottom. 图形可以自由使用工作簿支持的任何呈现器(文本、大数字、走势图、图标等)。Graphs can use any of renderers workbooks supports (text, big number, spark lines, icon, etc.).
基于字段的节点着色Field based node coloring
单击“编辑”工具栏项,将工作簿切换到编辑模式。Switch the workbook to edit mode by clicking on the Edit toolbar item.
使用“添加查询”链接将日志查询控件添加到工作簿。Use the Add query link to add a log query control to the workbook.
选择“日志”作为查询类型,并选择资源类型(例如 Application Insights)以及目标资源。Select the query type as Log, resource type (for example, Application Insights), and the resources to target.
使用查询编辑器输入用于分析的 KQL。Use the Query editor to enter the KQL for your analysis.
let data = dependencies | summarize Calls = count() by App = appName, Request = operation_Name, Dependency = name | extend RequestId = strcat(App, '::', Request); let links = data | summarize Calls = sum(Calls) by App, RequestId | project SourceId = App, TargetId = RequestId, Calls, Kind = 'App -> Request' | union (data | project SourceId = RequestId, TargetId = Dependency, Calls, Kind = 'Request -> Dependency'); let nodes = data | summarize Calls = sum(Calls) by App | project Id = App, Name = App, Calls, Color = 'FD7F23' | union (data | summarize Calls = sum(Calls) by RequestId, Request | project Id = RequestId, Name = Request, Calls, Color = 'B3DE8E') | union (data | summarize Calls = sum(Calls) by Dependency | project Id = Dependency, Name = Dependency, Calls, Color = 'C9B3D5'); nodes | union (links)
将可视化效果设置为“图形”Set the visualization to Graph
选择“图形设置”按钮打开“设置”窗格。Select the Graph Settings button to open the settings pane.
在底部的“布局字段”中,设置:In Layout Fields at the bottom, set:
- 节点 ID:
Id
Node Id:Id
- 源 ID:
SourceId
Source Id:SourceId
- 目标 ID:
TargetId
Target Id:TargetId
- 边缘标签:
None
Edge Label:None
- 边缘大小:
Calls
Edge Size:Calls
- 节点大小:
Node
Node Size:Node
- 着色类型:
Field Based
Coloring Type:Field Based
- 节点颜色字段:
Color
Node Color Field:Color
- 节点 ID:
在顶部的“节点格式设置”中,输入以下内容。In Node Format Settings at the top, enter the following.
- 在“顶部内容集”中,设置以下项:In Top Content, set:
- 使用列:
Name
。Use Column:Name
. - 列呈现器:
Text
。Column renderer:Text
.
- 使用列:
- 在“中心内容”中,设置以下项:In Center Content, set:
- 使用列:
Calls
Use column:Calls
- 列呈现器:
Big Number
Column Renderer:Big Number
- 调色板:
None
Color palette:None
- 使用列:
- 在“底部内容”中,设置以下项:In Bottom Content, set:
- 使用列:
Kind
Use column:Kind
- 列呈现器:
Text
。Column renderer:Text
.
- 使用列:
- 在“顶部内容集”中,设置以下项:In Top Content, set:
选择窗格底部的“保存并关闭”按钮。Select the Save and Close button at the bottom of the pane.
后续步骤Next steps
- 图形也支持复合条呈现器。Graphs also support Composite bar renderer. 若要了解详细信息,请访问复合条文档。To learn more visit the Composite Bar documentation.
- 详细了解可在工作簿中使用的数据源。Learn more about the data sources you can use in workbooks.