函数 kmeans_dynamic_fl() 是一种 UDF(用户定义的函数),它使用 k-means 算法对数据集进行聚类化。 此函数类似于 kmeans_fl(),只不过特征由单个数值数组列提供,而不是由多个标量列提供。
先决条件
- 必须在群集上启用 Python 插件。 这是函数中使用的内联 Python 所必需的。
语法
T | invoke kmeans_dynamic_fl(k, features_col, cluster_col)
详细了解语法约定。
参数
| 客户 | 类型 | 必需 | 说明 |
|---|---|---|---|
| k | int |
✔️ | 群集数。 |
| features_col | string |
✔️ | 包含要用于聚类分析的特征的数值数组的列的名称。 |
| cluster_col | string |
✔️ | 存储每个记录的输出群集 ID 的列的名称。 |
函数定义
可以通过将函数的代码嵌入为查询定义的函数,或将其创建为数据库中的存储函数来定义函数,如下所示:
使用以下 let 语句定义函数。 不需要任何权限。
let kmeans_dynamic_fl=(tbl:(*),k:int, features_col:string, cluster_col:string)
{
    let kwargs = bag_pack('k', k, 'features_col', features_col, 'cluster_col', cluster_col);
    let code = ```if 1:

        from sklearn.cluster import KMeans

        k = kargs["k"]
        features_col = kargs["features_col"]
        cluster_col = kargs["cluster_col"]

        df1 = df[features_col].apply(np.array)
        matrix = np.vstack(df1.values)
        kmeans = KMeans(n_clusters=k, random_state=0)
        kmeans.fit(matrix)
        result = df
        result[cluster_col] = kmeans.labels_
    ```;
    tbl
    | evaluate python(typeof(*),code, kwargs)
};
// Write your query to use the function here.
示例
以下示例使用 invoke 运算符运行函数。
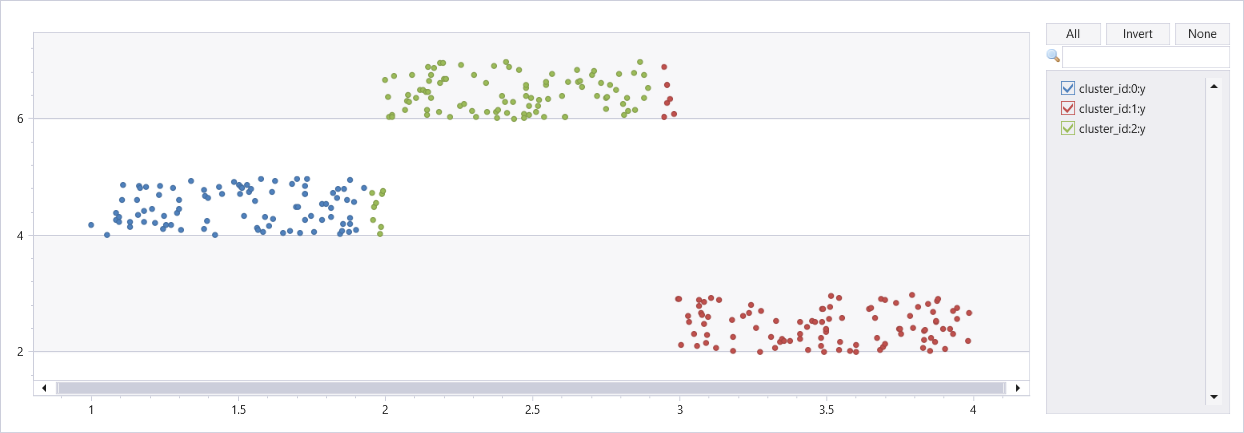
有三个群集的人工数据集群集
若要使用查询定义的函数,请在嵌入的函数定义后调用它。
let kmeans_dynamic_fl=(tbl:(*),k:int, features_col:string, cluster_col:string)
{
    let kwargs = bag_pack('k', k, 'features_col', features_col, 'cluster_col', cluster_col);
    let code = ```if 1:

        from sklearn.cluster import KMeans

        k = kargs["k"]
        features_col = kargs["features_col"]
        cluster_col = kargs["cluster_col"]

        df1 = df[features_col].apply(np.array)
        matrix = np.vstack(df1.values)
        kmeans = KMeans(n_clusters=k, random_state=0)
        kmeans.fit(matrix)
        result = df
        result[cluster_col] = kmeans.labels_
    ```;
    tbl
    | evaluate python(typeof(*),code, kwargs)
};
union
(range x from 1 to 100 step 1 | extend x=rand()+3, y=rand()+2),
(range x from 101 to 200 step 1 | extend x=rand()+1, y=rand()+4),
(range x from 201 to 300 step 1 | extend x=rand()+2, y=rand()+6)
| project Features=pack_array(x, y), cluster_id=int(null)
| invoke kmeans_dynamic_fl(3, "Features", "cluster_id")
| extend x=toreal(Features[0]), y=toreal(Features[1])
| render scatterchart with(series=cluster_id)
