使用 “版本 ”下拉列表切换服务。 了解有关导航的详细信息。
适用于:✅ Azure Data Explorer
使用图形数据中的 Plotly 创建交互式图形可视化效果。
该函数 plotly_graph_fl() 是 用户定义的函数(UDF), 可用于自定义 绘图 模板以创建交互式图形可视化效果。
先决条件
- 必须在 群集上启用 Python 插件。 这是函数中使用的内联 Python 所必需的。
该函数接受具有可自定义列映射和外观设置的单独节点和边缘表,并返回包含 绘图 JSON 的单个单元格表。 (可选)可以在Azure Data Explorer仪表板磁贴中呈现数据。 有关详细信息,请参阅 Plotly (预览版)。
该函数可用于可视化网络关系、网络安全攻击路径、组织结构或任何可表示为图形的连接数据。 生成的可视化效果包括悬停信息、基于连接的节点大小以及使用 Python 的 NetworkX 库进行图形布局计算的可自定义配色方案,以及用于呈现交互式可视化效果的 Plotly。
Syntax
plotly_graph_fl(
edges, nodes, [node_id_column], [source_id_column], [target_id_column], [colorscale_id], [diagram_title])
详细了解语法约定。
参数
| Name | 类型 | 必选 | Description |
|---|---|---|---|
| 边缘 | 表格式的 | ✔️ | 包含具有源节点和目标节点标识符的边缘数据的表。 |
| 节点 | 表格式的 | ✔️ | 包含具有唯一节点标识符和可选属性的节点数据的表。 |
| node_id_column | string |
包含节点表中唯一节点标识符的列的名称。 默认值为 "nodeId"。 |
|
| source_id_column | string |
列的名称,其中包含边缘表中的源节点标识符。 默认值为 "sourceId"。 |
|
| target_id_column | string |
列的名称,其中包含边缘表中的目标节点标识符。 默认值为 "targetId"。 |
|
| colorscale_id | string |
要用于节点颜色的绘图色阶。 可用选项包括“Viridis”、“等离子”、“Inferno”、“Magma”、“Cividis”、“YlGnBu”等。默认值为 "Cividis". |
|
| diagram_title | string |
要显示在图形可视化效果顶部的标题。 默认值为 "Simple Graph for educational purposes"。 |
函数定义
可以通过将函数代码嵌入为查询定义的函数,或将其创建为数据库中的存储函数来定义函数,如下所示:
使用以下 let 语句定义函数。 不需要任何权限。
let plotly_graph_fl = (
    edges:(*), nodes:(*),
    node_id_column:string="nodeId",
    source_id_column:string="sourceId", target_id_column:string="targetId",
    colorscale_id:string="Cividis", diagram_title:string="Simple Graph for educational purposes") {
let pythonCodeBlueprint = ```
import numpy as np
import pandas as pd
import plotly.graph_objects as go
import networkx as nx

# Configuration constants from parameters with defaults
NODE_OR_EDGE_COLUMN = kargs.get("node_or_edge_column", "tableName")
NODE_ROW = kargs.get("node_row", "V")
NODE_ID_COLUMN = kargs.get("node_id_column", "nodeId")
EDGE_ROW = kargs.get("edge_row", "E")
SOURCE_ID_COLUMN = kargs.get("source_id_column", "sourceId")
TARGET_ID_COLUMN = kargs.get("target_id_column", "targetId")
COLORSCALE_ID = kargs.get("colorscale_id", "YlGnBu")  # see https://plotly.com/python/builtin-colorscales/
DIAGRAM_TITLE = kargs.get("diagram_title", "Network Graph Visualization")


def is_valid_value(value):
    """
    Check if a value is valid (not None, not empty string, not all NaN).

    Args:
        value: Value to check

    Returns:
        bool: True if value is valid, False otherwise
    """
    if value is None or (isinstance(value, str) and value == ''):
        return False

    # Handle arrays/series safely
    if hasattr(value, '__len__') and not isinstance(value, str):
        try:
            na_result = pd.isna(value)
            return not (hasattr(na_result, 'all') and na_result.all()) and not na_result
        except (TypeError, ValueError):
            return True

    return not pd.isna(value)


def create_properties_dict(row):
    """
    Create a properties dictionary from a pandas Series, filtering out invalid values.

    Args:
        row (pd.Series): Row containing properties

    Returns:
        dict: Filtered properties dictionary
    """
    return {k: v for k, v in row.items() if is_valid_value(v)}


def build_graph(dataframe):
    """
    Build a NetworkX graph from a dataframe containing nodes and edges.

    Args:
        dataframe (pd.DataFrame): DataFrame with node and edge data

    Returns:
        nx.Graph: Constructed graph
    """
    graph = nx.Graph()

    # Separate and process nodes and edges efficiently
    nodes_df = dataframe[dataframe[NODE_OR_EDGE_COLUMN] == NODE_ROW]
    edges_df = dataframe[dataframe[NODE_OR_EDGE_COLUMN] == EDGE_ROW]

    # Add nodes
    if not nodes_df.empty:
        for _, row in nodes_df.iterrows():
            graph.add_node(row[NODE_ID_COLUMN], size=1,
                          properties=create_properties_dict(row))

    # Add edges
    if not edges_df.empty:
        for _, row in edges_df.iterrows():
            graph.add_edge(row[SOURCE_ID_COLUMN], row[TARGET_ID_COLUMN],
                          weight=1, properties=create_properties_dict(row))

    return graph


def create_edge_traces(graph, positions):
    """
    Create Plotly traces for graph edges and their midpoint markers.

    Args:
        graph (nx.Graph): NetworkX graph
        positions (dict): Node positions from layout algorithm

    Returns:
        tuple: (edge_trace, mnode_trace) - Plotly scatter traces
    """
    edge_x, edge_y = [], []
    mnode_x, mnode_y, mnode_txt = [], [], []

    # Process all edges efficiently
    for source, target, edge_data in graph.edges(data=True):
        x0, y0 = positions[source]
        x1, y1 = positions[target]

        # Add edge coordinates (with None separator for line breaks)
        edge_x.extend([x0, x1, None])
        edge_y.extend([y0, y1, None])

        # Create hover text for edge midpoint
        properties = edge_data.get('properties', {})
        valid_props = {k: v for k, v in properties.items() if is_valid_value(v)}

        prop_text = '<br>'.join(f'{key}: {value}' for key, value in valid_props.items())
        text = f'source: {source} destination: {target}<br>Properties: {prop_text}'

        # Add midpoint coordinates and text
        mnode_x.append((x0 + x1) * 0.5)
        mnode_y.append((y0 + y1) * 0.5)
        mnode_txt.append(text)

    # Create traces
    edge_trace = go.Scatter(
        x=edge_x, y=edge_y,
        line=dict(width=0.5, color='#888'),
        hoverinfo='none', mode='lines'
    )

    mnode_trace = go.Scatter(
        x=mnode_x, y=mnode_y, text=mnode_txt,
        mode="markers", hoverinfo='text', opacity=0.5,
        marker=dict(color='LightSkyBlue', size=2, line_width=1)
    )

    return edge_trace, mnode_trace


def create_node_trace(graph, positions):
    """
    Create Plotly trace for graph nodes.

    Args:
        graph (nx.Graph): NetworkX graph
        positions (dict): Node positions from layout algorithm

    Returns:
        go.Scatter: Plotly scatter trace for nodes
    """
    nodes_list = list(graph.nodes())
    num_nodes = len(nodes_list)
    inv_num_nodes = 1.0 / num_nodes if num_nodes > 0 else 0

    # Extract coordinates and calculate metrics
    node_x = [positions[node][0] for node in nodes_list]
    node_y = [positions[node][1] for node in nodes_list]

    node_adjacencies = []
    node_text = []
    node_sizes = []

    for node in nodes_list:
        num_connections = len(graph[node])
        node_adjacencies.append(num_connections)
        node_sizes.append(10 + num_connections * inv_num_nodes)

        # Create hover text
        node_properties = graph.nodes[node].get('properties', {})
        valid_props = {k: v for k, v in node_properties.items() if is_valid_value(v)}

        prop_text = '<br>'.join(f'{key}: {value}' for key, value in valid_props.items())
        text = f'# of connections: {num_connections}<br>Properties: {prop_text}'
        node_text.append(text)

    return go.Scatter(
        x=node_x, y=node_y, text=node_text,
        mode='markers', hoverinfo='text',
        marker=dict(
            colorscale=COLORSCALE_ID,
            color=node_adjacencies, size=node_sizes,
            line=dict(width=2, color='#888')
        )
    )


def create_plotly_figure(graph):
    """
    Create a complete Plotly figure from a NetworkX graph.

    Args:
        graph (nx.Graph): NetworkX graph to visualize

    Returns:
        go.Figure: Complete Plotly figure
    """
    # Calculate layout
    positions = nx.layout.spring_layout(graph)

    # Create traces
    edge_trace, mnode_trace = create_edge_traces(graph, positions)
    node_trace = create_node_trace(graph, positions)

    # Create figure
    return go.Figure(
        data=[edge_trace, node_trace, mnode_trace],
        layout=go.Layout(
            title=f'<br>{DIAGRAM_TITLE}<br>',
            showlegend=False, hovermode='closest',
            margin=dict(b=20, l=5, r=5, t=40),
            annotations=[dict(
                text="Created using plotly, networkx and the python plugin of Kusto",
                showarrow=False, xref="paper", yref="paper",
                x=0.005, y=-0.002
            )],
            xaxis=dict(showgrid=False, zeroline=False, showticklabels=False),
            yaxis=dict(showgrid=False, zeroline=False, showticklabels=False)
        )
    )


# Main execution
graph = build_graph(df)
figure = create_plotly_figure(graph)
plotly_obj = figure.to_json()
result = pd.DataFrame(data=[plotly_obj], columns=['plotly'])
```;
let E = view() { edges };
let V = view() { nodes };
union withsource=tableName E, V
| evaluate python(
//
typeof(plotly:string),
pythonCodeBlueprint,
// Parameter configuration for graph visualization
// Customize these values to adapt the visualization to your data schema and preferences
bag_pack(
    // Data schema mapping - configure these based on your data structure
    'node_or_edge_column', 'tableName',    // Column that distinguishes nodes from edges (source table name)
    'node_row', 'V',                       // Value in discriminator column identifying node records
    'node_id_column', node_id_column,            // Column containing unique node identifiers
    'edge_row', 'E',                       // Value in discriminator column identifying edge records
    'source_id_column', source_id_column,        // Column containing source node IDs for edges
    'target_id_column', target_id_column,        // Column containing target node IDs for edges
    // Visualization appearance settings
    'colorscale_id', colorscale_id,            // Plotly colorscale: YlGnBu, Viridis, Plasma, Inferno, Magma, Cividis, etc.
    'diagram_title', diagram_title    // Title displayed at the top of the graph visualization
))
};
// Write your query to use the function here.
Example
若要使用查询定义的函数,请调用嵌入的函数定义之后。
let plotly_graph_fl = (
edges:(*), nodes:(*),
node_id_column:string="nodeId",
source_id_column:string="sourceId", target_id_column:string="targetId",
colorscale_id:string="Cividis", diagram_title:string="Simple Graph for educational purposes") {
let pythonCodeBlueprint = ```
import numpy as np
import pandas as pd
import plotly.graph_objects as go
import networkx as nx
# Configuration constants from parameters with defaults
NODE_OR_EDGE_COLUMN = kargs.get("node_or_edge_column", "tableName")
NODE_ROW = kargs.get("node_row", "V")
NODE_ID_COLUMN = kargs.get("node_id_column", "nodeId")
EDGE_ROW = kargs.get("edge_row", "E")
SOURCE_ID_COLUMN = kargs.get("source_id_column", "sourceId")
TARGET_ID_COLUMN = kargs.get("target_id_column", "targetId")
COLORSCALE_ID = kargs.get("colorscale_id", "YlGnBu") # see https://plotly.com/python/builtin-colorscales/
DIAGRAM_TITLE = kargs.get("diagram_title", "Network Graph Visualization")
def is_valid_value(value):
"""
Check if a value is valid (not None, not empty string, not all NaN).
Args:
value: Value to check
Returns:
bool: True if value is valid, False otherwise
"""
if value is None or (isinstance(value, str) and value == ''):
return False
# Handle arrays/series safely
if hasattr(value, '__len__') and not isinstance(value, str):
try:
na_result = pd.isna(value)
return not (hasattr(na_result, 'all') and na_result.all()) and not na_result
except (TypeError, ValueError):
return True
return not pd.isna(value)
def create_properties_dict(row):
"""
Create a properties dictionary from a pandas Series, filtering out invalid values.
Args:
row (pd.Series): Row containing properties
Returns:
dict: Filtered properties dictionary
"""
return {k: v for k, v in row.items() if is_valid_value(v)}
def build_graph(dataframe):
"""
Build a NetworkX graph from a dataframe containing nodes and edges.
Args:
dataframe (pd.DataFrame): DataFrame with node and edge data
Returns:
nx.Graph: Constructed graph
"""
graph = nx.Graph()
# Separate and process nodes and edges efficiently
nodes_df = dataframe[dataframe[NODE_OR_EDGE_COLUMN] == NODE_ROW]
edges_df = dataframe[dataframe[NODE_OR_EDGE_COLUMN] == EDGE_ROW]
# Add nodes
if not nodes_df.empty:
for _, row in nodes_df.iterrows():
graph.add_node(row[NODE_ID_COLUMN], size=1,
properties=create_properties_dict(row))
# Add edges
if not edges_df.empty:
for _, row in edges_df.iterrows():
graph.add_edge(row[SOURCE_ID_COLUMN], row[TARGET_ID_COLUMN],
weight=1, properties=create_properties_dict(row))
return graph
def create_edge_traces(graph, positions):
"""
Create Plotly traces for graph edges and their midpoint markers.
Args:
graph (nx.Graph): NetworkX graph
positions (dict): Node positions from layout algorithm
Returns:
tuple: (edge_trace, mnode_trace) - Plotly scatter traces
"""
edge_x, edge_y = [], []
mnode_x, mnode_y, mnode_txt = [], [], []
# Process all edges efficiently
for source, target, edge_data in graph.edges(data=True):
x0, y0 = positions[source]
x1, y1 = positions[target]
# Add edge coordinates (with None separator for line breaks)
edge_x.extend([x0, x1, None])
edge_y.extend([y0, y1, None])
# Create hover text for edge midpoint
properties = edge_data.get('properties', {})
valid_props = {k: v for k, v in properties.items() if is_valid_value(v)}
prop_text = '<br>'.join(f'{key}: {value}' for key, value in valid_props.items())
text = f'source: {source} destination: {target}<br>Properties: {prop_text}'
# Add midpoint coordinates and text
mnode_x.append((x0 + x1) * 0.5)
mnode_y.append((y0 + y1) * 0.5)
mnode_txt.append(text)
# Create traces
edge_trace = go.Scatter(
x=edge_x, y=edge_y,
line=dict(width=0.5, color='#888'),
hoverinfo='none', mode='lines'
)
mnode_trace = go.Scatter(
x=mnode_x, y=mnode_y, text=mnode_txt,
mode="markers", hoverinfo='text', opacity=0.5,
marker=dict(color='LightSkyBlue', size=2, line_width=1)
)
return edge_trace, mnode_trace
def create_node_trace(graph, positions):
"""
Create Plotly trace for graph nodes.
Args:
graph (nx.Graph): NetworkX graph
positions (dict): Node positions from layout algorithm
Returns:
go.Scatter: Plotly scatter trace for nodes
"""
nodes_list = list(graph.nodes())
num_nodes = len(nodes_list)
inv_num_nodes = 1.0 / num_nodes if num_nodes > 0 else 0
# Extract coordinates and calculate metrics
node_x = [positions[node][0] for node in nodes_list]
node_y = [positions[node][1] for node in nodes_list]
node_adjacencies = []
node_text = []
node_sizes = []
for node in nodes_list:
num_connections = len(graph[node])
node_adjacencies.append(num_connections)
node_sizes.append(10 + num_connections * inv_num_nodes)
# Create hover text
node_properties = graph.nodes[node].get('properties', {})
valid_props = {k: v for k, v in node_properties.items() if is_valid_value(v)}
prop_text = '<br>'.join(f'{key}: {value}' for key, value in valid_props.items())
text = f'# of connections: {num_connections}<br>Properties: {prop_text}'
node_text.append(text)
return go.Scatter(
x=node_x, y=node_y, text=node_text,
mode='markers', hoverinfo='text',
marker=dict(
colorscale=COLORSCALE_ID,
color=node_adjacencies, size=node_sizes,
line=dict(width=2, color='#888')
)
)
def create_plotly_figure(graph):
"""
Create a complete Plotly figure from a NetworkX graph.
Args:
graph (nx.Graph): NetworkX graph to visualize
Returns:
go.Figure: Complete Plotly figure
"""
# Calculate layout
positions = nx.layout.spring_layout(graph)
# Create traces
edge_trace, mnode_trace = create_edge_traces(graph, positions)
node_trace = create_node_trace(graph, positions)
# Create figure
return go.Figure(
data=[edge_trace, node_trace, mnode_trace],
layout=go.Layout(
title=f'<br>{DIAGRAM_TITLE}<br>',
showlegend=False, hovermode='closest',
margin=dict(b=20, l=5, r=5, t=40),
annotations=[dict(
text="Created using plotly, networkx and the python plugin of Kusto",
showarrow=False, xref="paper", yref="paper",
x=0.005, y=-0.002
)],
xaxis=dict(showgrid=False, zeroline=False, showticklabels=False),
yaxis=dict(showgrid=False, zeroline=False, showticklabels=False)
)
)
# Main execution
graph = build_graph(df)
figure = create_plotly_figure(graph)
plotly_obj = figure.to_json()
result = pd.DataFrame(data=[plotly_obj], columns=['plotly'])
```;
let E = view() { edges };
let V = view() { nodes };
union withsource=tableName E, V
| evaluate python(
//
typeof(plotly:string),
pythonCodeBlueprint,
// Parameter configuration for graph visualization
// Customize these values to adapt the visualization to your data schema and preferences
bag_pack(
// Data schema mapping - configure these based on your data structure
'node_or_edge_column', 'tableName', // Column that distinguishes nodes from edges (source table name)
'node_row', 'V', // Value in discriminator column identifying node records
'node_id_column', node_id_column, // Column containing unique node identifiers
'edge_row', 'E', // Value in discriminator column identifying edge records
'source_id_column', source_id_column, // Column containing source node IDs for edges
'target_id_column', target_id_column, // Column containing target node IDs for edges
// Visualization appearance settings
'colorscale_id', colorscale_id, // Plotly colorscale: YlGnBu, Viridis, Plasma, Inferno, Magma, Cividis, etc.
'diagram_title', diagram_title // Title displayed at the top of the graph visualization
))
};
let nodes = datatable (nodeId:string, nodeType:string, importance:int)[
'A', 'server', 5,
'B', 'database', 3,
'C', 'workstation', 1,
'D', 'router', 4,
'E', 'firewall', 5,
'F', 'workstation', 1
];
let edges = datatable (sourceId:string, targetId:string, connectionType:string)[
'A', 'B', 'sql',
'A', 'D', 'network',
'B', 'C', 'query',
'C', 'D', 'network',
'D', 'E', 'security',
'E', 'F', 'network'
];
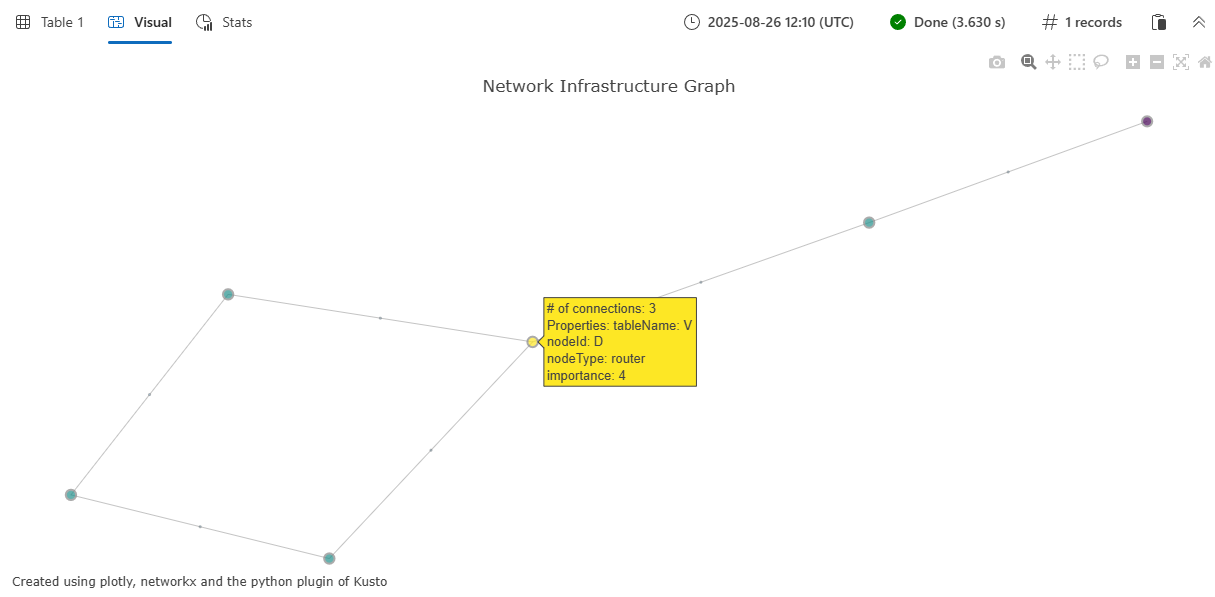
plotly_graph_fl(edges, nodes,
node_id_column="nodeId",
source_id_column="sourceId",
target_id_column="targetId",
colorscale_id="Viridis",
diagram_title="Network Infrastructure Graph")
| render plotly
输出
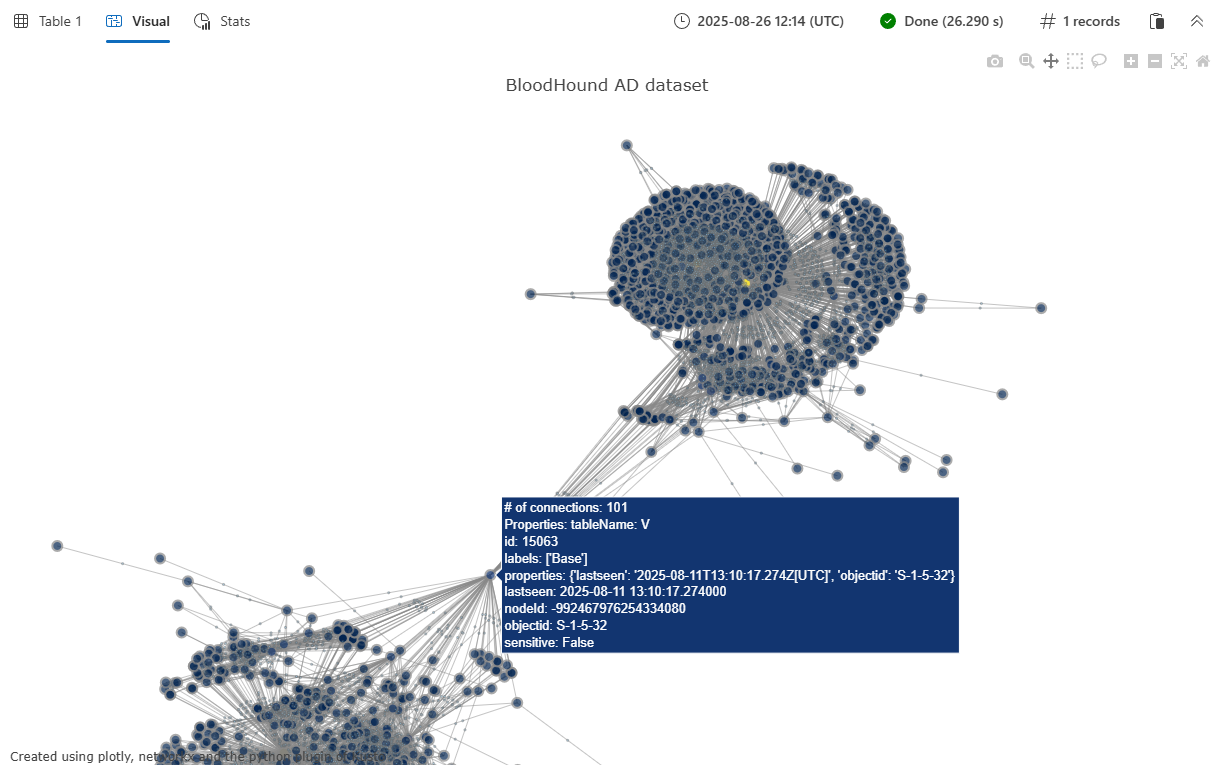
示例 2:BloodHound AD 数据集可视化
此示例演示了使用 BloodHound Active Directory 数据集对更大、更复杂的图形的可视化效果。 BloodHound AD 图包含Active Directory环境中的安全关系和潜在攻击路径。 有关此数据集和其他可用图形数据集的详细信息,请参阅 Graph 示例数据集和示例。
重要
若要使此示例成功运行,必须先运行 函数定义 代码来存储函数。
let G = graph('BloodHound_AD');
let E = G
    | graph-to-table edges with_source_id=sourceId with_target_id=targetId;
let V = G
    | graph-to-table nodes with_node_id=nodeId;
plotly_graph_fl(E, V, node_id_column="nodeId", source_id_column="sourceId", target_id_column="targetId", diagram_title="BloodHound AD dataset")
| render plotly
输出是可以使用“| 呈现的 Plotly JSON 字符串”呈现绘图或Azure Data Explorer仪表板磁贴中。 有关创建仪表板磁贴的详细信息,请参阅使用Azure Data Explorer仪表板来可视化数据。
该函数返回一个单列表,其中包含 plotly 交互式图形可视化效果的 JSON 表示形式。 在支持 Plotly 可视化效果的 Kusto 环境中呈现时,此图显示为交互式网络图,如下所示:
- 表示为彩色圆圈的节点,其大小与其连接成正比
- 作为连接相关节点的线条绘制的边缘
- 显示节点和边缘属性的交互式悬停工具提示
- 基于指定色阶的可自定义配色方案
- 自动定位节点以实现最佳可视化效果的春季强制布局
可视化效果包括节点属性(如 nodeType 示例和 importance 示例中)和悬停工具提示中的边缘属性(例如 connectionType),以便轻松浏览图形数据中的关系和属性。